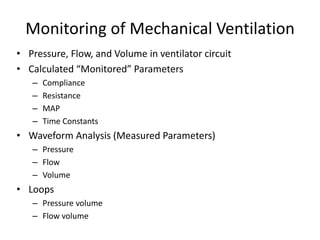
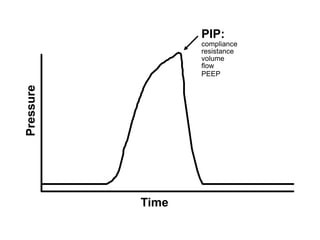
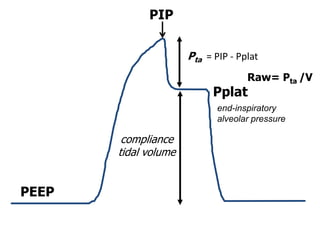
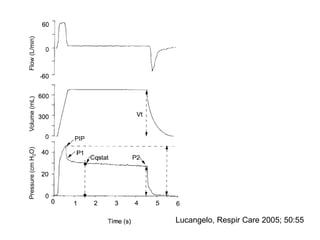
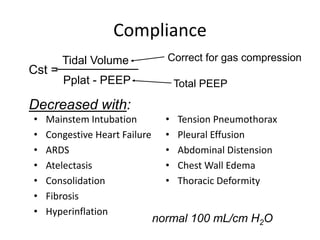
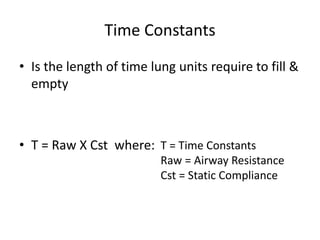
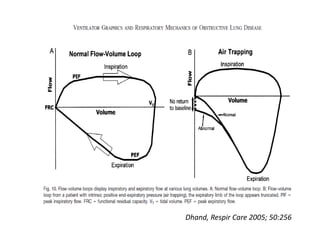
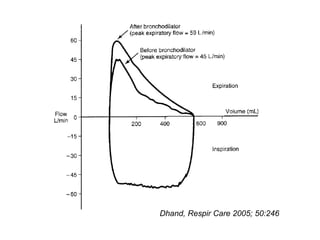
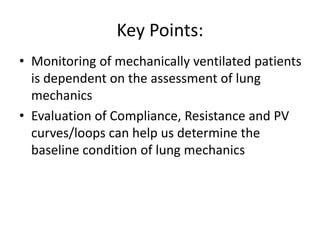
Monitoring of Mechanical
Ventilation
Olu Albert, MPH,RRT
Clinical Manager
Respiratory Care, ASIA PACIFIC
Philips Health
Monitoring of Mechanical Ventilation
• Pressure, Flow, and Volume in ventilator circuit
• Calculated “Monitored” Parameters
– Compliance
– Resistance
– MAP
– Time Constants
• Waveform Analysis (Measured Parameters)
– Pressure
– Flow
– Volume
• Loops
– Pressure volume
– Flow volume
Calculated Parameters
Pressure
Time
PIP:
compliance
resistance
volume
flow
PEEP
PEEP
PEEP
PIP
Pplat
Raw= Pta /V
compliance
tidal volume
end-inspiratory
alveolar pressure
Pta = PIP - Pplat
PIP
Pressure(cmH2O)Volume(mL)Flow(L/min)
Lucangelo, Respir Care 2005; 50:55
Monitoring Compliance and Airway
Resistance
normal 100 mL/cm H2O
Cst =
Pplat - PEEP
Tidal Volume
Compliance
• Mainstem Intubation
• Congestive Heart Failure
• ARDS
• Atelectasis
• Consolidation
• Fibrosis
• Hyperinflation
• Tension Pneumothorax
• Pleural Effusion
• Abdominal Distension
• Chest Wall Edema
• Thoracic Deformity
Decreased with:
Correct for gas compression
Total PEEP
Increased with:
Raw =
PIP - Pplat
flow
Airway Resistance (Raw)
• Secretions
• Bronchospasm
• Small endotracheal tube
• Mucosal edema
Normal: 5 - 10 cm H2O/L/s for intubated ventilated adults
measure with 60 L/min (1 L/s)
constant flow
Calculation of Cs & Raw
A patient is volume ventilated at the
following settings: PIP = 24 cmH20, Pplt
= 17 cmH20, and VT = 400 ml, PEEP = 5
cmH20. What is Pta? What is the Cst?
Flow was 35 L/min. What is the Raw? Is
the Raw normal?
• Pta = PIP – Pplt = 24-17 = 7 cmH20
• Cst = VT /Pplt-PEEP =400 ml/(17-
5cmH20)= 33.3mL/cmH20
• Raw = Pta/Flow
Flow = 35 L/min, 35 L/60 sec = 0.58 L/s
Raw = 7 cmH20/0.58 L/s = 12 cmH20/L/sec
Pplat 30 cm H2O
Transpulmonary
Pressure = 15 cm H2O
Pplat = Palv;
Pplat = Transpulmonary Pressure?
+15 cm H2O
Stiff chest wall
PCV 20 cm H2O,
PEEP 10 cm
H2O =Pplat 30
cm H2O
-15 cm H2O
Transpulmonary
Pressure = 45 cm H2O
Active inspiratory effort
Pplat = Palv;
Pplat = Transpulmonary Pressure?
Pplat 30 cm H2O,
VCV
Pplat 30 cm H2O,
PCV
Active inspiratory effort
Pplat 30 cm H2O,
VCV
Pplat = Palv;
Pplat = Transpulmonary Pressure?
Risk of VILI may be different with the same Pplat
Mean Airway Pressure (MAP)
• MAP is affected by PIP, PEEP, Total Cycle Time
(TCT) and RR
• MAP = ½ (PIP-PEEP) x (Ti/TCT) + PEEP
• MAP is useful to monitor to assess the
benefits and side effects of Positive Pressure
Ventilation (= Mean Alveolar Pressure)
Time Constants
Time Constants
• Is the length of time lung units require to fill &
empty
• T = Raw X Cst where: T = Time Constants
Raw = Airway Resistance
Cst = Static Compliance
Clinical Applications: Time Constant
• “Fast” alveoli = short time constant (fast filling)
--Pulmonary fibrosis (low Cst & low Raw)
• “Slow” alveoli = long time constant (slow filling)
--Asthma (high Cst & high Raw)
Waveform Analysis
Pressure-Controlled Ventilation
Lucangelo, Respir Care 2005; 50:55
Pressure-Controlled Ventilation
Increasing airways resistance
Decreasing lung compliance
Lucangelo, Respir Care 2005; 50:55
WK505 Effort
Nilsestuen, Respir Care 2005; 50:202-232
Volume-Controlled Ventilation
Recognizing Auto-PEEP
set PEEP
auto PEEP
pressure
time
PIP PIP
No active exhalation or inspiratory effort
Treats lungs as single compartment
Dhand, Respir Care 2005; 50:251
Problems with Auto-PEEP
• Increased Pplat and over-distention
– Increase work-of-breathing
– Hemodynamic effects
– Pneumothorax
• Difficulty triggering ventilator
sensitivity
-1 cm H2O
auto-PEEP
10 cm H2O
trigger effort = 11 cm H2O
sensitivity
-1 cm H2O
auto-PEEP
3 cm H2O
trigger effort = 4 cm H2O
PEEP
7 cm H2O
PEEP
10 cm H2O
PEEP
10 cm H2O
Auto-PEEP should be measured with set PEEP = 0
Ways to reduce Auto-PEEP:
• Increasing inspiratory flow
• Reduce minute ventilation (Ve)
• Suctioning the patient
• Changing the modes to allow for more
spontaneous breaths
In VCV, use the following to evaluate
the graphics:
• What is the flow pattern?
• What is the PEFR
• Is auto-PEEP present?
• Is a leak present?
• What is PIP?
• Is flow to the patient adequate?
• Has the sensitivity been set appropriately?
Pressure-Volume Loops
0 10 20 30 40
00.40.81.21.6
normal
ARDS
airway pressure (cm H2O)
volumeaboveFRC(liters)
lower inflection
point
upper inflection
point
Flow-Volume Loop
Dhand, Respir Care 2005; 50:256
Dhand, Respir Care 2005; 50:246
Key Points:
• Monitoring of mechanically ventilated patients
is dependent on the assessment of lung
mechanics
• Evaluation of Compliance, Resistance and PV
curves/loops can help us determine the
baseline condition of lung mechanics

Monitoring of Mechanical Ventilation by OluAlbert

  • 1.
    Monitoring of Mechanical Ventilation OluAlbert, MPH,RRT Clinical Manager Respiratory Care, ASIA PACIFIC Philips Health
  • 2.
    Monitoring of MechanicalVentilation • Pressure, Flow, and Volume in ventilator circuit • Calculated “Monitored” Parameters – Compliance – Resistance – MAP – Time Constants • Waveform Analysis (Measured Parameters) – Pressure – Flow – Volume • Loops – Pressure volume – Flow volume
  • 3.
  • 4.
  • 5.
    PEEP PIP Pplat Raw= Pta /V compliance tidalvolume end-inspiratory alveolar pressure Pta = PIP - Pplat
  • 6.
  • 7.
    Monitoring Compliance andAirway Resistance
  • 8.
    normal 100 mL/cmH2O Cst = Pplat - PEEP Tidal Volume Compliance • Mainstem Intubation • Congestive Heart Failure • ARDS • Atelectasis • Consolidation • Fibrosis • Hyperinflation • Tension Pneumothorax • Pleural Effusion • Abdominal Distension • Chest Wall Edema • Thoracic Deformity Decreased with: Correct for gas compression Total PEEP
  • 9.
    Increased with: Raw = PIP- Pplat flow Airway Resistance (Raw) • Secretions • Bronchospasm • Small endotracheal tube • Mucosal edema Normal: 5 - 10 cm H2O/L/s for intubated ventilated adults measure with 60 L/min (1 L/s) constant flow
  • 10.
    Calculation of Cs& Raw A patient is volume ventilated at the following settings: PIP = 24 cmH20, Pplt = 17 cmH20, and VT = 400 ml, PEEP = 5 cmH20. What is Pta? What is the Cst? Flow was 35 L/min. What is the Raw? Is the Raw normal?
  • 11.
    • Pta =PIP – Pplt = 24-17 = 7 cmH20 • Cst = VT /Pplt-PEEP =400 ml/(17- 5cmH20)= 33.3mL/cmH20 • Raw = Pta/Flow Flow = 35 L/min, 35 L/60 sec = 0.58 L/s Raw = 7 cmH20/0.58 L/s = 12 cmH20/L/sec
  • 12.
    Pplat 30 cmH2O Transpulmonary Pressure = 15 cm H2O Pplat = Palv; Pplat = Transpulmonary Pressure? +15 cm H2O Stiff chest wall
  • 13.
    PCV 20 cmH2O, PEEP 10 cm H2O =Pplat 30 cm H2O -15 cm H2O Transpulmonary Pressure = 45 cm H2O Active inspiratory effort Pplat = Palv; Pplat = Transpulmonary Pressure?
  • 14.
    Pplat 30 cmH2O, VCV Pplat 30 cm H2O, PCV Active inspiratory effort Pplat 30 cm H2O, VCV Pplat = Palv; Pplat = Transpulmonary Pressure? Risk of VILI may be different with the same Pplat
  • 16.
    Mean Airway Pressure(MAP) • MAP is affected by PIP, PEEP, Total Cycle Time (TCT) and RR • MAP = ½ (PIP-PEEP) x (Ti/TCT) + PEEP • MAP is useful to monitor to assess the benefits and side effects of Positive Pressure Ventilation (= Mean Alveolar Pressure)
  • 17.
  • 18.
    Time Constants • Isthe length of time lung units require to fill & empty • T = Raw X Cst where: T = Time Constants Raw = Airway Resistance Cst = Static Compliance
  • 19.
    Clinical Applications: TimeConstant • “Fast” alveoli = short time constant (fast filling) --Pulmonary fibrosis (low Cst & low Raw) • “Slow” alveoli = long time constant (slow filling) --Asthma (high Cst & high Raw)
  • 20.
  • 22.
  • 23.
    Pressure-Controlled Ventilation Increasing airwaysresistance Decreasing lung compliance Lucangelo, Respir Care 2005; 50:55
  • 24.
    WK505 Effort Nilsestuen, RespirCare 2005; 50:202-232 Volume-Controlled Ventilation
  • 25.
  • 26.
    set PEEP auto PEEP pressure time PIPPIP No active exhalation or inspiratory effort Treats lungs as single compartment
  • 27.
    Dhand, Respir Care2005; 50:251
  • 28.
    Problems with Auto-PEEP •Increased Pplat and over-distention – Increase work-of-breathing – Hemodynamic effects – Pneumothorax • Difficulty triggering ventilator
  • 29.
    sensitivity -1 cm H2O auto-PEEP 10cm H2O trigger effort = 11 cm H2O sensitivity -1 cm H2O auto-PEEP 3 cm H2O trigger effort = 4 cm H2O PEEP 7 cm H2O PEEP 10 cm H2O PEEP 10 cm H2O Auto-PEEP should be measured with set PEEP = 0
  • 30.
    Ways to reduceAuto-PEEP: • Increasing inspiratory flow • Reduce minute ventilation (Ve) • Suctioning the patient • Changing the modes to allow for more spontaneous breaths
  • 31.
    In VCV, usethe following to evaluate the graphics: • What is the flow pattern? • What is the PEFR • Is auto-PEEP present? • Is a leak present? • What is PIP? • Is flow to the patient adequate? • Has the sensitivity been set appropriately?
  • 32.
  • 33.
    0 10 2030 40 00.40.81.21.6 normal ARDS airway pressure (cm H2O) volumeaboveFRC(liters) lower inflection point upper inflection point
  • 35.
  • 36.
    Dhand, Respir Care2005; 50:256
  • 37.
    Dhand, Respir Care2005; 50:246
  • 38.
    Key Points: • Monitoringof mechanically ventilated patients is dependent on the assessment of lung mechanics • Evaluation of Compliance, Resistance and PV curves/loops can help us determine the baseline condition of lung mechanics