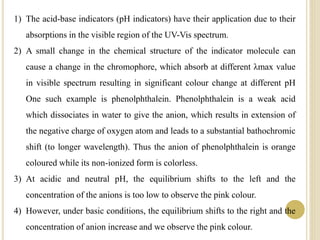
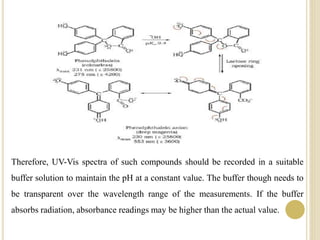
SlideShare a Scribd company logo
FACTOR AFFECTING UV-VIS ABSORPTION
M A D E B Y:Dr.G.C.Wadhawa
Assistant Professor Department of Chemistry Karmaveer
Bhaurao Patil College ,Vashi, Navimumbai
Date 25/03/2020
EFFECT OF SAMPLE TEMPERATURE
 The effect of temperature is less pronounced.
 However, simple thermal expansion of the solution
may be sufficient to change band intensity.
 Therefore to get more accurate results the
spectrum needs to taken at a specified or constant
temperature.
 The following three criteria may be given as
general effect of temperature on solution spectra.
 1. Band sharpness increases with decreasing
temperature.
 2. Position of absorption maximum does not move
or moves very little towards the longer wavelength
side, with decreasing temperature.
 3. The total absorption intensity is approximately
independent of the temperature.
Temperature Effect on the UV Spectra
 We know that the vibrational and rotational states depend on
the temperature. As the temperature is decreased, vibrational
and rotational energy states of the molecules are also
lowered. When, the absorption of light occurs at lower
temperature smaller distribution of excited states results,
which produces fine absorption bands than that of at high
temperature (figure ). It is also seen that positions of the band
maxima do not shift very much with decreasing temperature
but tend to move a very little towards the longer wavelength.
EFFECT OF SAMPLE CONCENTRATION
1) According to Lambert-Beer law it might be expected that the
sample concentration is directly proportional to the intensity
of the absorption.
2) But at high concentrations, molecular interactions can take
place causing changes to the position and shape of
absorption bands. Such effects need to be identified and
taken into consideration for quantitative work.
3) The solvent used also affects the fineness of absorption band in
UV-spectrum. It has been observed that polar solvents give rise to
broad bands, non-polar solvents show more resolution, while
completely removing the solvent gives the best resolution. This is
due to solvent-solute interaction.
4) If the dielectric constant of the solvent is high, there will be stronger
solute-solvent nteraction. For example, a polar solvent like water or
ethanol has the ability of hydrogen bonding with the solute if the solute
has a hydrogen bonding component, or simply through induced dipole-
dipole interactions.
5) The non-polar solvents can also interact though polarizability via
London interactions but the effect is very less. Depending on the
interaction, this can cause the round state and the excited state of the
solute to increase or decrease, thus changing the frequency of the
absorbed photon. Due to this, there are many different transition
energies that overlap in the spectra and cause the broadening of UV-
band.
EFFECT OF SAMPLE PH
1) The pH of the sample solution can also have a significant effect
on absorption spectra.
2) The absorption spectra of certain aromatic compounds such as
phenols and anilines change on changing the pH of the solution.
EFFECT OF SAMPLE PH
3) Phenols and substituted phenols are acidic and display sudden
changes in their absorptions maxima upon the addition of a base.
4) After the removal of the phenolic proton, we get phenoxide ion.In
the phenoxide ion lone pairs on the oxygen is delocalized over the π-
sytem of the aromatic ring and increases the conjugation of the same.
Extended conjugation leads to a decrease in the energy difference
between the HOMO and LUMO orbitals, which results in red or
bathochromic shift (to longer wavelength), along with an increase in
the intensity of the absorption.
EFFECT OF SAMPLE PH
 Similarly, an aromatic amine gets protonated in an acidic medium
which disturb the conjugation between the lone pair on nitrogen
atom and the aromatic π-system. As a result, blue shift or
hypsochromic shift (to shorter wavelength) is observed along with a
decrease in intensity
1) The acid-base indicators (pH indicators) have their application due to their
absorptions in the visible region of the UV-Vis spectrum.
2) A small change in the chemical structure of the indicator molecule can
cause a change in the chromophore, which absorb at different λmax value
in visible spectrum resulting in significant colour change at different pH
One such example is phenolphthalein. Phenolphthalein is a weak acid
which dissociates in water to give the anion, which results in extension of
the negative charge of oxygen atom and leads to a substantial bathochromic
shift (to longer wavelength). Thus the anion of phenolphthalein is orange
coloured while its non-ionized form is colorless.
3) At acidic and neutral pH, the equilibrium shifts to the left and the
concentration of the anions is too low to observe the pink colour.
4) However, under basic conditions, the equilibrium shifts to the right and the
concentration of anion increase and we observe the pink colour.
Therefore, UV-Vis spectra of such compounds should be recorded in a suitable
buffer solution to maintain the pH at a constant value. The buffer though needs to
be transparent over the wavelength range of the measurements. If the buffer
absorbs radiation, absorbance readings may be higher than the actual value.
EFFECT OF SOLVENT
1) The absorption spectrum depends on the solvent in which the
absorbing substance is dissolved.
2) The choice of solvent can shift peaks to shorter or longer
wavelengths. This depends on the nature of the interaction of the
particular solvent with the environment of the chromophore in the
molecule under study.
1) It is usually observed that ethanol solutions give absorption maxima at longer wavelength
than hexane solutions.
2) Water and alcohols can form hydrogen bonds which results the shifting of the bands of
polar substances. Since polarities of the ground and excited state of a chromophore are
different, hence a change in the solvent polarity will stabilize the ground and excited states
to different extent causing change in the energy gap between these electronic states.
3) Highly pure,non-polar solvents such as saturated hydrocarbons do not interact with solute
molecules either in the ground or excited state and the absorption spectrum of a compound
in these solvents is similar to the one in a pure gaseous state. However, polar solvents such
as water, alcohols etc may stabilize or destabilize the molecular orbitals of a molecule either
in the ground state or in excited state.
4) Therefore, the spectrum of a compound in these solvents may significantly vary from the
one recorded in a hydrocarbon solvent.
Π TO Π* TRANSITIONS
 In case of π to π* transitions, the excited states are more polar than the
ground state. If a polar solvent is used the dipole–dipole interaction reduces
the energy of the excited state more than the ground state. Thus a polar
solvent decreases the energy of π to π* transition and hence the absorption
in a polar solvent such as ethanol will be at a longer wavelength (red shift)
than in a non-polar solvent such as hexane.
N TO Π* TRANSITIONS
In case of n to π* transitions, the polar solvents form hydrogen bonds
with the ground state of polar molecules more readily than with their
excited states. Consequently the energy of ground state is decreased
which further causes the increase in energy difference between the
ground and excited energy levels. Therefore, absorption maxima
resulting from n to π* transitions are shifted to shorter wavelengths
(blue shift) with increasing solvent polarity.
EFFECT OF STERIC HINDRANCE
1) The UV-spectroscopy is very sensitive to the distortion of the chromophores.
2) We know that the position of absorption maximum and its intensity depend on the
length and effectiveness of the conjugative system.
3) Electronic conjugation works best when the molecule is planar in configuration.
4) If the presence of an auxochrome prevents the molecule from being planar then it
may lead to the red or blue shifts depending upon the nature of distortion.
5) For example, the diene I shown below is expected to show absorption maximum at
237 nm (linear 1,3-diene), but distortion of chromophore causes it to absorb at
220 nm. This blue shift is due to the loss of conjugation as the structure is not
planar.
EFFECT OF STERIC HINDRANCE
6) Similar trends can also be observed in compounds where geometrical
isomerism is possible. It is found that generally the trans-isomers show λmax
at a longer wavelength and Ɛmax (molarabsorptivity or molar extinction
coefficient) is higher than for the cis or mixed isomer. For example the trans-
stilbene (II) absorbs at longer wavelength with greater intensity (λmax = 295
nm, Ɛ = 27000) than the cis-stilbene (III, λmax = 280 nm, Ɛ = 13500) due to
steric effects. It is due to the more effective π-π orbital overlapping in the
trans-stilbene, which results in achieving coplanarity of π-system more readily
than in cis-stilbene. In cis-isomer, due to crowding (bulkygroups on the same
side of the double bond), planar geometry is distorted.
 Another example of such cases are biphenyl and its 2-methyl and 2,2’-
dimethyl analogues. Biphenyl system is not completely planar (two ring
being at an angle of 450) and in 2-methyl biphenyl the two rings are pushed
even further out of co-planarity resulting in the diminished π orbital overlap.
As a result, blue shift is observed with less intensity. The biphenyl (IV) has
λmax at 250 nm (Ɛ = 19000) and 2-methylbiphenyl (V) has λmax at 237 nm
(Ɛ = 10250).
EFFECTS OF CONJUGATION
 When two or more chromophores are conjugated the
absorption maxima is shifted to a larger wavelength or shorter
frequency.
 Conjugation increases the energy of the HOMO and
decreases the energy of LUMO. As a result less energy is
required for an electronic transition in a conjugated system
than in a non-conjugated system
 Below figure shows that as the number of conjugated double bonds
increases, the value of λmax also increases.
 The more conjugated double bonds there are in a compound, the less energy
is required for the electronic transition, and therefore the longer is the
wavelength at which the electronic transition occurs.
 It is noteworthy that conjugation of two chromophores not only increases
the λ but also increases the intensity (molar absorptivity). This effect of
conjugation can be shown by the spectra of the polyenes CH3-(CH=CH)n-
CH3, where n = 3, 4 and 5.
 In case of simple alkene (ethylene) we have only two molecular orbitals,
one is ground state π bonding orbital and the other is excited state π*
antibonding orbital. The energy gap between these two is 176 kcal/mol.
 But in case of conjugated dienes, the π molecular orbitals of the two
separate C=C groups combine to form two new bonding molecular orbitals
designated as ψ1 and ψ2, and two new anti-bonding molecular orbitals
designated as ψ3* and ψ4* . It is clear that the transition of lowest energy π
to π* transition in conjugated system is ψ2 (HOMO) to ψ4* (LUMO).
Hence we can say that the conjugated dienes absorb at relatively longer
wavelength than do isolated alkenes.
 As the number of conjugated double bonds is increased, the gap between
highest occupied molecular orbital (HOMO) and lowest unoccupied
molecular orbital (LUMO) is progressively lowered. Therefore, the increase
in size of the conjugated system gradually shifts the absorption maxima
(λmax) to longer wavelength.
 If a compound has enough conjugated double bonds, it will absorb visible
light and the compoundwill be colored. The β-carotene, a precursor of
vitamin A, has eleven conjugated double bonds and its absorption
maximum gets shifted from ultraviolet to the blue region of the visible
spectrum giving it an orange colour.
 In a similar fashion, methyl group also produce bathochromic shift.
Although methyl group do not have π electron or unshared electrons,
it is considered to interact with the π system through itC-H bonding
orbitals (hyperconjugation or sigma bond resonance).
Similarly in case of other conjugated chromophores (conjugation with a
hetero atom), the energy difference between HOMO and LUMO is lowered
resulting in bathochromic shift.
1) As discussed above, carbonyl compounds show both π to π* (intense and
shorter wavelength) and n to π* (less intense and longer wavelength)
transitions. 2)The introduction of polar substituent on the α-carbon of an
aliphatic carbonyl do not affect the n to π* transition. But in the case of cyclic
ketones, a bathochromic effect is observed. However, this effect is more when
the auxochrome is at axial position (10-30 nm) than that when it is present at
equatorial position (4-10 nm).3) Substitution on the carbonyl carbon by an
auxochrome with a lone pair of electrons such asamide, acids, esters, acid
chloride etc cause the increase in the energy of π* orbital, leaving the norbital
unaffected. As a result, n to π* transition is shifted to shorter wavelength
(hypsochromiceffect).
 However, a little bathochromic effect is observed on the transition π to π*. Such
bathochromic effects are caused by the resonance interaction between the C=O
and lone pair on the other hetero atom.
 4) If the carbonyl group is conjugated with a C-C double bond i.e. α,β-
unsaturated carbonyl compounds, both π to π* and n to π* transitions shift to at
longer wavelength compared to the unconjugated carbonyl compounds.
However the energy of the n to π* transition does not decrease as rapidly as that
of the π to π* band. If the conjugated chain becomes long enough, the n to π*
band is buried into the more intense π to π* band system. shows the molecular
orbitals of α,β-unsaturated carbonyl system along with the isolated C=C bond
and carbonyl group

More Related Content

What's hot

IR - Spectroscopy, theory, modes of vibration and sample handling. by Dr. Ume...
IR - Spectroscopy, theory, modes of vibration and sample handling. by Dr. Ume...IR - Spectroscopy, theory, modes of vibration and sample handling. by Dr. Ume...
IR - Spectroscopy, theory, modes of vibration and sample handling. by Dr. Ume...
Dr. UMESH KUMAR SHARMA
 
factors affecting fluorescence & phosphorescence
 factors affecting fluorescence & phosphorescence factors affecting fluorescence & phosphorescence
factors affecting fluorescence & phosphorescence
Ramsha Afzal
 
Ultra violet (UV) spectroscopy, introduction,principle instrumentation,differ...
Ultra violet (UV) spectroscopy, introduction,principle instrumentation,differ...Ultra violet (UV) spectroscopy, introduction,principle instrumentation,differ...
Ultra violet (UV) spectroscopy, introduction,principle instrumentation,differ...
mariomS7
 
Factors affecting vibrational frequencies in IR
Factors affecting vibrational frequencies in IRFactors affecting vibrational frequencies in IR
Factors affecting vibrational frequencies in IR
Rashmi Raveendran
 
Chemical shift
Chemical shiftChemical shift
Chemical shift
Arantha Jessy Joseph
 
Overtone & fermi resonance in IR
Overtone & fermi resonance in IROvertone & fermi resonance in IR
Overtone & fermi resonance in IR
Mahgull Syed
 
Light sources for atomic absorption spectroscopy (aas)
Light sources for atomic absorption spectroscopy (aas)Light sources for atomic absorption spectroscopy (aas)
Light sources for atomic absorption spectroscopy (aas)
Dr. Mallikarjunaswamy C
 
Uv spectroscopy
Uv  spectroscopyUv  spectroscopy
Uv spectroscopy
Harpreet Kaur
 
Ir principle and factors affecting-lakshmi priya
Ir  principle and factors affecting-lakshmi priyaIr  principle and factors affecting-lakshmi priya
Ir principle and factors affecting-lakshmi priya
suhasini
 
IR spectroscopy
IR spectroscopyIR spectroscopy
Thermogravimetric analysis ppt
Thermogravimetric analysis pptThermogravimetric analysis ppt
Thermogravimetric analysis ppt
yudhishthir singh
 
Nmr spectroscopy
Nmr spectroscopyNmr spectroscopy
Nmr spectroscopy
Asma Ashraf
 
Factors affecting chemical shift
Factors affecting chemical shiftFactors affecting chemical shift
Factors affecting chemical shift
Taher Patel
 
Spin spin coupling and coupling constant
Spin spin coupling and coupling constantSpin spin coupling and coupling constant
Spin spin coupling and coupling constant
Himal Barakoti
 
Infrared spectroscopy
Infrared spectroscopyInfrared spectroscopy
Infrared spectroscopyNida Ashraf
 
Mass Spectroscopy
Mass Spectroscopy Mass Spectroscopy
Mass Spectroscopy
Rahul Krishnan
 
UV visible spectroscopy ( electronic spectroscopy)
UV visible spectroscopy ( electronic spectroscopy)UV visible spectroscopy ( electronic spectroscopy)
UV visible spectroscopy ( electronic spectroscopy)
ushaSanmugaraj
 
Plate theory of Chromatography
Plate theory of ChromatographyPlate theory of Chromatography
Plate theory of Chromatography
PallaviNayyer
 
Absorption shifts (Chromophores and Auxophores Concept)
Absorption shifts (Chromophores and Auxophores Concept)Absorption shifts (Chromophores and Auxophores Concept)
Absorption shifts (Chromophores and Auxophores Concept)
Dr Duggirala Mahendra
 
Various factor affecting vibrational frequency in IR spectroscopy.
Various factor affecting vibrational frequency in IR spectroscopy.Various factor affecting vibrational frequency in IR spectroscopy.
Various factor affecting vibrational frequency in IR spectroscopy.
vishvajitsinh Bhati
 

What's hot (20)

IR - Spectroscopy, theory, modes of vibration and sample handling. by Dr. Ume...
IR - Spectroscopy, theory, modes of vibration and sample handling. by Dr. Ume...IR - Spectroscopy, theory, modes of vibration and sample handling. by Dr. Ume...
IR - Spectroscopy, theory, modes of vibration and sample handling. by Dr. Ume...
 
factors affecting fluorescence & phosphorescence
 factors affecting fluorescence & phosphorescence factors affecting fluorescence & phosphorescence
factors affecting fluorescence & phosphorescence
 
Ultra violet (UV) spectroscopy, introduction,principle instrumentation,differ...
Ultra violet (UV) spectroscopy, introduction,principle instrumentation,differ...Ultra violet (UV) spectroscopy, introduction,principle instrumentation,differ...
Ultra violet (UV) spectroscopy, introduction,principle instrumentation,differ...
 
Factors affecting vibrational frequencies in IR
Factors affecting vibrational frequencies in IRFactors affecting vibrational frequencies in IR
Factors affecting vibrational frequencies in IR
 
Chemical shift
Chemical shiftChemical shift
Chemical shift
 
Overtone & fermi resonance in IR
Overtone & fermi resonance in IROvertone & fermi resonance in IR
Overtone & fermi resonance in IR
 
Light sources for atomic absorption spectroscopy (aas)
Light sources for atomic absorption spectroscopy (aas)Light sources for atomic absorption spectroscopy (aas)
Light sources for atomic absorption spectroscopy (aas)
 
Uv spectroscopy
Uv  spectroscopyUv  spectroscopy
Uv spectroscopy
 
Ir principle and factors affecting-lakshmi priya
Ir  principle and factors affecting-lakshmi priyaIr  principle and factors affecting-lakshmi priya
Ir principle and factors affecting-lakshmi priya
 
IR spectroscopy
IR spectroscopyIR spectroscopy
IR spectroscopy
 
Thermogravimetric analysis ppt
Thermogravimetric analysis pptThermogravimetric analysis ppt
Thermogravimetric analysis ppt
 
Nmr spectroscopy
Nmr spectroscopyNmr spectroscopy
Nmr spectroscopy
 
Factors affecting chemical shift
Factors affecting chemical shiftFactors affecting chemical shift
Factors affecting chemical shift
 
Spin spin coupling and coupling constant
Spin spin coupling and coupling constantSpin spin coupling and coupling constant
Spin spin coupling and coupling constant
 
Infrared spectroscopy
Infrared spectroscopyInfrared spectroscopy
Infrared spectroscopy
 
Mass Spectroscopy
Mass Spectroscopy Mass Spectroscopy
Mass Spectroscopy
 
UV visible spectroscopy ( electronic spectroscopy)
UV visible spectroscopy ( electronic spectroscopy)UV visible spectroscopy ( electronic spectroscopy)
UV visible spectroscopy ( electronic spectroscopy)
 
Plate theory of Chromatography
Plate theory of ChromatographyPlate theory of Chromatography
Plate theory of Chromatography
 
Absorption shifts (Chromophores and Auxophores Concept)
Absorption shifts (Chromophores and Auxophores Concept)Absorption shifts (Chromophores and Auxophores Concept)
Absorption shifts (Chromophores and Auxophores Concept)
 
Various factor affecting vibrational frequency in IR spectroscopy.
Various factor affecting vibrational frequency in IR spectroscopy.Various factor affecting vibrational frequency in IR spectroscopy.
Various factor affecting vibrational frequency in IR spectroscopy.
 

Similar to Factors affecting uv visible spectroscopy

Fluorimetry-M0dern pharmaceutical analysis[1].pptx
Fluorimetry-M0dern pharmaceutical analysis[1].pptxFluorimetry-M0dern pharmaceutical analysis[1].pptx
Fluorimetry-M0dern pharmaceutical analysis[1].pptx
bhuvismail007
 
U1 C1 UV Spectroscopy.pptx
U1 C1 UV Spectroscopy.pptxU1 C1 UV Spectroscopy.pptx
U1 C1 UV Spectroscopy.pptx
Ankita Raikwar
 
Ultraviolet and visible spectroscopy
Ultraviolet and visible spectroscopyUltraviolet and visible spectroscopy
Ultraviolet and visible spectroscopy
Diksha Kataria
 
ir spectroscopy principle introductuion procedure
ir spectroscopy principle introductuion procedureir spectroscopy principle introductuion procedure
ir spectroscopy principle introductuion procedure
SathishKumar252021
 
Solvents and solvent effect in UV - Vis Spectroscopy, By Dr. Umesh Kumar sh...
Solvents and  solvent effect in UV -  Vis Spectroscopy, By Dr. Umesh Kumar sh...Solvents and  solvent effect in UV -  Vis Spectroscopy, By Dr. Umesh Kumar sh...
Solvents and solvent effect in UV - Vis Spectroscopy, By Dr. Umesh Kumar sh...
Dr. UMESH KUMAR SHARMA
 
Effect of solvent
Effect of solventEffect of solvent
Effect of solvent
Mahendra G S
 
Spectroscopy الشيث الرابع.pptx
Spectroscopy الشيث الرابع.pptxSpectroscopy الشيث الرابع.pptx
Spectroscopy الشيث الرابع.pptx
MajdolenAhrki
 
UV-visible spectrophotometry ppt
UV-visible spectrophotometry ppt UV-visible spectrophotometry ppt
UV-visible spectrophotometry ppt
rdeepthi1
 
Effect of Solvent in UV-by M.Qasim.pptx
Effect of Solvent in UV-by M.Qasim.pptxEffect of Solvent in UV-by M.Qasim.pptx
Effect of Solvent in UV-by M.Qasim.pptx
MEMORISEME
 
UV-VISIBLE SPECTROSCOPY.pptx
UV-VISIBLE SPECTROSCOPY.pptxUV-VISIBLE SPECTROSCOPY.pptx
UV-VISIBLE SPECTROSCOPY.pptx
sanjayudps2016
 
Fluorometry PPT file.ppt
Fluorometry PPT file.pptFluorometry PPT file.ppt
Fluorometry PPT file.ppt
AbdulAziz685234
 
UV- Visible Spectroscopy
UV- Visible SpectroscopyUV- Visible Spectroscopy
UV- Visible Spectroscopy
ROHIT
 
UV spectroscopy ppt.
UV spectroscopy ppt.UV spectroscopy ppt.
UV spectroscopy ppt.
AniketSuryawanshi44
 
Chemical shift and factors affecting chemical shift (2)
Chemical shift and factors affecting chemical shift (2)Chemical shift and factors affecting chemical shift (2)
Chemical shift and factors affecting chemical shift (2)
Aishwarya Mahangade
 
UV VISIBLE SPECTRO Final.pptx
UV VISIBLE SPECTRO Final.pptxUV VISIBLE SPECTRO Final.pptx
UV VISIBLE SPECTRO Final.pptx
HemantThakare8
 
Flourimetry
FlourimetryFlourimetry
Flourimetry
nehla313
 
Spectrofluorometry.ppt
Spectrofluorometry.pptSpectrofluorometry.ppt
Spectrofluorometry.ppt
drpvczback
 
UV Visible Spectroscopy
UV Visible SpectroscopyUV Visible Spectroscopy
UV Visible Spectroscopy
SimranDhiman12
 
Presentation2
Presentation2Presentation2
Presentation2
Sweetz Gkv George
 

Similar to Factors affecting uv visible spectroscopy (20)

Fluorimetry-M0dern pharmaceutical analysis[1].pptx
Fluorimetry-M0dern pharmaceutical analysis[1].pptxFluorimetry-M0dern pharmaceutical analysis[1].pptx
Fluorimetry-M0dern pharmaceutical analysis[1].pptx
 
U1 C1 UV Spectroscopy.pptx
U1 C1 UV Spectroscopy.pptxU1 C1 UV Spectroscopy.pptx
U1 C1 UV Spectroscopy.pptx
 
Ultraviolet and visible spectroscopy
Ultraviolet and visible spectroscopyUltraviolet and visible spectroscopy
Ultraviolet and visible spectroscopy
 
ir spectroscopy principle introductuion procedure
ir spectroscopy principle introductuion procedureir spectroscopy principle introductuion procedure
ir spectroscopy principle introductuion procedure
 
Solvents and solvent effect in UV - Vis Spectroscopy, By Dr. Umesh Kumar sh...
Solvents and  solvent effect in UV -  Vis Spectroscopy, By Dr. Umesh Kumar sh...Solvents and  solvent effect in UV -  Vis Spectroscopy, By Dr. Umesh Kumar sh...
Solvents and solvent effect in UV - Vis Spectroscopy, By Dr. Umesh Kumar sh...
 
Effect of solvent
Effect of solventEffect of solvent
Effect of solvent
 
Spectroscopy الشيث الرابع.pptx
Spectroscopy الشيث الرابع.pptxSpectroscopy الشيث الرابع.pptx
Spectroscopy الشيث الرابع.pptx
 
UV-visible spectrophotometry ppt
UV-visible spectrophotometry ppt UV-visible spectrophotometry ppt
UV-visible spectrophotometry ppt
 
Effect of Solvent in UV-by M.Qasim.pptx
Effect of Solvent in UV-by M.Qasim.pptxEffect of Solvent in UV-by M.Qasim.pptx
Effect of Solvent in UV-by M.Qasim.pptx
 
UV-VISIBLE SPECTROSCOPY.pptx
UV-VISIBLE SPECTROSCOPY.pptxUV-VISIBLE SPECTROSCOPY.pptx
UV-VISIBLE SPECTROSCOPY.pptx
 
Fluorometry PPT file.ppt
Fluorometry PPT file.pptFluorometry PPT file.ppt
Fluorometry PPT file.ppt
 
UV- Visible Spectroscopy
UV- Visible SpectroscopyUV- Visible Spectroscopy
UV- Visible Spectroscopy
 
UV spectroscopy ppt.
UV spectroscopy ppt.UV spectroscopy ppt.
UV spectroscopy ppt.
 
Chemical shift and factors affecting chemical shift (2)
Chemical shift and factors affecting chemical shift (2)Chemical shift and factors affecting chemical shift (2)
Chemical shift and factors affecting chemical shift (2)
 
UV VISIBLE SPECTRO Final.pptx
UV VISIBLE SPECTRO Final.pptxUV VISIBLE SPECTRO Final.pptx
UV VISIBLE SPECTRO Final.pptx
 
Flourimetry
FlourimetryFlourimetry
Flourimetry
 
Spectrofluorometry.ppt
Spectrofluorometry.pptSpectrofluorometry.ppt
Spectrofluorometry.ppt
 
UV Visible Spectroscopy
UV Visible SpectroscopyUV Visible Spectroscopy
UV Visible Spectroscopy
 
Presentation2
Presentation2Presentation2
Presentation2
 
NMR 7..pptx
NMR 7..pptxNMR 7..pptx
NMR 7..pptx
 

More from wadhava gurumeet

Chemoinformatic File Format.pptx
Chemoinformatic File Format.pptxChemoinformatic File Format.pptx
Chemoinformatic File Format.pptx
wadhava gurumeet
 
Geographical Indicators
Geographical IndicatorsGeographical Indicators
Geographical Indicators
wadhava gurumeet
 
Gas Chromatography PPT GCW.pptx
Gas Chromatography PPT GCW.pptxGas Chromatography PPT GCW.pptx
Gas Chromatography PPT GCW.pptx
wadhava gurumeet
 
Errors PPt.pptx
Errors PPt.pptxErrors PPt.pptx
Errors PPt.pptx
wadhava gurumeet
 
Advance Green Chemistry.ppt
Advance Green Chemistry.pptAdvance Green Chemistry.ppt
Advance Green Chemistry.ppt
wadhava gurumeet
 
analytical dose.pptx
analytical dose.pptxanalytical dose.pptx
analytical dose.pptx
wadhava gurumeet
 
Antibiotic Drug.ppt
Antibiotic Drug.pptAntibiotic Drug.ppt
Antibiotic Drug.ppt
wadhava gurumeet
 
Assay In Drug Analysis.ppt
Assay In Drug Analysis.pptAssay In Drug Analysis.ppt
Assay In Drug Analysis.ppt
wadhava gurumeet
 
bioassay.pptx
bioassay.pptxbioassay.pptx
bioassay.pptx
wadhava gurumeet
 
Biological Catalyst.pptx
Biological Catalyst.pptxBiological Catalyst.pptx
Biological Catalyst.pptx
wadhava gurumeet
 
Drug Discovery.pptx
Drug Discovery.pptxDrug Discovery.pptx
Drug Discovery.pptx
wadhava gurumeet
 
Green Chemistry.ppt
Green Chemistry.pptGreen Chemistry.ppt
Green Chemistry.ppt
wadhava gurumeet
 
Introduction to Pharmaceuticak Industry.pptx
Introduction to Pharmaceuticak Industry.pptxIntroduction to Pharmaceuticak Industry.pptx
Introduction to Pharmaceuticak Industry.pptx
wadhava gurumeet
 
Mevolonic Acid.pptx
Mevolonic Acid.pptxMevolonic Acid.pptx
Mevolonic Acid.pptx
wadhava gurumeet
 
Neighbouring Group Participation.pptx
Neighbouring Group Participation.pptxNeighbouring Group Participation.pptx
Neighbouring Group Participation.pptx
wadhava gurumeet
 
solid support.ppt
solid support.pptsolid support.ppt
solid support.ppt
wadhava gurumeet
 
Sonochemistry.pptx
Sonochemistry.pptxSonochemistry.pptx
Sonochemistry.pptx
wadhava gurumeet
 
Spectrophotometry.pptx
Spectrophotometry.pptxSpectrophotometry.pptx
Spectrophotometry.pptx
wadhava gurumeet
 
stability study.pptx
stability study.pptxstability study.pptx
stability study.pptx
wadhava gurumeet
 

More from wadhava gurumeet (20)

Chemoinformatic File Format.pptx
Chemoinformatic File Format.pptxChemoinformatic File Format.pptx
Chemoinformatic File Format.pptx
 
Geographical Indicators
Geographical IndicatorsGeographical Indicators
Geographical Indicators
 
Gas Chromatography PPT GCW.pptx
Gas Chromatography PPT GCW.pptxGas Chromatography PPT GCW.pptx
Gas Chromatography PPT GCW.pptx
 
Errors PPt.pptx
Errors PPt.pptxErrors PPt.pptx
Errors PPt.pptx
 
Advance Green Chemistry.ppt
Advance Green Chemistry.pptAdvance Green Chemistry.ppt
Advance Green Chemistry.ppt
 
analytical dose.pptx
analytical dose.pptxanalytical dose.pptx
analytical dose.pptx
 
Antibiotic Drug.ppt
Antibiotic Drug.pptAntibiotic Drug.ppt
Antibiotic Drug.ppt
 
Assay In Drug Analysis.ppt
Assay In Drug Analysis.pptAssay In Drug Analysis.ppt
Assay In Drug Analysis.ppt
 
bioassay.pptx
bioassay.pptxbioassay.pptx
bioassay.pptx
 
Biological Catalyst.pptx
Biological Catalyst.pptxBiological Catalyst.pptx
Biological Catalyst.pptx
 
Drug Discovery.pptx
Drug Discovery.pptxDrug Discovery.pptx
Drug Discovery.pptx
 
fda guidles.pptx
fda guidles.pptxfda guidles.pptx
fda guidles.pptx
 
Green Chemistry.ppt
Green Chemistry.pptGreen Chemistry.ppt
Green Chemistry.ppt
 
Introduction to Pharmaceuticak Industry.pptx
Introduction to Pharmaceuticak Industry.pptxIntroduction to Pharmaceuticak Industry.pptx
Introduction to Pharmaceuticak Industry.pptx
 
Mevolonic Acid.pptx
Mevolonic Acid.pptxMevolonic Acid.pptx
Mevolonic Acid.pptx
 
Neighbouring Group Participation.pptx
Neighbouring Group Participation.pptxNeighbouring Group Participation.pptx
Neighbouring Group Participation.pptx
 
solid support.ppt
solid support.pptsolid support.ppt
solid support.ppt
 
Sonochemistry.pptx
Sonochemistry.pptxSonochemistry.pptx
Sonochemistry.pptx
 
Spectrophotometry.pptx
Spectrophotometry.pptxSpectrophotometry.pptx
Spectrophotometry.pptx
 
stability study.pptx
stability study.pptxstability study.pptx
stability study.pptx
 

Recently uploaded

The Roman Empire A Historical Colossus.pdf
The Roman Empire A Historical Colossus.pdfThe Roman Empire A Historical Colossus.pdf
The Roman Empire A Historical Colossus.pdf
kaushalkr1407
 
Students, digital devices and success - Andreas Schleicher - 27 May 2024..pptx
Students, digital devices and success - Andreas Schleicher - 27 May 2024..pptxStudents, digital devices and success - Andreas Schleicher - 27 May 2024..pptx
Students, digital devices and success - Andreas Schleicher - 27 May 2024..pptx
EduSkills OECD
 
aaaaaaaaaaaaaaaaaaaaaaaaaaaaaaaaaaaaaaaaaaaaaaaaaaaaaaa
aaaaaaaaaaaaaaaaaaaaaaaaaaaaaaaaaaaaaaaaaaaaaaaaaaaaaaaaaaaaaaaaaaaaaaaaaaaaaaaaaaaaaaaaaaaaaaaaaaaaaaaaaaaaaa
aaaaaaaaaaaaaaaaaaaaaaaaaaaaaaaaaaaaaaaaaaaaaaaaaaaaaaa
siemaillard
 
Additional Benefits for Employee Website.pdf
Additional Benefits for Employee Website.pdfAdditional Benefits for Employee Website.pdf
Additional Benefits for Employee Website.pdf
joachimlavalley1
 
Home assignment II on Spectroscopy 2024 Answers.pdf
Home assignment II on Spectroscopy 2024 Answers.pdfHome assignment II on Spectroscopy 2024 Answers.pdf
Home assignment II on Spectroscopy 2024 Answers.pdf
Tamralipta Mahavidyalaya
 
How to Make a Field invisible in Odoo 17
How to Make a Field invisible in Odoo 17How to Make a Field invisible in Odoo 17
How to Make a Field invisible in Odoo 17
Celine George
 
The Art Pastor's Guide to Sabbath | Steve Thomason
The Art Pastor's Guide to Sabbath | Steve ThomasonThe Art Pastor's Guide to Sabbath | Steve Thomason
The Art Pastor's Guide to Sabbath | Steve Thomason
Steve Thomason
 
How to Create Map Views in the Odoo 17 ERP
How to Create Map Views in the Odoo 17 ERPHow to Create Map Views in the Odoo 17 ERP
How to Create Map Views in the Odoo 17 ERP
Celine George
 
Overview on Edible Vaccine: Pros & Cons with Mechanism
Overview on Edible Vaccine: Pros & Cons with MechanismOverview on Edible Vaccine: Pros & Cons with Mechanism
Overview on Edible Vaccine: Pros & Cons with Mechanism
DeeptiGupta154
 
Thesis Statement for students diagnonsed withADHD.ppt
Thesis Statement for students diagnonsed withADHD.pptThesis Statement for students diagnonsed withADHD.ppt
Thesis Statement for students diagnonsed withADHD.ppt
EverAndrsGuerraGuerr
 
Fish and Chips - have they had their chips
Fish and Chips - have they had their chipsFish and Chips - have they had their chips
Fish and Chips - have they had their chips
GeoBlogs
 
ESC Beyond Borders _From EU to You_ InfoPack general.pdf
ESC Beyond Borders _From EU to You_ InfoPack general.pdfESC Beyond Borders _From EU to You_ InfoPack general.pdf
ESC Beyond Borders _From EU to You_ InfoPack general.pdf
Fundacja Rozwoju Społeczeństwa Przedsiębiorczego
 
Palestine last event orientationfvgnh .pptx
Palestine last event orientationfvgnh .pptxPalestine last event orientationfvgnh .pptx
Palestine last event orientationfvgnh .pptx
RaedMohamed3
 
Unit 2- Research Aptitude (UGC NET Paper I).pdf
Unit 2- Research Aptitude (UGC NET Paper I).pdfUnit 2- Research Aptitude (UGC NET Paper I).pdf
Unit 2- Research Aptitude (UGC NET Paper I).pdf
Thiyagu K
 
Instructions for Submissions thorugh G- Classroom.pptx
Instructions for Submissions thorugh G- Classroom.pptxInstructions for Submissions thorugh G- Classroom.pptx
Instructions for Submissions thorugh G- Classroom.pptx
Jheel Barad
 
CLASS 11 CBSE B.St Project AIDS TO TRADE - INSURANCE
CLASS 11 CBSE B.St Project AIDS TO TRADE - INSURANCECLASS 11 CBSE B.St Project AIDS TO TRADE - INSURANCE
CLASS 11 CBSE B.St Project AIDS TO TRADE - INSURANCE
BhavyaRajput3
 
Model Attribute Check Company Auto Property
Model Attribute  Check Company Auto PropertyModel Attribute  Check Company Auto Property
Model Attribute Check Company Auto Property
Celine George
 
The approach at University of Liverpool.pptx
The approach at University of Liverpool.pptxThe approach at University of Liverpool.pptx
The approach at University of Liverpool.pptx
Jisc
 
How to Break the cycle of negative Thoughts
How to Break the cycle of negative ThoughtsHow to Break the cycle of negative Thoughts
How to Break the cycle of negative Thoughts
Col Mukteshwar Prasad
 
MARUTI SUZUKI- A Successful Joint Venture in India.pptx
MARUTI SUZUKI- A Successful Joint Venture in India.pptxMARUTI SUZUKI- A Successful Joint Venture in India.pptx
MARUTI SUZUKI- A Successful Joint Venture in India.pptx
bennyroshan06
 

Recently uploaded (20)

The Roman Empire A Historical Colossus.pdf
The Roman Empire A Historical Colossus.pdfThe Roman Empire A Historical Colossus.pdf
The Roman Empire A Historical Colossus.pdf
 
Students, digital devices and success - Andreas Schleicher - 27 May 2024..pptx
Students, digital devices and success - Andreas Schleicher - 27 May 2024..pptxStudents, digital devices and success - Andreas Schleicher - 27 May 2024..pptx
Students, digital devices and success - Andreas Schleicher - 27 May 2024..pptx
 
aaaaaaaaaaaaaaaaaaaaaaaaaaaaaaaaaaaaaaaaaaaaaaaaaaaaaaa
aaaaaaaaaaaaaaaaaaaaaaaaaaaaaaaaaaaaaaaaaaaaaaaaaaaaaaaaaaaaaaaaaaaaaaaaaaaaaaaaaaaaaaaaaaaaaaaaaaaaaaaaaaaaaa
aaaaaaaaaaaaaaaaaaaaaaaaaaaaaaaaaaaaaaaaaaaaaaaaaaaaaaa
 
Additional Benefits for Employee Website.pdf
Additional Benefits for Employee Website.pdfAdditional Benefits for Employee Website.pdf
Additional Benefits for Employee Website.pdf
 
Home assignment II on Spectroscopy 2024 Answers.pdf
Home assignment II on Spectroscopy 2024 Answers.pdfHome assignment II on Spectroscopy 2024 Answers.pdf
Home assignment II on Spectroscopy 2024 Answers.pdf
 
How to Make a Field invisible in Odoo 17
How to Make a Field invisible in Odoo 17How to Make a Field invisible in Odoo 17
How to Make a Field invisible in Odoo 17
 
The Art Pastor's Guide to Sabbath | Steve Thomason
The Art Pastor's Guide to Sabbath | Steve ThomasonThe Art Pastor's Guide to Sabbath | Steve Thomason
The Art Pastor's Guide to Sabbath | Steve Thomason
 
How to Create Map Views in the Odoo 17 ERP
How to Create Map Views in the Odoo 17 ERPHow to Create Map Views in the Odoo 17 ERP
How to Create Map Views in the Odoo 17 ERP
 
Overview on Edible Vaccine: Pros & Cons with Mechanism
Overview on Edible Vaccine: Pros & Cons with MechanismOverview on Edible Vaccine: Pros & Cons with Mechanism
Overview on Edible Vaccine: Pros & Cons with Mechanism
 
Thesis Statement for students diagnonsed withADHD.ppt
Thesis Statement for students diagnonsed withADHD.pptThesis Statement for students diagnonsed withADHD.ppt
Thesis Statement for students diagnonsed withADHD.ppt
 
Fish and Chips - have they had their chips
Fish and Chips - have they had their chipsFish and Chips - have they had their chips
Fish and Chips - have they had their chips
 
ESC Beyond Borders _From EU to You_ InfoPack general.pdf
ESC Beyond Borders _From EU to You_ InfoPack general.pdfESC Beyond Borders _From EU to You_ InfoPack general.pdf
ESC Beyond Borders _From EU to You_ InfoPack general.pdf
 
Palestine last event orientationfvgnh .pptx
Palestine last event orientationfvgnh .pptxPalestine last event orientationfvgnh .pptx
Palestine last event orientationfvgnh .pptx
 
Unit 2- Research Aptitude (UGC NET Paper I).pdf
Unit 2- Research Aptitude (UGC NET Paper I).pdfUnit 2- Research Aptitude (UGC NET Paper I).pdf
Unit 2- Research Aptitude (UGC NET Paper I).pdf
 
Instructions for Submissions thorugh G- Classroom.pptx
Instructions for Submissions thorugh G- Classroom.pptxInstructions for Submissions thorugh G- Classroom.pptx
Instructions for Submissions thorugh G- Classroom.pptx
 
CLASS 11 CBSE B.St Project AIDS TO TRADE - INSURANCE
CLASS 11 CBSE B.St Project AIDS TO TRADE - INSURANCECLASS 11 CBSE B.St Project AIDS TO TRADE - INSURANCE
CLASS 11 CBSE B.St Project AIDS TO TRADE - INSURANCE
 
Model Attribute Check Company Auto Property
Model Attribute  Check Company Auto PropertyModel Attribute  Check Company Auto Property
Model Attribute Check Company Auto Property
 
The approach at University of Liverpool.pptx
The approach at University of Liverpool.pptxThe approach at University of Liverpool.pptx
The approach at University of Liverpool.pptx
 
How to Break the cycle of negative Thoughts
How to Break the cycle of negative ThoughtsHow to Break the cycle of negative Thoughts
How to Break the cycle of negative Thoughts
 
MARUTI SUZUKI- A Successful Joint Venture in India.pptx
MARUTI SUZUKI- A Successful Joint Venture in India.pptxMARUTI SUZUKI- A Successful Joint Venture in India.pptx
MARUTI SUZUKI- A Successful Joint Venture in India.pptx
 

Factors affecting uv visible spectroscopy

  • 1. FACTOR AFFECTING UV-VIS ABSORPTION M A D E B Y:Dr.G.C.Wadhawa Assistant Professor Department of Chemistry Karmaveer Bhaurao Patil College ,Vashi, Navimumbai Date 25/03/2020
  • 2. EFFECT OF SAMPLE TEMPERATURE  The effect of temperature is less pronounced.  However, simple thermal expansion of the solution may be sufficient to change band intensity.  Therefore to get more accurate results the spectrum needs to taken at a specified or constant temperature.  The following three criteria may be given as general effect of temperature on solution spectra.
  • 3.  1. Band sharpness increases with decreasing temperature.  2. Position of absorption maximum does not move or moves very little towards the longer wavelength side, with decreasing temperature.  3. The total absorption intensity is approximately independent of the temperature.
  • 4. Temperature Effect on the UV Spectra
  • 5.  We know that the vibrational and rotational states depend on the temperature. As the temperature is decreased, vibrational and rotational energy states of the molecules are also lowered. When, the absorption of light occurs at lower temperature smaller distribution of excited states results, which produces fine absorption bands than that of at high temperature (figure ). It is also seen that positions of the band maxima do not shift very much with decreasing temperature but tend to move a very little towards the longer wavelength.
  • 6. EFFECT OF SAMPLE CONCENTRATION 1) According to Lambert-Beer law it might be expected that the sample concentration is directly proportional to the intensity of the absorption. 2) But at high concentrations, molecular interactions can take place causing changes to the position and shape of absorption bands. Such effects need to be identified and taken into consideration for quantitative work. 3) The solvent used also affects the fineness of absorption band in UV-spectrum. It has been observed that polar solvents give rise to broad bands, non-polar solvents show more resolution, while completely removing the solvent gives the best resolution. This is due to solvent-solute interaction.
  • 7. 4) If the dielectric constant of the solvent is high, there will be stronger solute-solvent nteraction. For example, a polar solvent like water or ethanol has the ability of hydrogen bonding with the solute if the solute has a hydrogen bonding component, or simply through induced dipole- dipole interactions. 5) The non-polar solvents can also interact though polarizability via London interactions but the effect is very less. Depending on the interaction, this can cause the round state and the excited state of the solute to increase or decrease, thus changing the frequency of the absorbed photon. Due to this, there are many different transition energies that overlap in the spectra and cause the broadening of UV- band.
  • 8. EFFECT OF SAMPLE PH 1) The pH of the sample solution can also have a significant effect on absorption spectra. 2) The absorption spectra of certain aromatic compounds such as phenols and anilines change on changing the pH of the solution.
  • 9. EFFECT OF SAMPLE PH 3) Phenols and substituted phenols are acidic and display sudden changes in their absorptions maxima upon the addition of a base. 4) After the removal of the phenolic proton, we get phenoxide ion.In the phenoxide ion lone pairs on the oxygen is delocalized over the π- sytem of the aromatic ring and increases the conjugation of the same. Extended conjugation leads to a decrease in the energy difference between the HOMO and LUMO orbitals, which results in red or bathochromic shift (to longer wavelength), along with an increase in the intensity of the absorption.
  • 10. EFFECT OF SAMPLE PH  Similarly, an aromatic amine gets protonated in an acidic medium which disturb the conjugation between the lone pair on nitrogen atom and the aromatic π-system. As a result, blue shift or hypsochromic shift (to shorter wavelength) is observed along with a decrease in intensity
  • 11. 1) The acid-base indicators (pH indicators) have their application due to their absorptions in the visible region of the UV-Vis spectrum. 2) A small change in the chemical structure of the indicator molecule can cause a change in the chromophore, which absorb at different λmax value in visible spectrum resulting in significant colour change at different pH One such example is phenolphthalein. Phenolphthalein is a weak acid which dissociates in water to give the anion, which results in extension of the negative charge of oxygen atom and leads to a substantial bathochromic shift (to longer wavelength). Thus the anion of phenolphthalein is orange coloured while its non-ionized form is colorless. 3) At acidic and neutral pH, the equilibrium shifts to the left and the concentration of the anions is too low to observe the pink colour. 4) However, under basic conditions, the equilibrium shifts to the right and the concentration of anion increase and we observe the pink colour.
  • 12. Therefore, UV-Vis spectra of such compounds should be recorded in a suitable buffer solution to maintain the pH at a constant value. The buffer though needs to be transparent over the wavelength range of the measurements. If the buffer absorbs radiation, absorbance readings may be higher than the actual value.
  • 13. EFFECT OF SOLVENT 1) The absorption spectrum depends on the solvent in which the absorbing substance is dissolved. 2) The choice of solvent can shift peaks to shorter or longer wavelengths. This depends on the nature of the interaction of the particular solvent with the environment of the chromophore in the molecule under study.
  • 14. 1) It is usually observed that ethanol solutions give absorption maxima at longer wavelength than hexane solutions. 2) Water and alcohols can form hydrogen bonds which results the shifting of the bands of polar substances. Since polarities of the ground and excited state of a chromophore are different, hence a change in the solvent polarity will stabilize the ground and excited states to different extent causing change in the energy gap between these electronic states. 3) Highly pure,non-polar solvents such as saturated hydrocarbons do not interact with solute molecules either in the ground or excited state and the absorption spectrum of a compound in these solvents is similar to the one in a pure gaseous state. However, polar solvents such as water, alcohols etc may stabilize or destabilize the molecular orbitals of a molecule either in the ground state or in excited state. 4) Therefore, the spectrum of a compound in these solvents may significantly vary from the one recorded in a hydrocarbon solvent.
  • 15. Π TO Π* TRANSITIONS  In case of π to π* transitions, the excited states are more polar than the ground state. If a polar solvent is used the dipole–dipole interaction reduces the energy of the excited state more than the ground state. Thus a polar solvent decreases the energy of π to π* transition and hence the absorption in a polar solvent such as ethanol will be at a longer wavelength (red shift) than in a non-polar solvent such as hexane.
  • 16. N TO Π* TRANSITIONS In case of n to π* transitions, the polar solvents form hydrogen bonds with the ground state of polar molecules more readily than with their excited states. Consequently the energy of ground state is decreased which further causes the increase in energy difference between the ground and excited energy levels. Therefore, absorption maxima resulting from n to π* transitions are shifted to shorter wavelengths (blue shift) with increasing solvent polarity.
  • 17. EFFECT OF STERIC HINDRANCE 1) The UV-spectroscopy is very sensitive to the distortion of the chromophores. 2) We know that the position of absorption maximum and its intensity depend on the length and effectiveness of the conjugative system. 3) Electronic conjugation works best when the molecule is planar in configuration. 4) If the presence of an auxochrome prevents the molecule from being planar then it may lead to the red or blue shifts depending upon the nature of distortion. 5) For example, the diene I shown below is expected to show absorption maximum at 237 nm (linear 1,3-diene), but distortion of chromophore causes it to absorb at 220 nm. This blue shift is due to the loss of conjugation as the structure is not planar.
  • 18. EFFECT OF STERIC HINDRANCE 6) Similar trends can also be observed in compounds where geometrical isomerism is possible. It is found that generally the trans-isomers show λmax at a longer wavelength and Ɛmax (molarabsorptivity or molar extinction coefficient) is higher than for the cis or mixed isomer. For example the trans- stilbene (II) absorbs at longer wavelength with greater intensity (λmax = 295 nm, Ɛ = 27000) than the cis-stilbene (III, λmax = 280 nm, Ɛ = 13500) due to steric effects. It is due to the more effective π-π orbital overlapping in the trans-stilbene, which results in achieving coplanarity of π-system more readily than in cis-stilbene. In cis-isomer, due to crowding (bulkygroups on the same side of the double bond), planar geometry is distorted.
  • 19.  Another example of such cases are biphenyl and its 2-methyl and 2,2’- dimethyl analogues. Biphenyl system is not completely planar (two ring being at an angle of 450) and in 2-methyl biphenyl the two rings are pushed even further out of co-planarity resulting in the diminished π orbital overlap. As a result, blue shift is observed with less intensity. The biphenyl (IV) has λmax at 250 nm (Ɛ = 19000) and 2-methylbiphenyl (V) has λmax at 237 nm (Ɛ = 10250).
  • 20. EFFECTS OF CONJUGATION  When two or more chromophores are conjugated the absorption maxima is shifted to a larger wavelength or shorter frequency.  Conjugation increases the energy of the HOMO and decreases the energy of LUMO. As a result less energy is required for an electronic transition in a conjugated system than in a non-conjugated system
  • 21.  Below figure shows that as the number of conjugated double bonds increases, the value of λmax also increases.  The more conjugated double bonds there are in a compound, the less energy is required for the electronic transition, and therefore the longer is the wavelength at which the electronic transition occurs.  It is noteworthy that conjugation of two chromophores not only increases the λ but also increases the intensity (molar absorptivity). This effect of conjugation can be shown by the spectra of the polyenes CH3-(CH=CH)n- CH3, where n = 3, 4 and 5.
  • 22.  In case of simple alkene (ethylene) we have only two molecular orbitals, one is ground state π bonding orbital and the other is excited state π* antibonding orbital. The energy gap between these two is 176 kcal/mol.  But in case of conjugated dienes, the π molecular orbitals of the two separate C=C groups combine to form two new bonding molecular orbitals designated as ψ1 and ψ2, and two new anti-bonding molecular orbitals designated as ψ3* and ψ4* . It is clear that the transition of lowest energy π to π* transition in conjugated system is ψ2 (HOMO) to ψ4* (LUMO). Hence we can say that the conjugated dienes absorb at relatively longer wavelength than do isolated alkenes.
  • 23.  As the number of conjugated double bonds is increased, the gap between highest occupied molecular orbital (HOMO) and lowest unoccupied molecular orbital (LUMO) is progressively lowered. Therefore, the increase in size of the conjugated system gradually shifts the absorption maxima (λmax) to longer wavelength.  If a compound has enough conjugated double bonds, it will absorb visible light and the compoundwill be colored. The β-carotene, a precursor of vitamin A, has eleven conjugated double bonds and its absorption maximum gets shifted from ultraviolet to the blue region of the visible spectrum giving it an orange colour.
  • 24.  In a similar fashion, methyl group also produce bathochromic shift. Although methyl group do not have π electron or unshared electrons, it is considered to interact with the π system through itC-H bonding orbitals (hyperconjugation or sigma bond resonance). Similarly in case of other conjugated chromophores (conjugation with a hetero atom), the energy difference between HOMO and LUMO is lowered resulting in bathochromic shift.
  • 25. 1) As discussed above, carbonyl compounds show both π to π* (intense and shorter wavelength) and n to π* (less intense and longer wavelength) transitions. 2)The introduction of polar substituent on the α-carbon of an aliphatic carbonyl do not affect the n to π* transition. But in the case of cyclic ketones, a bathochromic effect is observed. However, this effect is more when the auxochrome is at axial position (10-30 nm) than that when it is present at equatorial position (4-10 nm).3) Substitution on the carbonyl carbon by an auxochrome with a lone pair of electrons such asamide, acids, esters, acid chloride etc cause the increase in the energy of π* orbital, leaving the norbital unaffected. As a result, n to π* transition is shifted to shorter wavelength (hypsochromiceffect).
  • 26.  However, a little bathochromic effect is observed on the transition π to π*. Such bathochromic effects are caused by the resonance interaction between the C=O and lone pair on the other hetero atom.  4) If the carbonyl group is conjugated with a C-C double bond i.e. α,β- unsaturated carbonyl compounds, both π to π* and n to π* transitions shift to at longer wavelength compared to the unconjugated carbonyl compounds. However the energy of the n to π* transition does not decrease as rapidly as that of the π to π* band. If the conjugated chain becomes long enough, the n to π* band is buried into the more intense π to π* band system. shows the molecular orbitals of α,β-unsaturated carbonyl system along with the isolated C=C bond and carbonyl group