Downloaded 30 times

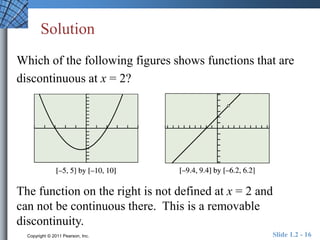
![Solution
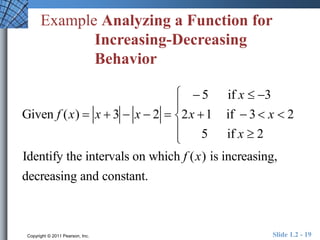
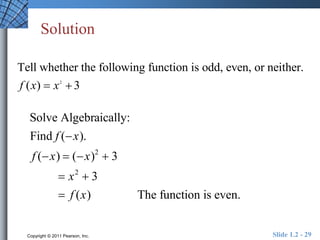
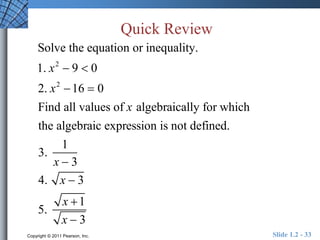
Given f (x) x 3 x 2
Identify the intervals on which f (x) is increasing,
decreasing and constant.
The graph suggests, f (x)
is constant on ( , 3]
and 2,.
On the interval [ 3,2] f (x)
appears to be increasing.
5 if x 3
2x 1 if 3 x 2
5 if x 2
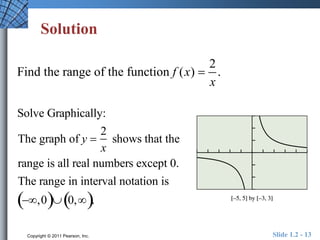
Copyright © 2011 Pearson, Inc. Slide 1.2 - 20](https://image.slidesharecdn.com/unit1-140908125553-phpapp02/85/Unit-1-2-20-320.jpg)
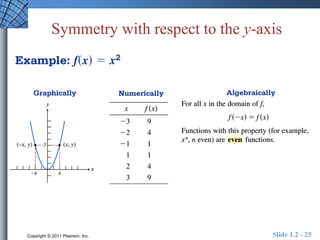

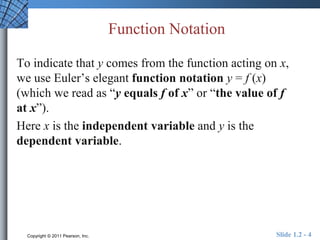
This document provides an overview of key concepts related to functions and their properties. It discusses function definition and notation, domain and range, continuity, increasing and decreasing functions, boundedness, local and absolute extrema, symmetry, asymptotes, and end behavior. Examples are provided to illustrate key concepts such as finding the domain and range of functions, identifying points of discontinuity, determining if a function is increasing or decreasing, and identifying local extrema. The document is intended to teach readers about important properties of functions.