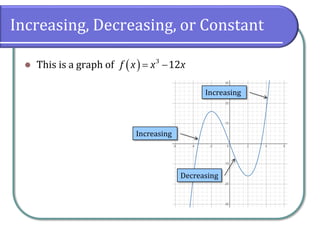
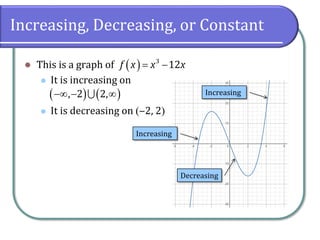
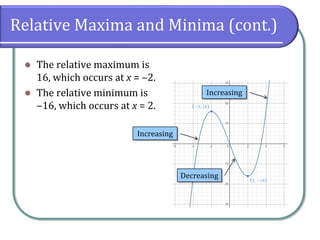
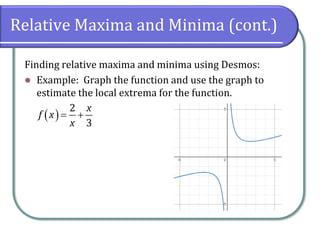
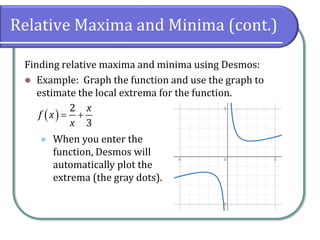
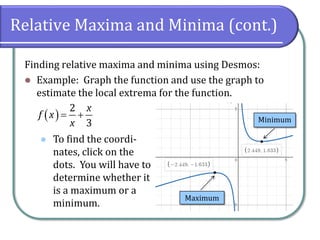
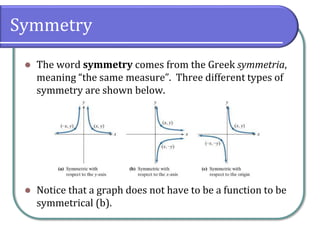
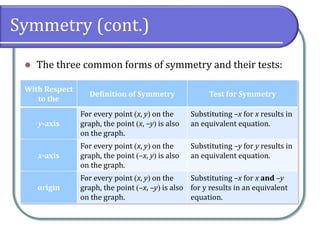
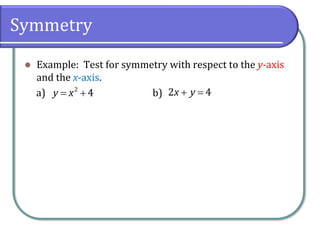
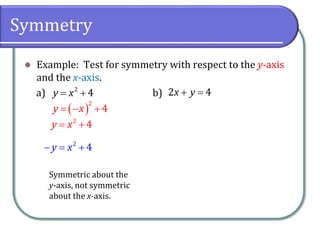
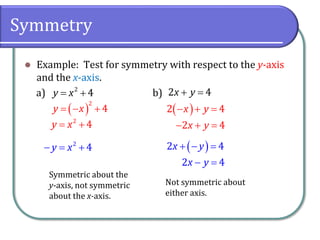
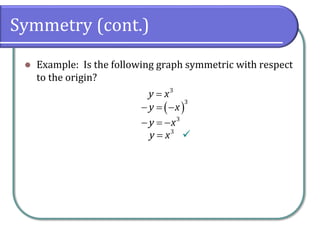
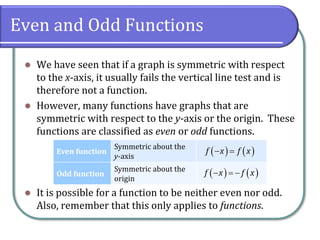
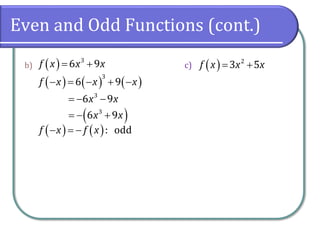
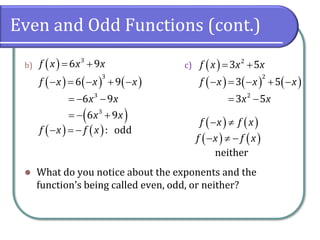
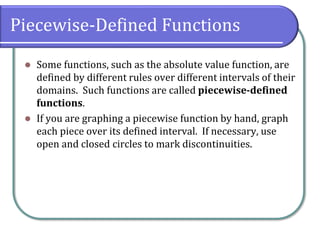
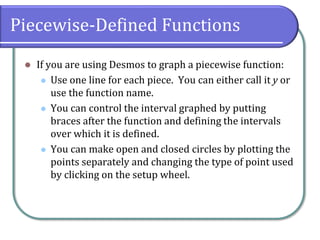
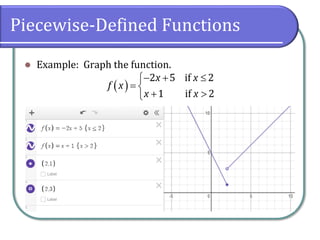
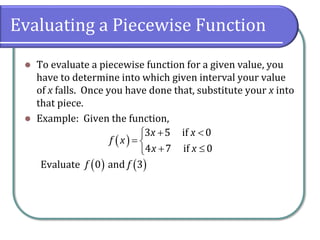
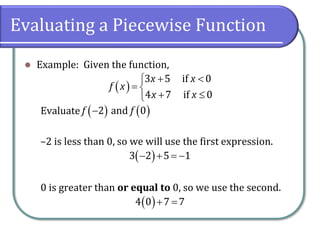
2.2 More on Functions and
Their Graphs
Chapter 2 Functions and Graphs
Concepts and Objectives
⚫ The objectives for this section are
⚫ Identify intervals on which a function increases,
decreases, or is constant
⚫ Use graphs to locate relative maxima or minima
⚫ Test for symmetry
⚫ Identify even or odd functions and recognize their
symmetries
⚫ Understand and use piecewise functions
Increasing, Decreasing, or Constant
⚫ We say that a function is increasing on an interval if the
function values increase as the input values increase
within that interval.
⚫ Similarly, a function is decreasing on an interval if the
function values decrease as the input values increase
over that interval.
⚫ If a function is neither increasing nor decreasing on an
interval (a horizontal line), then it is constant as the
input values do not change over that interval.
Increasing, Decreasing, or Constant
⚫ This is a graph of ( ) 3
12
f x x x
= −
Increasing
Increasing
Decreasing
Increasing, Decreasing, or Constant
⚫ This is a graph of
⚫ It is increasing on
⚫ It is decreasing on (‒2, 2)
( ) 3
12
f x x x
= −
Increasing
Increasing
Decreasing
( ) ( )
, 2 2,
− − 
Relative Maxima and Minima
⚫ A value of the input where a function changes from
increasing to decreasing (as the input variable
increases) is the location of a relative maximum.
⚫ If a function has more than one, we say it has relative
maxima.
⚫ Similarly, a value of the input where a function changes
from decreasing to increasing as the input variable
increases is the location of a relative minimum (plural
minima).
⚫ Sometimes the word local is used instead of relative.
Relative Maxima and Minima (cont.)
⚫ The relative maximum is
16, which occurs at x = ‒2.
⚫ The relative minimum is
‒16, which occurs at x = 2.
Increasing
Increasing
Decreasing
Relative Maxima and Minima (cont.)
Finding relative maxima and minima using Desmos:
⚫ Example: Graph the function and use the graph to
estimate the local extrema for the function.
( )
2
3
x
f x
x
= +
Relative Maxima and Minima (cont.)
Finding relative maxima and minima using Desmos:
⚫ Example: Graph the function and use the graph to
estimate the local extrema for the function.
⚫
( )
2
3
x
f x
x
= +
When you enter the
function, Desmos will
automatically plot the
extrema (the gray dots).
Relative Maxima and Minima (cont.)
Finding relative maxima and minima using Desmos:
⚫ Example: Graph the function and use the graph to
estimate the local extrema for the function.
⚫
( )
2
3
x
f x
x
= +
To find the coordi-
nates, click on the
dots. You will have to
determine whether it
is a maximum or a
minimum.
Minimum
Maximum
Symmetry
⚫ The word symmetry comes from the Greek symmetria,
meaning “the same measure”. Three different types of
symmetry are shown below.
⚫ Notice that a graph does not have to be a function to be
symmetrical (b).
Symmetry (cont.)
⚫ The three common forms of symmetry and their tests:
With Respect
to the
Definition of Symmetry Test for Symmetry
y-axis
For every point (x, y) on the
graph, the point (x, –y) is also
on the graph.
Substituting –x for x results in
an equivalent equation.
x-axis
For every point (x, y) on the
graph, the point (–x, y) is also
on the graph.
Substituting –y for y results in
an equivalent equation.
origin
For every point (x, y) on the
graph, the point (–x, –y) is also
on the graph.
Substituting –x for x and –y
for y results in an equivalent
equation.
Symmetry
⚫ Example: Test for symmetry with respect to the y-axis
and the x-axis.
a) b)
2
4
y x
= + 2 4
x y
+ =
Symmetry
⚫ Example: Test for symmetry with respect to the y-axis
and the x-axis.
a) b)
2
4
y x
= + 2 4
x y
+ =
( )
2
4
y x
= − +
2
4
y x
= +
2
4
y x
− = +
Symmetric about the
y-axis, not symmetric
about the x-axis.
Symmetry
⚫ Example: Test for symmetry with respect to the y-axis
and the x-axis.
a) b)
2
4
y x
= + 2 4
x y
+ =
( )
2
4
y x
= − +
2
4
y x
= +
2
4
y x
− = +
( )
2 4
x y
− + =
2 4
x y
− + =
( )
2 4
x y
+ − =
2 4
x y
− =
Symmetric about the
y-axis, not symmetric
about the x-axis.
Not symmetric about
either axis.
Symmetry (cont.)
⚫ Example: Is the following graph symmetric with respect
to the origin?
3
y x
=
( )
3
y x
− = −
3
y x
− = −
3
y x
=
Even and Odd Functions
⚫ We have seen that if a graph is symmetric with respect
to the x-axis, it usually fails the vertical line test and is
therefore not a function.
⚫ However, many functions have graphs that are
symmetric with respect to the y-axis or the origin. These
functions are classified as even or odd functions.
⚫ It is possible for a function to be neither even nor odd.
Also, remember that this only applies to functions.
Even function
Symmetric about the
y-axis
Odd function
Symmetric about the
origin
( ) ( )
f x f x
− =
( ) ( )
f x f x
− = −
Even and Odd Functions (cont.)
Example: Decide whether each function is even, odd, or
neither.
a) ( ) 4 2
8 3
f x x x
= −
Even and Odd Functions (cont.)
Example: Decide whether each function is even, odd, or
neither.
a) ( ) 4 2
8 3
f x x x
= −
( ) ( ) ( )
4 2
8 3
f x x x
− = − − −
4 2
8 3
x x
= − ( ) ( ): even
f x f x
− =
Even and Odd Functions (cont.)
b) c)
( ) 3
6 9
f x x x
= +
3
6 9
x x
= − −
( )
3
6 9
x x
= − +
( ) ( ): odd
f x f x
− = −
( ) 2
3 5
f x x x
= +
Even and Odd Functions (cont.)
b) c)
( ) 3
6 9
f x x x
= + ( ) 2
3 5
f x x x
= +
Even and Odd Functions (cont.)
b) c)
( ) 3
6 9
f x x x
= +
( ) ( ) ( )
3
6 9
f x x x
− = − + −
3
6 9
x x
= − −
( )
3
6 9
x x
= − +
( ) ( ): odd
f x f x
− = −
( ) 2
3 5
f x x x
= +
Even and Odd Functions (cont.)
b) c)
⚫ What do you notice about the exponents and the
function’s being called even, odd, or neither?
( ) 3
6 9
f x x x
= +
( ) ( ) ( )
3
6 9
f x x x
− = − + −
3
6 9
x x
= − −
( )
3
6 9
x x
= − +
( ) ( ): odd
f x f x
− = −
( ) 2
3 5
f x x x
= +
( ) ( ) ( )
2
3 5
f x x x
− = − + −
2
3 5
x x
= −
( ) ( )
f x f x
− 
( ) ( )
f x f x
−  −
neither
Piecewise-Defined Functions
⚫ Some functions, such as the absolute value function, are
defined by different rules over different intervals of their
domains. Such functions are called piecewise-defined
functions.
⚫ If you are graphing a piecewise function by hand, graph
each piece over its defined interval. If necessary, use
open and closed circles to mark discontinuities.
Piecewise-Defined Functions
⚫ If you are using Desmos to graph a piecewise function:
⚫ Use one line for each piece. You can either call it y or
use the function name.
⚫ You can control the interval graphed by putting
braces after the function and defining the intervals
over which it is defined.
⚫ You can make open and closed circles by plotting the
points separately and changing the type of point used
by clicking on the setup wheel.
Piecewise-Defined Functions
⚫ Example: Graph the function.
( )
2 5 if 2
1 if 2
x x
f x
x x
− + 

= 
+ 

Evaluating a Piecewise Function
⚫ To evaluate a piecewise function for a given value, you
have to determine into which given interval your value
of x falls. Once you have done that, substitute your x into
that piece.
⚫ Example: Given the function,
Evaluate
( )
3 5 if 0
4 7 if 0
x x
f x
x x
+ 

= 
+ 

( ) ( )
0 and 3
f f
Evaluating a Piecewise Function
⚫ Example: Given the function,
Evaluate
–2 is less than 0, so we will use the first expression.
0 is greater than or equal to 0, so we use the second.
( )
3 5 if 0
4 7 if 0
x x
f x
x x
+ 

= 
+ 

( ) ( )
2 and 0
f f
−
( )
3 2 5 1
− + = −
( )
4 0 7 7
+ =
For Next Class
⚫ Section 2.2 in MyMathLab
⚫ Quiz 2.2 in Canvas
⚫ Optional: Read section 2.5 in your textbook

2.2 More on Functions and Their Graphs

  • 1.
    2.2 More onFunctions and Their Graphs Chapter 2 Functions and Graphs
  • 2.
    Concepts and Objectives ⚫The objectives for this section are ⚫ Identify intervals on which a function increases, decreases, or is constant ⚫ Use graphs to locate relative maxima or minima ⚫ Test for symmetry ⚫ Identify even or odd functions and recognize their symmetries ⚫ Understand and use piecewise functions
  • 3.
    Increasing, Decreasing, orConstant ⚫ We say that a function is increasing on an interval if the function values increase as the input values increase within that interval. ⚫ Similarly, a function is decreasing on an interval if the function values decrease as the input values increase over that interval. ⚫ If a function is neither increasing nor decreasing on an interval (a horizontal line), then it is constant as the input values do not change over that interval.
  • 4.
    Increasing, Decreasing, orConstant ⚫ This is a graph of ( ) 3 12 f x x x = − Increasing Increasing Decreasing
  • 5.
    Increasing, Decreasing, orConstant ⚫ This is a graph of ⚫ It is increasing on ⚫ It is decreasing on (‒2, 2) ( ) 3 12 f x x x = − Increasing Increasing Decreasing ( ) ( ) , 2 2, − − 
  • 6.
    Relative Maxima andMinima ⚫ A value of the input where a function changes from increasing to decreasing (as the input variable increases) is the location of a relative maximum. ⚫ If a function has more than one, we say it has relative maxima. ⚫ Similarly, a value of the input where a function changes from decreasing to increasing as the input variable increases is the location of a relative minimum (plural minima). ⚫ Sometimes the word local is used instead of relative.
  • 7.
    Relative Maxima andMinima (cont.) ⚫ The relative maximum is 16, which occurs at x = ‒2. ⚫ The relative minimum is ‒16, which occurs at x = 2. Increasing Increasing Decreasing
  • 8.
    Relative Maxima andMinima (cont.) Finding relative maxima and minima using Desmos: ⚫ Example: Graph the function and use the graph to estimate the local extrema for the function. ( ) 2 3 x f x x = +
  • 9.
    Relative Maxima andMinima (cont.) Finding relative maxima and minima using Desmos: ⚫ Example: Graph the function and use the graph to estimate the local extrema for the function. ⚫ ( ) 2 3 x f x x = + When you enter the function, Desmos will automatically plot the extrema (the gray dots).
  • 10.
    Relative Maxima andMinima (cont.) Finding relative maxima and minima using Desmos: ⚫ Example: Graph the function and use the graph to estimate the local extrema for the function. ⚫ ( ) 2 3 x f x x = + To find the coordi- nates, click on the dots. You will have to determine whether it is a maximum or a minimum. Minimum Maximum
  • 11.
    Symmetry ⚫ The wordsymmetry comes from the Greek symmetria, meaning “the same measure”. Three different types of symmetry are shown below. ⚫ Notice that a graph does not have to be a function to be symmetrical (b).
  • 12.
    Symmetry (cont.) ⚫ Thethree common forms of symmetry and their tests: With Respect to the Definition of Symmetry Test for Symmetry y-axis For every point (x, y) on the graph, the point (x, –y) is also on the graph. Substituting –x for x results in an equivalent equation. x-axis For every point (x, y) on the graph, the point (–x, y) is also on the graph. Substituting –y for y results in an equivalent equation. origin For every point (x, y) on the graph, the point (–x, –y) is also on the graph. Substituting –x for x and –y for y results in an equivalent equation.
  • 13.
    Symmetry ⚫ Example: Testfor symmetry with respect to the y-axis and the x-axis. a) b) 2 4 y x = + 2 4 x y + =
  • 14.
    Symmetry ⚫ Example: Testfor symmetry with respect to the y-axis and the x-axis. a) b) 2 4 y x = + 2 4 x y + = ( ) 2 4 y x = − + 2 4 y x = + 2 4 y x − = + Symmetric about the y-axis, not symmetric about the x-axis.
  • 15.
    Symmetry ⚫ Example: Testfor symmetry with respect to the y-axis and the x-axis. a) b) 2 4 y x = + 2 4 x y + = ( ) 2 4 y x = − + 2 4 y x = + 2 4 y x − = + ( ) 2 4 x y − + = 2 4 x y − + = ( ) 2 4 x y + − = 2 4 x y − = Symmetric about the y-axis, not symmetric about the x-axis. Not symmetric about either axis.
  • 16.
    Symmetry (cont.) ⚫ Example:Is the following graph symmetric with respect to the origin? 3 y x = ( ) 3 y x − = − 3 y x − = − 3 y x =
  • 17.
    Even and OddFunctions ⚫ We have seen that if a graph is symmetric with respect to the x-axis, it usually fails the vertical line test and is therefore not a function. ⚫ However, many functions have graphs that are symmetric with respect to the y-axis or the origin. These functions are classified as even or odd functions. ⚫ It is possible for a function to be neither even nor odd. Also, remember that this only applies to functions. Even function Symmetric about the y-axis Odd function Symmetric about the origin ( ) ( ) f x f x − = ( ) ( ) f x f x − = −
  • 18.
    Even and OddFunctions (cont.) Example: Decide whether each function is even, odd, or neither. a) ( ) 4 2 8 3 f x x x = −
  • 19.
    Even and OddFunctions (cont.) Example: Decide whether each function is even, odd, or neither. a) ( ) 4 2 8 3 f x x x = − ( ) ( ) ( ) 4 2 8 3 f x x x − = − − − 4 2 8 3 x x = − ( ) ( ): even f x f x − =
  • 20.
    Even and OddFunctions (cont.) b) c) ( ) 3 6 9 f x x x = + 3 6 9 x x = − − ( ) 3 6 9 x x = − + ( ) ( ): odd f x f x − = − ( ) 2 3 5 f x x x = +
  • 21.
    Even and OddFunctions (cont.) b) c) ( ) 3 6 9 f x x x = + ( ) 2 3 5 f x x x = +
  • 22.
    Even and OddFunctions (cont.) b) c) ( ) 3 6 9 f x x x = + ( ) ( ) ( ) 3 6 9 f x x x − = − + − 3 6 9 x x = − − ( ) 3 6 9 x x = − + ( ) ( ): odd f x f x − = − ( ) 2 3 5 f x x x = +
  • 23.
    Even and OddFunctions (cont.) b) c) ⚫ What do you notice about the exponents and the function’s being called even, odd, or neither? ( ) 3 6 9 f x x x = + ( ) ( ) ( ) 3 6 9 f x x x − = − + − 3 6 9 x x = − − ( ) 3 6 9 x x = − + ( ) ( ): odd f x f x − = − ( ) 2 3 5 f x x x = + ( ) ( ) ( ) 2 3 5 f x x x − = − + − 2 3 5 x x = − ( ) ( ) f x f x −  ( ) ( ) f x f x −  − neither
  • 24.
    Piecewise-Defined Functions ⚫ Somefunctions, such as the absolute value function, are defined by different rules over different intervals of their domains. Such functions are called piecewise-defined functions. ⚫ If you are graphing a piecewise function by hand, graph each piece over its defined interval. If necessary, use open and closed circles to mark discontinuities.
  • 25.
    Piecewise-Defined Functions ⚫ Ifyou are using Desmos to graph a piecewise function: ⚫ Use one line for each piece. You can either call it y or use the function name. ⚫ You can control the interval graphed by putting braces after the function and defining the intervals over which it is defined. ⚫ You can make open and closed circles by plotting the points separately and changing the type of point used by clicking on the setup wheel.
  • 26.
    Piecewise-Defined Functions ⚫ Example:Graph the function. ( ) 2 5 if 2 1 if 2 x x f x x x − +   =  +  
  • 27.
    Evaluating a PiecewiseFunction ⚫ To evaluate a piecewise function for a given value, you have to determine into which given interval your value of x falls. Once you have done that, substitute your x into that piece. ⚫ Example: Given the function, Evaluate ( ) 3 5 if 0 4 7 if 0 x x f x x x +   =  +   ( ) ( ) 0 and 3 f f
  • 28.
    Evaluating a PiecewiseFunction ⚫ Example: Given the function, Evaluate –2 is less than 0, so we will use the first expression. 0 is greater than or equal to 0, so we use the second. ( ) 3 5 if 0 4 7 if 0 x x f x x x +   =  +   ( ) ( ) 2 and 0 f f − ( ) 3 2 5 1 − + = − ( ) 4 0 7 7 + =
  • 29.
    For Next Class ⚫Section 2.2 in MyMathLab ⚫ Quiz 2.2 in Canvas ⚫ Optional: Read section 2.5 in your textbook