Downloaded 236 times


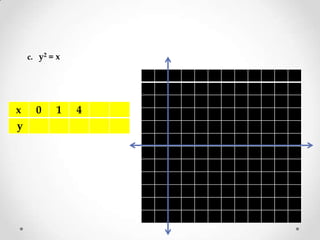


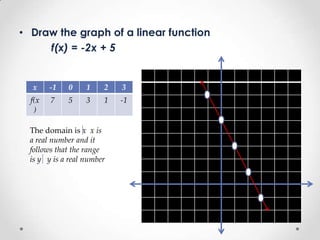


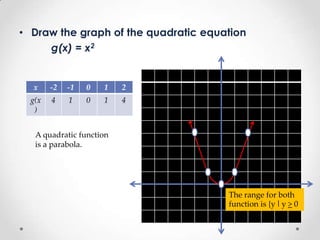


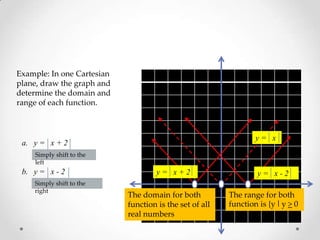
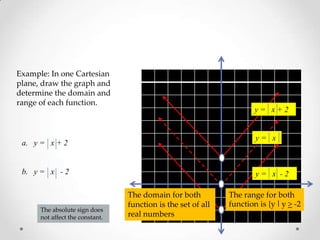

The document discusses different types of functions and their graphs. It provides examples of constant functions, linear functions, quadratic functions, and absolute value functions. It shows how to graph each type of function by plotting points and describes their domains and ranges. For linear functions, the domain is all real numbers and the range is also all real numbers. For quadratic functions, the graph is a parabola and the range only includes positive values. Absolute value functions have a domain of all real numbers and a range that is positive and excludes negative values below the constant.