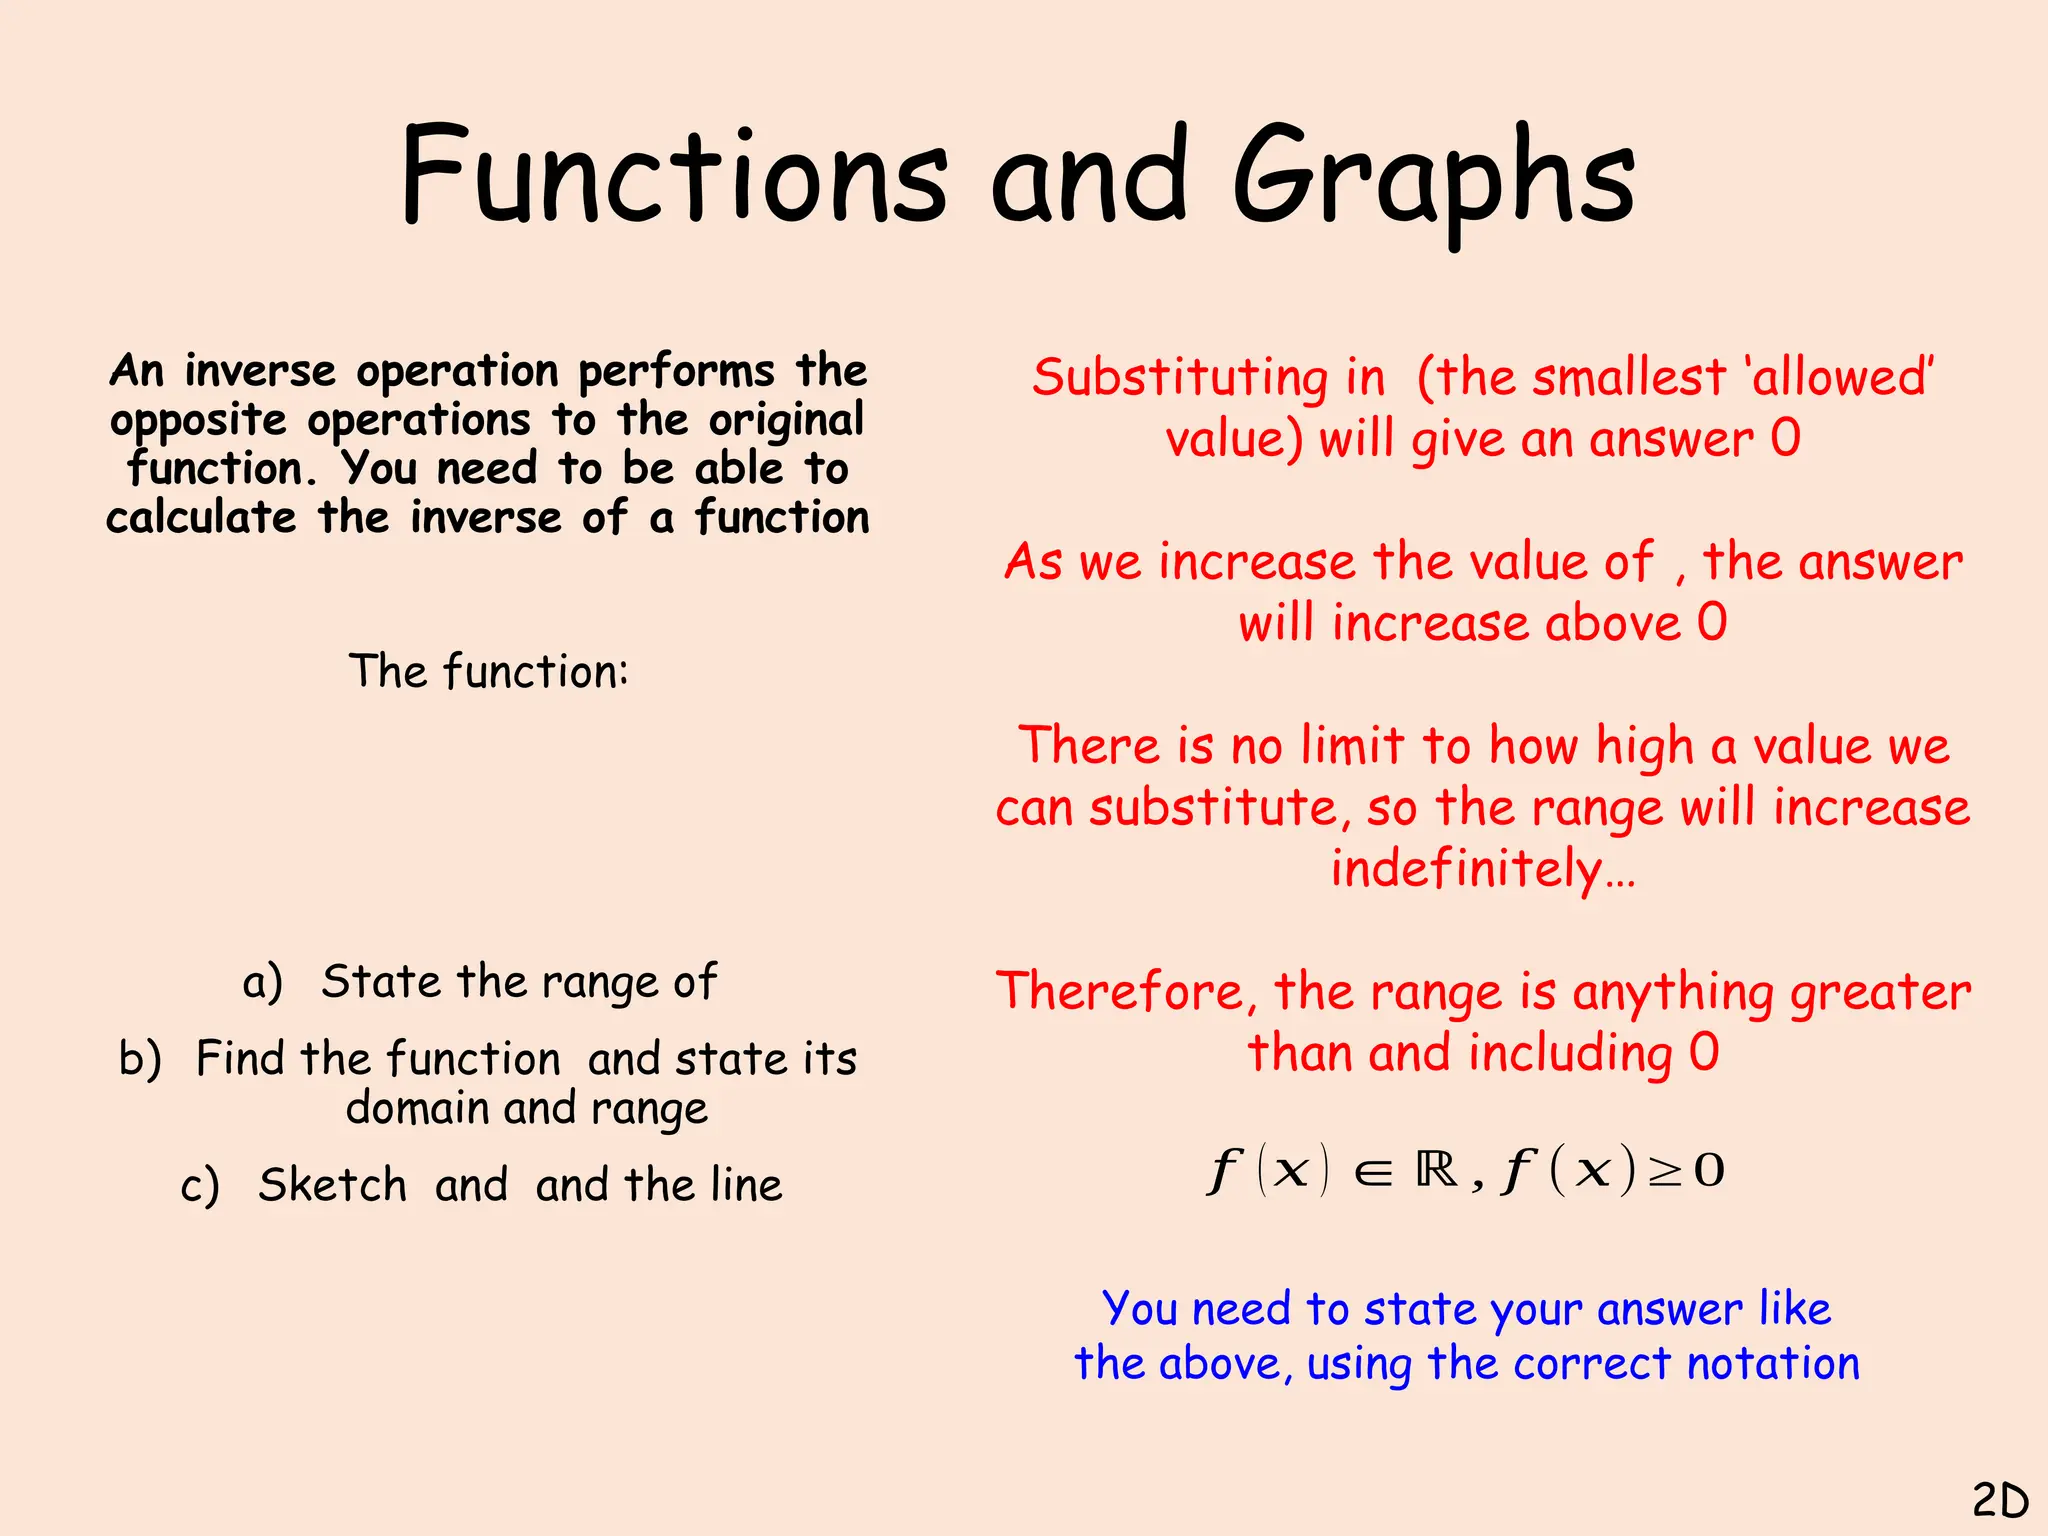
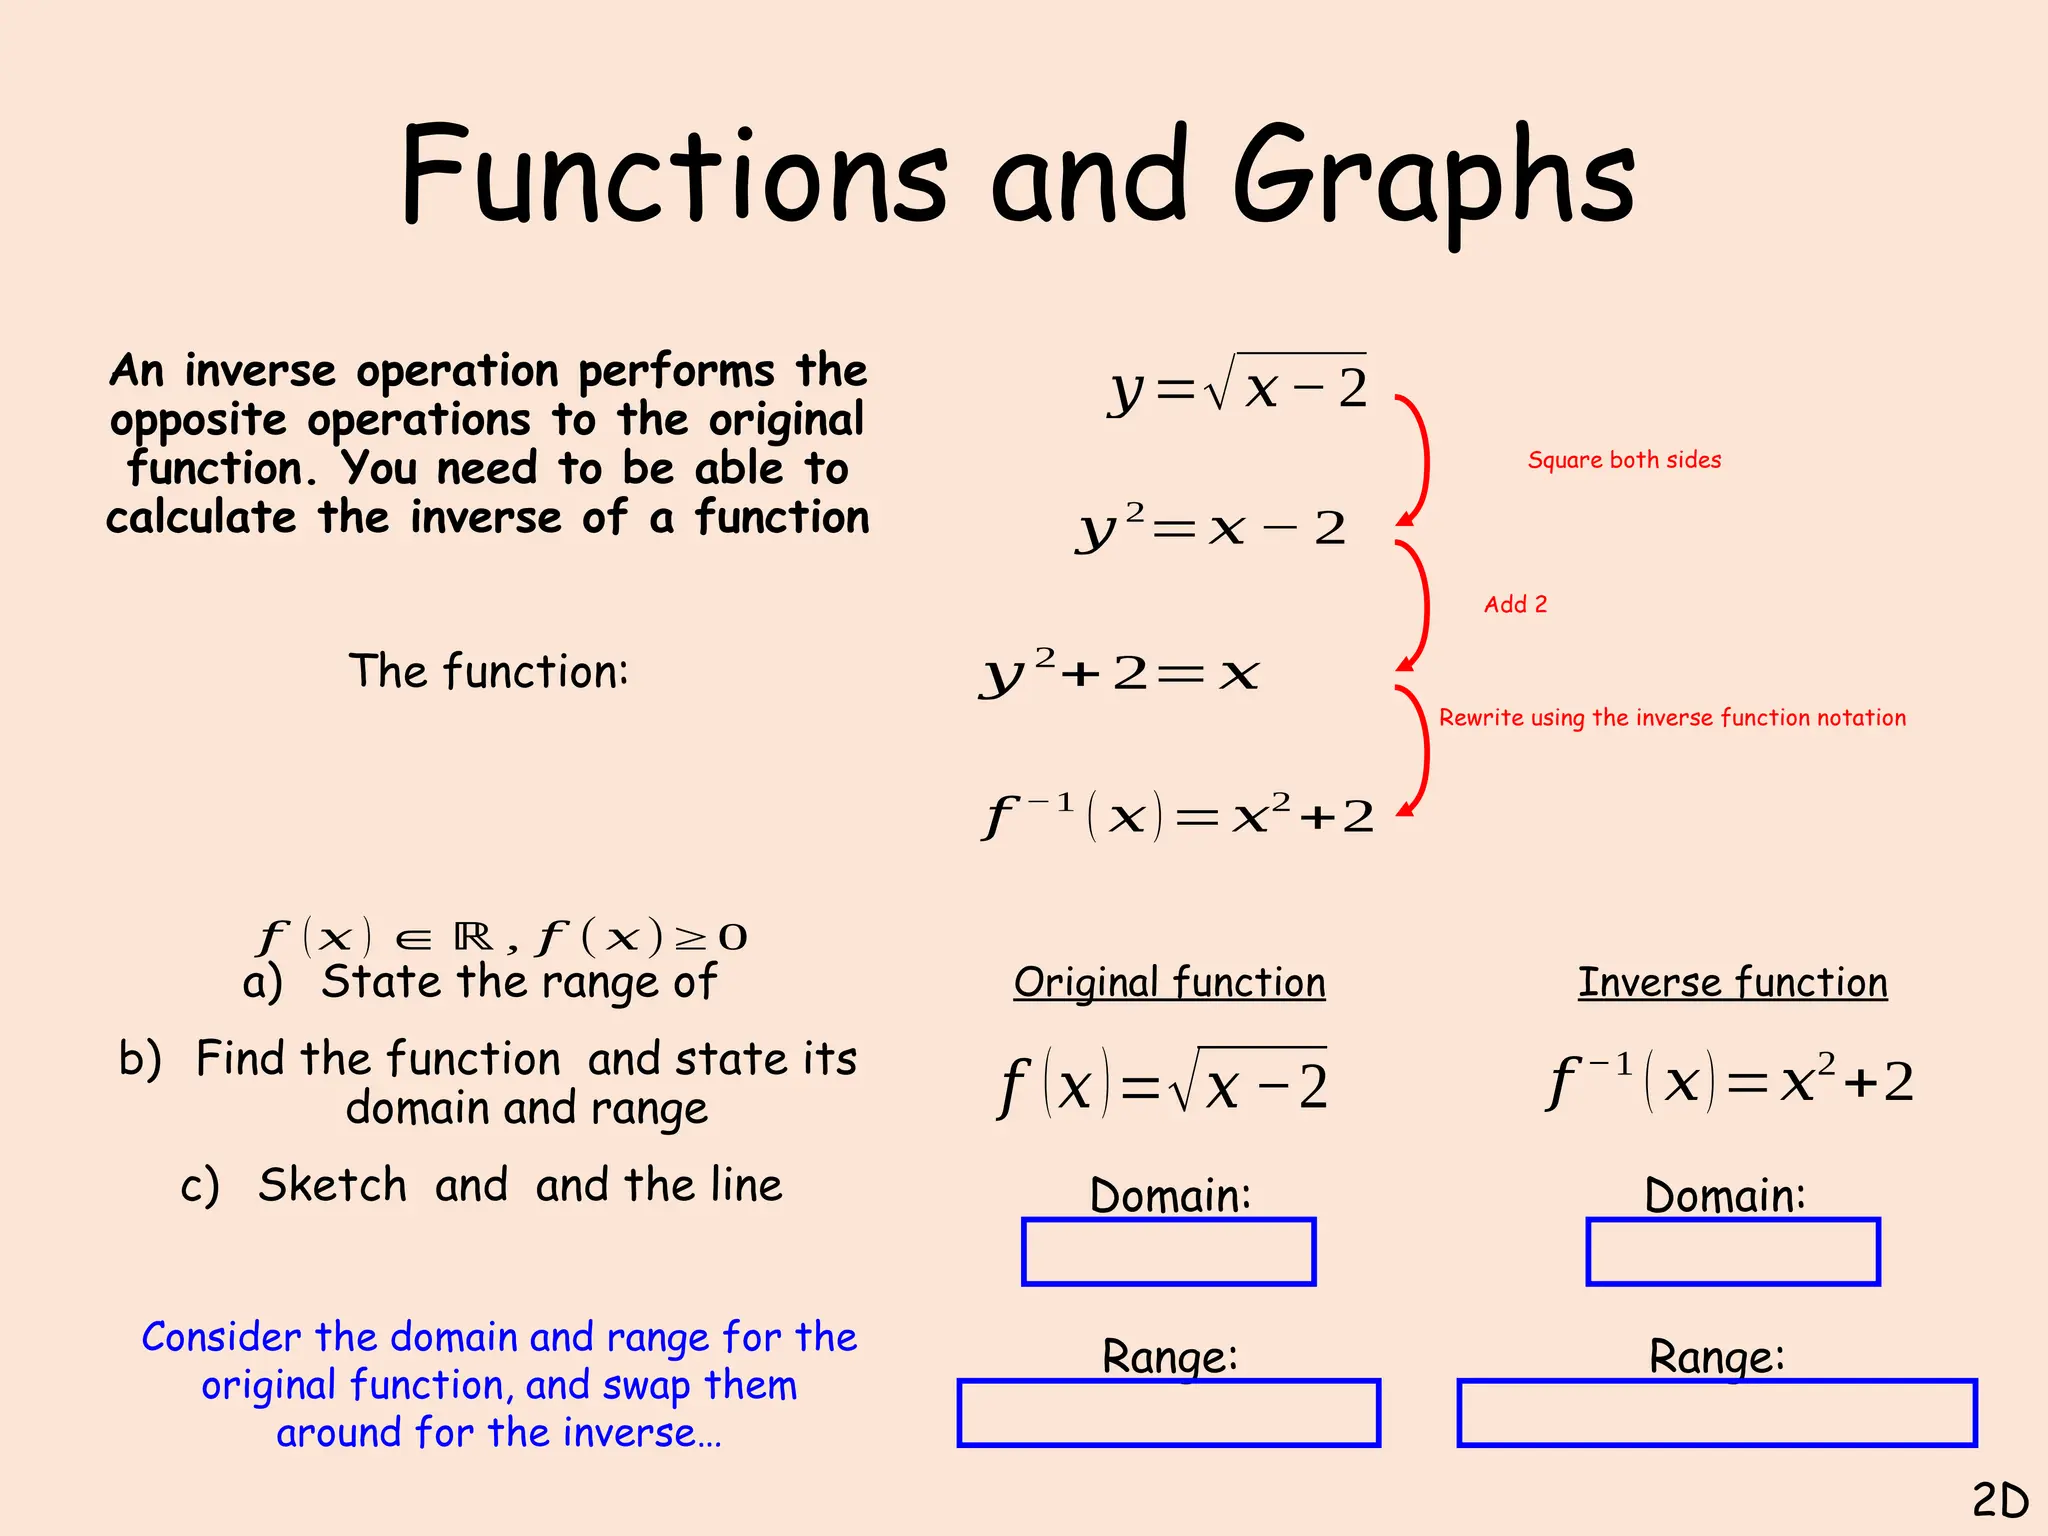
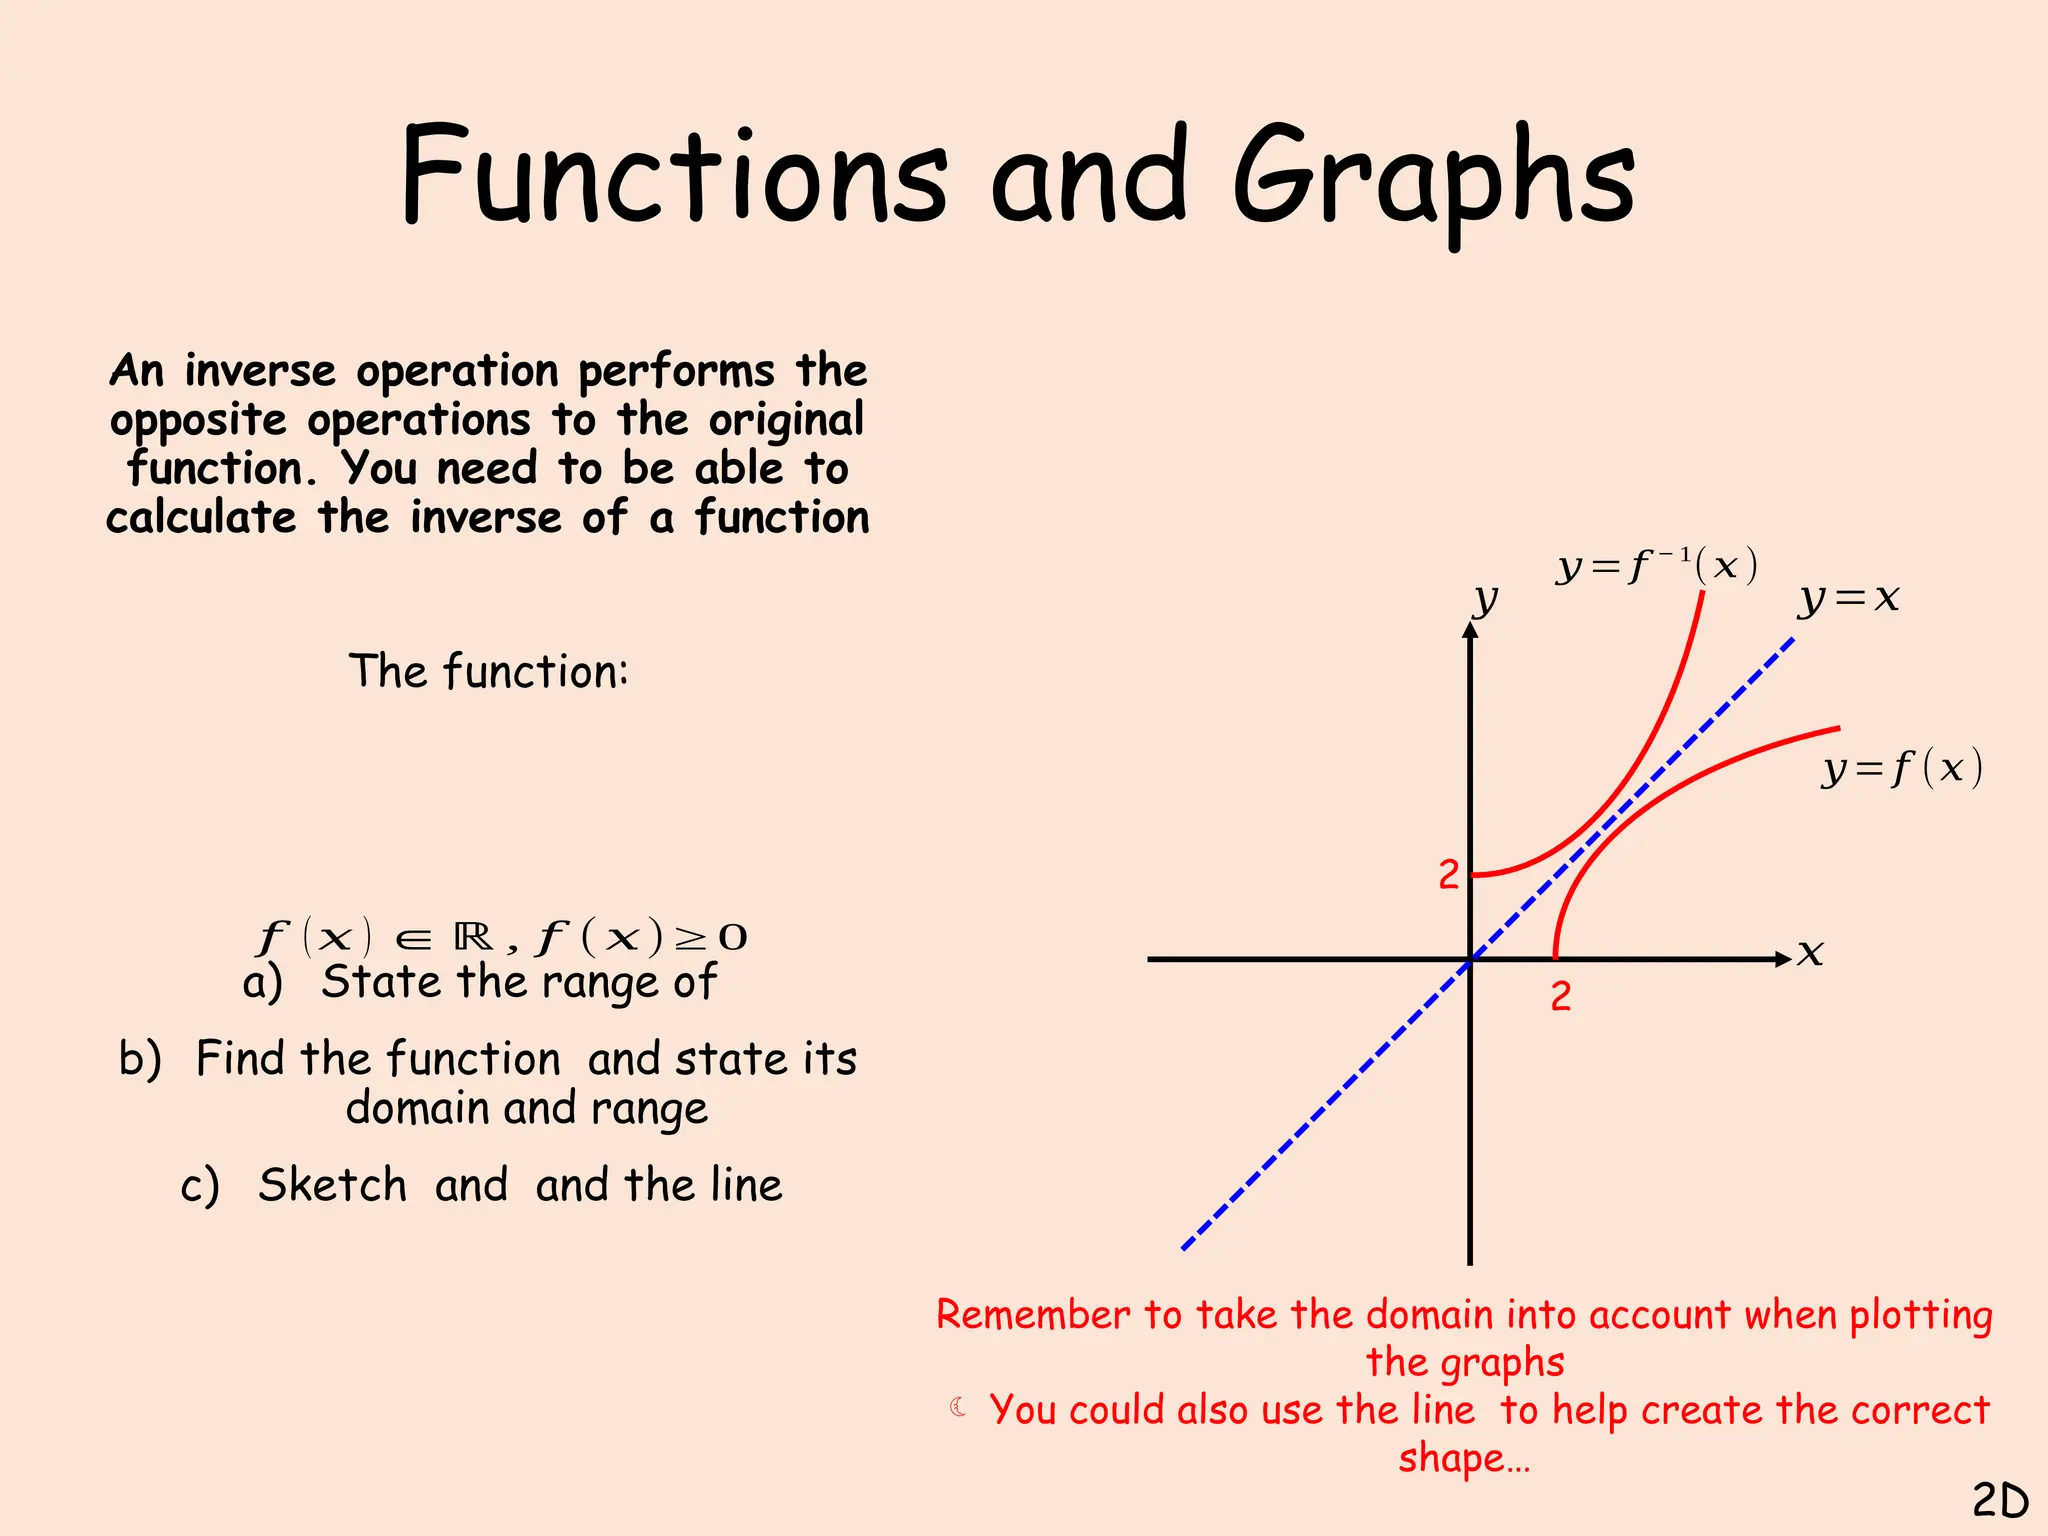
Functions
and Graphs
Twitter: @Owen134866
www.mathsfreeresourcelibrary.com
Prior Knowledge Check
1) Make the subject of each of the
following:
a)
b)
c)
2) Write each expression in its simplest form:
a)
b)
c)
3) Sketch each of the following graphs.
Label any points where the graph cuts
the x or y axis.
a)
b)
c) ,
4) . Find the values of , and
𝒚 =
𝟗−𝟓 𝒙
𝟕
𝒚 =
𝟓 𝒑−𝟖 𝒙
𝟐
𝒚 =
𝟓 𝒙 − 𝟒
𝟖+𝟗 𝒙
𝟐𝟓 𝒙𝟐
−𝟑𝟎 𝒙 +𝟓
𝟏
𝟔𝒙 −𝟏𝟒
𝟑 𝒙+𝟕
− 𝒙 −𝟐
𝟐𝟖,𝟎,𝟏𝟖
Teachings for
Section 2A
Functions and Graphs
You need to be able to draw
graphs and solve equations when
the modulus function is involved
The modulus of a function is its
non-negative numerical value (often
referred to as the ‘absolute’ value)
It is denoted like this:
A modulus function is in general, a
function of the type
2A
𝑓 (𝑥)=|2 𝑥 − 3|+1
𝑓 (5)=|2 (5)− 3|+1
𝑓 (5)=|7|+1
𝑓 (5)=8
𝑓 (𝑥)=|2 𝑥 − 3|+1
𝑓 (− 1)=|2(−1)− 3|+1
𝑓 (− 1)=|− 5|+1
𝑓 (−1)=5+1
𝑓 (−1)=6
Sub in
Calculate the part
inside the modulus
Calculate
Sub in
Calculate the part
inside the modulus
The modulus part will
become positive
Calculate
Find
Find
Lets see what happens when the modulus part is negative…
Functions and Graphs
You need to be able to draw
graphs and solve equations when
the modulus function is involved
Sketch the graph of
You should build this up in stages,
starting without the modulus
part…
Once you have the shape of the
graph without the modulus, think
about how it will affect it
2A
𝑦=3 𝑥− 2
−2
2
3
𝑦=|3𝑥 −2 |
𝑥
𝑦
Any negative output () will now
become positive
 So any parts of the graph below
the x-axis will be reflected above
it!
2
Functions and Graphs
You need to be able to draw
graphs and solve equations when
the modulus function is involved
Solve the equation
Start by sketching the graph of
the modulus, as in the previous
example. Start without the
modulus part…
We now need to find where the
graph crosses
Each part of the graph could be
labelled differently…
2A
𝑦=2 𝑥−1
−1
1
2
𝑦=|2𝑥− 1 |
𝑥
𝑦
1
𝑦=2 𝑥−1
𝑦 =−(2 𝑥 −1)
𝑦 =5
2 𝑥−1=5
2 𝑥=6
𝑥=3
−(2 𝑥 −1)=5
2 𝑥−1=−5
2 𝑥=−4
𝑥=−2
Add 1
Divide
by 2
Multiply
by -1
Add 1
Divide
by 2
Functions and Graphs
You need to be able to draw
graphs and solve equations when
the modulus function is involved
Solve the equation
Sketch both graphs, then
consider the intersections and
what equations they would
represent
2A
𝑦=3 𝑥− 5
−5
5
3
𝑦=|3𝑥 −5 |
𝑥
𝑦
5
𝑦 =2 −
1
2
𝑥
2
4
2−
1
2
𝑥=−(3 𝑥−5)
2−
1
2
𝑥=− 3𝑥+5
5
2
𝑥=3
𝑥=
6
5
2−
1
2
𝑥=3 𝑥− 5
7=
7
2
𝑥
2=𝑥
Expand
bracket
Add 3x,
subtract 2
Divide by
Add , Add
5
Divide by
𝑦=3 𝑥− 5
𝑦=−(3 𝑥− 5)
Functions and Graphs
You need to be able to draw
graphs and solve equations when
the modulus function is involved
Solve the inequality
Start by finding where they
cross
2A
𝑦=5 𝑥−1
−1
1
5
𝑦=|5 𝑥− 1 |
𝑥
𝑦
1
𝑦=3 𝑥
𝑦=5 𝑥−1
𝑦=−(5 𝑥 −1)
−(5 𝑥−1)=3𝑥 Expand
bracket
−5 𝑥+1=3𝑥
1=8 𝑥
1
8
=𝑥
Add 5x
Divide
by 8
5 𝑥−1=3 𝑥
−1=−2 𝑥
1
2
=𝑥
Subtract
5x
Divide
by -2
Consider the values of x for which is above
and
Teachings for
Section 2B
Mapping Diagrams
A mapping diagram transforms one
set of numbers into a different set
of numbers. It can be described in
words or using algebra. They can also
be represented by a Cartesian graph.
The original numbers (Set A, or ‘x’)
are known as the domain.
The results (Set B, or ‘y’) are known
as the range (ie range of answers)
Set A Set B
Add 3 onto the set {-3, 1, 4, 6, x)
-3
1
4
6
x
0
4
7
9
x + 3
2
4
6
8
6
4
2
-2
x
y y = x + 3
Functions and Graphs
2B
Mapping Diagrams
A mapping diagram transforms one
set of numbers into a different set
of numbers. It can be described in
words or using algebra. They can also
be represented by a Cartesian graph.
The original numbers (Set A, or ‘x’)
are known as the domain.
The results (Set B, or ‘y’) are known
as the range (ie range of answers)
Set A Set B
Square the set {-1, 1, -2, 2, x)
-1
1
-2
2
x
1
4
x2
2
4
6
8
6
4
2
-2
x
y y = x2
Functions and Graphs
2B
Many-to-one Function
Functions
A function is a mapping
whereby every element in
the domain is mapped to
only 1 element in the range.
ie) Whatever number you
start with, there is only 1
possible answer to the
operation performed on it.
An example of a mapping
which is not a function
would be square rooting,
where the starting number
may result in no answer, or
2 answers.
Set A Set B
One-to-one Function
Set A Set B
Set A Set B
Not a function
eg) f(x) = x + 5
eg) f(x) = 3x - 2
eg) f(x) = x2 + 1
eg) f(x) = 6 - 3x2
eg) f(x) = √x
eg) f(x) = 1/
x
Functions and Graphs
2B
Many-to-one Function
Functions
A function is a mapping
whereby every element in
the domain is mapped to
only 1 element in the range.
ie) Whatever number you
start with, there is only 1
possible answer to the
operation performed on it.
An example of a mapping
which is not a function
would be square rooting,
where the starting number
may result in no answer, or
2 answers.
One-to-one Function
Not a function
‘A value in the domain (x) gets
mapped to one value in the
range’
‘Multiple values in the domain (x)
get mapped to the same value in
the range’
‘A value in the range can be
mapped to none, one or more
values in the range’
Functions and Graphs
2B
Example Question
Given that the function g(x)
= 2x2
+ 3, find;
a) the value of g(3)
b) the value(s) of a such
that g(a) = 35
g(x) = 2x2 + 3
a) g(3) = 2(3)2 + 3
= 2(9) + 3
= 21
g(a) = 35
= 35
2a2 + 3
= 32
2a2
= 16
a2
= ± 4
a
b)
Functions and Graphs
2B
Example Question
Given that the function g(x)
= 2x2
+ 3, find;
a) the value of g(3)
b) the value(s) of a such
that g(a) = 35
c) the range of the function
 g(x) ≥ 3
y = 2x2 + 3
1 2
-1
-2
2
4
6
8
x
g(x)
To work out the range of the function;
- Sketch it first
- the range is the set of answers you get (ie the
‘y’ values – now labelled as g(x)…)
- Use an Inequality if there is a continuous set of values
You can get any
value bigger than,
or including 3…
Functions and Graphs
2B
An important bit of notation
to remember…
x can be any ‘real number’
 This is for the domain
g(x) can be any ‘real number’
 This is for the range
x
g(x)
Real Number: A number which has a place on a normal number line. Includes
positives, negatives, roots, pi etc…
 Does not include imaginary numbers – eg √-1
Functions and Graphs
2B
Domain changes
A mapping which is not a function, can be
made into one by changing/restricting
the domain (the starting values)
eg) y = +√x
If we restrict the domain to
x ≥ 0, then all values in the domain will
map to one value in the range.
 It now therefore meets the criteria
for being a function!
y
x
This will not be a function as some values in the domain (x) will not
give an answer in the range (y). For example, -2 ( )
f x x
  
, 0
x R x
 
The function x is real
numbers
x is greater
than 0
Real Number: A number which has a
place on a normal number line. Includes
positives, negatives, roots, pi etc…
Functions and Graphs
2B
Find the range of the following
function, and state if it is one-to-
one or many-to-one.
f(x) = 3x – 2, domain {x = 1, 2, 3, 4}
f(x) = 3x – 2, {x = 1, 2, 3, 4}
1
4
3
2
1
10
7
4
Range of f(x): {1, 4, 7, 10}
Description: One to One
No inequality used as there are
only certain values (discrete)
Domain Range
Functions and Graphs
2B
Find the range of the following
function, and state if it is one-to-
one or many-to-one.
g(x) = x2
, domain {x є R, -5 ≤ x ≤ 5}
g(x) = x2
, {-5 ≤ x ≤ 5}
Range of g(x): 0 ≤ g(x) ≤ 25
Description: Many to one
Inequality, so you will have to sketch the graph
g(x) = x2
2 4
-2
-4
5
10
15
20
x
g(x)
Inequality used as the data is
continuous
Range
Functions and Graphs
2B
Find the range of the following
function, and state if it is one-to-
one or many-to-one.
h(x) = 1
/x, domain {x є R, 0 < x ≤ 3}
h(x) = 1
/x, {x є R, 0 < x ≤ 3}
Range of h(x): h(x) ≥ 1/
3
Description: One to One
Inequality, so you will have to sketch the graph
1 2
-1
-2
2
4
6
8
x
h(x)
Range
3
-3
In this domain, the smallest value is 1/
3
As we get close to 0, values will get infinitely
high
h(x) = 1/
x
Functions and Graphs
2B
You will need to be able to plot
more than one function on the
same set of axes, possibly for
different domains.
The function f(x) is defined by:
a) Sketch f(x) stating its range
f(x) > 3
b) Find the values of a such that
f(a) = 19
f(x) = {
5 – 2x x < 1
x2 + 3 x ≥ 1
1 2
-1
-2
2
4
6
8
x
f(x)
3
-3
f(x) = 5 – 2x
f(x) = x2 + 3
 Sketch both graphs on the same axes
 Make sure you use the correct domain for each
The lowest value plotted is 3.
 Careful though as for 5 – 2x, x cannot include 1. Therefore f(x) > 3 (not
including 3)
Functions and Graphs
2B
You will need to be able to plot more
than one function on the same set of
axes, possibly for different domains.
The function f(x) is defined by:
a) Sketch f(x) stating its range
f(x) > 3
b) Find the values of a such that f(a)
= 19
 Solve both equations separately!
 Remember that the answers must
be within the domain given, or they
cannot be included
f(x) = {
5 – 2x x < 1
x2 + 3 x ≥ 1
1 2
-1
-2
2
4
6
8
x
3
-3
f(x) = 5 – 2x
f(x) = x2 + 3
5 – 2x = 19
– 2x = 14
x = -7
x2 + 3 = 19
x2 = 16
x = ±4
x = 4
Linear Equation Quadratic
Equation
(Has to be greater
than 1)
Functions and Graphs
2B
f(x)
Teachings for
Section 2C
Functions and Graphs
You need to be able to solve problems
involving composite functions, where
two or more functions have been
combined
If you see something such as , it means
that you should apply function first,
followed by function .
When combining functions, the order
matters, so ensure you combine them
correctly!
2C
You need to be able to solve
problems involving composite
functions, where two or more
functions have been combined
Given:
f(x) = x2
g(x) = x + 1
Find:
a) fg(x)
b) gf(x)
f(x) = x2 g(x) = x + 1
‘Square x’ ‘Add 1 to x’
It helps to write what you would
do to x for each function
a) fg(x) means g acts first, followed by f.
fg(x)
f(x + 1)
(x + 1)2
fg(x) = x2 + 2x + 1
Replace g(x) with the function
f(x) means ‘square x’, so square
g(x)
Multiply out and simplify
Functions and Graphs
2C
You need to be able to solve
problems involving composite
functions, where two or more
functions have been combined
Given:
f(x) = x2
g(x) = x + 1
Find:
a) fg(x) = x2
+ 2x + 1
b) gf(x)
f(x) = x2 g(x) = x + 1
‘Square x’ ‘Add 1 to x’
It helps to write what you would
do to x for each function
b) gf(x) means f acts first, followed by g.
gf(x)
g(x2)
(x2) + 1
gf(x) = x2 + 1
Replace f(x) with the function
g(x) means ‘add one to x’, so add 1
to f(x)
Simplify
Functions and Graphs
2C
You need to be able to solve
problems involving composite
functions, where two or more
functions have been combined
Given:
f(x) = 3x + 2
g(x) = x2
+ 4
Find:
a) fg(x)
b) gf(x)
c) f2
(x)
d) The values of b so that fg(b) = 62
f(x) = 3x + 2 g(x) = x2 + 4
‘Multiply by 3, then add
2’
‘Square x then add 4’
It helps to write what you would
do to x for each function
a) fg(x) means g acts first, followed by f.
fg(x)
f(x2 + 4)
3(x2 + 4) + 2
fg(x) = 3x2 + 12 + 2
Replace g(x) with the function
f(x) means ‘multiply by 3, then
add 2’
Multiply out and simplify
fg(x) = 3x2 + 14
Functions and Graphs
2C
You need to be able to solve
problems involving composite
functions, where two or more
functions have been combined
Given:
f(x) = 3x + 2
g(x) = x2
+ 4
Find:
a) fg(x) = 3x2
+ 14
b) gf(x)
c) f2
(x)
d) The values of b so that fg(b) = 62
f(x) = 3x + 2 g(x) = x2 + 4
‘Multiply by 3, then add
2’
‘Square x then add 4’
It helps to write what you would
do to x for each function
b) gf(x) means f acts first, followed by g.
gf(x)
g(3x + 2)
(3x + 2)2 + 4
gf(x) = 9x2 + 12x + 4 + 4
Replace f(x) with the function
g(x) means ‘square then add 4’
Multiply out and simplify
gf(x) = 9x2 + 12x + 8
Functions and Graphs
2C
You need to be able to solve
problems involving composite
functions, where two or more
functions have been combined
Given:
f(x) = 3x + 2
g(x) = x2
+ 4
Find:
a) fg(x) = 3x2
+ 14
b) gf(x) = 9x2
+ 12x + 8
c) f2
(x)
d) The values of b so that fg(b) = 62
f(x) = 3x + 2 g(x) = x2 + 4
‘Multiply by 3, then add
2’
‘Square x then add 4’
It helps to write what you would
do to x for each function
c) f2(x) means f acts again on itself
f2(x)
f(3x + 2)
3(3x + 2) + 2
f2(x) = 9x + 6 + 2
Replace f(x) with the function
f(x) means ‘multiply by 3, then
add 2’
Multiply out and simplify
f2(x) = 9x + 8
Functions and Graphs
2C
You need to be able to solve
problems involving composite
functions, where two or more
functions have been combined
Given:
f(x) = 3x + 2
g(x) = x2
+ 4
Find:
a) fg(x) = 3x2
+ 14
b) gf(x) = 9x2
+ 12x + 8
c) f2
(x) = 9x + 8
d) The values of b so that fg(b) = 62
f(x) = 3x + 2 g(x) = x2 + 4
‘Multiply by 3, then add
2’
‘Square x then add 4’
It helps to write what you would
do to x for each function
d) fg(b) = 62, find b
fg(b) = 62
3x2 + 14 = 62
3x2 = 48
x2 = 16
Replace fg(b) with the function
fg(x)
Work through and solve the
equation
Remember 2 possible values
x = ± 4
Functions and Graphs
2C
You need to be able to solve
problems involving composite
functions, where two or more
functions have been combined
The functions and are defined by:
a) Find
b) Solve
Functions and Graphs
2C
𝑔: 𝑥→
𝑥+1
2
𝑔: 3→
3+1
2
𝑔: 3→2
𝑓 : 𝑥→|2𝑥 −8|
𝑓 :2 →|2(2 )− 8|
𝑓 :2→|− 4|
𝑓 :2→4
Sub in
Calculate
Now we substitute this value into
Sub in
Calculate
Use the modulus
You need to be able to solve
problems involving composite
functions, where two or more
functions have been combined
The functions and are defined by:
a) Find
b) Solve
Functions and Graphs
2C
𝑓 (𝑥 )=|2 𝑥 −8|
𝑓 (𝑥+1
2 )=
|2(𝑥+1
2 )−8
|
𝑓 (𝑥+1
2 )=|𝑥 −7|
|𝑥 − 7|=𝑥
We replace with (since that is )
Simplify right side
𝑥
𝑦 𝑦=𝑥
𝑦 =|𝑥 −7|
So the equation we need to solve is:
𝑦=−(𝑥 −7)
7
7
−( 𝑥 − 7)=𝑥
− 𝑥 +7=𝑥
7=2 𝑥
3.5=𝑥
Expand bracket
Add
Divide by 2
Teachings for
Section 2D
Functions and Graphs
An inverse operation performs the
opposite operations to the original
function. You need to be able to
calculate the inverse of a function
Functions and are inverses of each
other.
The above are true since if you
substitute a value into a function,
and then the answer into the inverse
function, the operation will cancel
out and you are back where you
started!
2D
𝑦
𝑥
𝑦=𝑥
𝑓 (𝑥)
𝑓 −1
(𝑥)
 If you plot a function and its inverse, they
are a reflection in the line
 This means that the domain and range of the
original function, become the range and
domain of the inverse (they swap around)
Functions and Graphs
An inverse operation performs the
opposite operations to the original
function. You need to be able to
calculate the inverse of a function
Inverse functions only exist for
one-to-one functions
 If you have a many-to-one
function, such as , then the inverse
will be one-to-many
 Remember that by definition
from section 2B, this is not a
function
𝑦
𝑥
𝑦=𝑥
𝑦 =𝑥2
𝑦=√𝑥
2D
Functions and Graphs
An inverse operation performs the
opposite operations to the original
function. You need to be able to
calculate the inverse of a function
Find the inverse of the function:
To find the inverse of a function,
you can write is as ‘‘, and then
rearrange to make the subject…
2D
This notation means that ‘ is a
member of the set of real numbers,
but not equal to 1’
 Without this ‘clause’, this would
not be a function since putting in
would not yield an output…
𝑦 =
3
𝑥 −1
𝑦 (𝑥 −1)=3
𝑥𝑦 − 𝑦=3
𝑥𝑦=3+ 𝑦
𝑥=
3+ 𝑦
𝑦
𝑓
−1
(𝑥)=
3+ 𝑥
𝑥
Multiply by
Expand bracket
Add
Divide by
Rewrite using and the inverse function
notation
Functions and Graphs
An inverse operation performs the
opposite operations to the original
function. You need to be able to
calculate the inverse of a function
The function:
a) State the range of
b) Find the function and state its
domain and range
c) Sketch and and the line
2D
Substituting in (the smallest ‘allowed’
value) will give an answer 0
As we increase the value of , the answer
will increase above 0
There is no limit to how high a value we
can substitute, so the range will increase
indefinitely…
Therefore, the range is anything greater
than and including 0
𝑓 (𝑥 ) ∈ℝ , 𝑓 (𝑥)≥ 0
You need to state your answer like
the above, using the correct notation
Functions and Graphs
An inverse operation performs the
opposite operations to the original
function. You need to be able to
calculate the inverse of a function
The function:
a) State the range of
b) Find the function and state its
domain and range
c) Sketch and and the line
2D
𝑓 (𝑥 ) ∈ℝ , 𝑓 ( 𝑥) ≥ 0
𝑦=√𝑥− 2
𝑦 2
=𝑥 − 2
𝑦 2
+ 2=𝑥
𝑓 −1
( 𝑥)=𝑥2
+2
Square both sides
Add 2
Rewrite using the inverse function notation
𝑓 (𝑥)=√𝑥 −2 𝑓 −1
( 𝑥)=𝑥2
+2
Original function Inverse function
Domain:
Range:
Domain:
Range:
Consider the domain and range for the
original function, and swap them
around for the inverse…
Functions and Graphs
An inverse operation performs the
opposite operations to the original
function. You need to be able to
calculate the inverse of a function
The function:
a) State the range of
b) Find the function and state its
domain and range
c) Sketch and and the line
2D
𝑓 (𝑥 ) ∈ℝ , 𝑓 ( 𝑥) ≥ 0
𝑦
𝑥
𝑦=𝑥
2
2
Remember to take the domain into account when plotting
the graphs
 You could also use the line to help create the correct
shape…
𝑦= 𝑓 (𝑥)
𝑦 = 𝑓 − 1
(𝑥 )
Functions and Graphs
An inverse operation performs the
opposite operations to the original
function. You need to be able to
calculate the inverse of a function
The function is defined by:
a) Find
b) Sketch and state its domain
c) Solve the equation
2D
𝑦 =𝑥2
− 3
𝑦 +3=𝑥2
√𝑦+3=𝑥
𝑓 −1
(𝑥)=√ 𝑥+3
Add 3
Square root
Rewrite using and the inverse function
notation
Functions and Graphs
An inverse operation performs the
opposite operations to the original
function. You need to be able to
calculate the inverse of a function
The function is defined by:
a) Find
b) Sketch and state its domain
c) Solve the equation
2D
𝑓 −1
(𝑥)=√ 𝑥+3
We need to know the domain to be able to draw the sketch
 We can find the domain by finding the range of the original function
𝑓 (𝑥 )=𝑥2
−3
𝑓 (0)=−3
Sub in 0
Larger values of will increase the value of
 The range is therefore
 So the domain of the inverse will be
Functions and Graphs
An inverse operation performs the
opposite operations to the original
function. You need to be able to
calculate the inverse of a function
The function is defined by:
a) Find
b) Sketch and state its domain
c) Solve the equation
2D
𝑓 −1
(𝑥)=√ 𝑥+3
𝑓 −1
( 𝑥)=√ 𝑥+3 , 𝑥 ≥ − 3
𝑦
𝑥
-3
𝑦 = 𝑓 − 1
(𝑥 )
Functions and Graphs
An inverse operation performs the
opposite operations to the original
function. You need to be able to
calculate the inverse of a function
The function is defined by:
a) Find
b) Sketch and state its domain
c) Solve the equation
2D
𝑓 −1
(𝑥)=√ 𝑥+3
𝑓 −1
( 𝑥)=√ 𝑥+3 , 𝑥 ≥ − 3
𝑦
𝑥
-3
𝑦 = 𝑓 − 1
(𝑥 )
𝑦= 𝑓 (𝑥)
-3
The equations will meet at one point
 To find this point, you could set the equations equal to
each other…
 However, since they meet on the line , it is usually
easier to set one of them equal to that instead!
𝑦=𝑥
Functions and Graphs
An inverse operation performs the
opposite operations to the original
function. You need to be able to
calculate the inverse of a function
The function is defined by:
a) Find
b) Sketch and state its domain
c) Solve the equation
2D
𝑓 −1
(𝑥)=√ 𝑥+3
𝑥2
−3=𝑥
𝑥2
− 𝑥 − 3=0
𝑎=1 𝑏=−1 𝑐=− 3
Subtract
𝑥=
−𝑏± √𝑏2
− 4𝑎𝑐
2𝑎
𝑥=
−(−1)± √(−1)2
− 4(1)(−3)
2(1)
𝑥=
1+√13
2
Sub in values
Calculate (in this case the
answer must be positive,
based on the graph we
sketched)
Teachings for
Section 2E
Functions and Graphs
You need to be able to sketch
graphs of the form and , and
understand the processes
involved
Sketching the graph of
1) Sketch the graph of
2) Reflect any parts where in
the x-axis
3) Remove the parts below the
x-axis
2E
𝑓 (𝑥 )=𝑥2
−3 𝑥 −10
Sketch and
𝑦
𝑥
𝑥
𝑦
𝑓 (𝑥)=𝑥2
−3 𝑥 − 10
𝑓 (𝑥)=(𝑥 −5)(𝑥+2)
Crosses the x-axis at 5 and -2
The y-intercept is at -10
|𝑓 (𝑥) |
The modulus above is of the whole function
 This means that any final answers (‘y’)
that we get which are negative, they will
become positive at the end
5
-2
-10
5
-2
-10
10
𝑓 (𝑥) 𝑓 (𝑥)
Functions and Graphs
You need to be able to sketch
graphs of the form and , and
understand the processes
involved
Sketching the graph of
1) Sketch the graph of for
2) Reflect this in the y-axis
2E
𝑓 (𝑥 )=𝑥2
−3 𝑥 −10
Sketch and
𝑦
𝑥
𝑥
𝑦
𝑓 (𝑥)=𝑥2
−3 𝑥 − 10
𝑓 (𝑥)=(𝑥 −5)(𝑥+2)
Crosses the x-axis at 5 and -2
The y-intercept is at -10
𝑓 (|𝑥|)
The modulus above is of the inputs (x)
 This means that when we put in a
negative number, we get the same output
as for the equivalent positive number
5
-2
-10
5
-10
𝑓 (𝑥) 𝑓 (𝑥)
-5
Functions and Graphs
You need to be able to sketch
graphs of the form and , and
understand the processes
involved
Given that:
a) Sketch
b) Sketch
c) Sketch
2E
360
180
-180
-360
1
-1
𝑦=𝑔(𝑥)
360
180
-180
-360
1
-1
𝑦 =|𝑔(𝑥 ) |
360
180
-180
-360
1
-1
𝑦 =𝑔(|𝑥|)
𝑦
𝑦
𝑦
𝑥
𝑥
𝑥
𝑦=𝑔(𝑥)
Functions and Graphs
You need to be able to sketch
graphs of the form and , and
understand the processes
involved
The diagram shows the graph of ,
with five points labelled.
Sketch each of the following
graphs, labelling points
corresponding to , , , and , as
well as any intersections with the
axes.
a)
b)
𝑦
𝑥
𝐴
𝐵
𝐶
𝐷
𝐸
−7
11
3
(6 ,−5)
(−2.5,15)
𝑦=h (𝑥)
2E
𝑦
𝑥
𝐴
𝐵
𝐶
𝐷
𝐸
−7
11
3
(6 ,−5)
(−2.5,15)
𝑦=h(𝑥)
𝐸 ′
(6,5)
𝑦 =|h(𝑥) |
Functions and Graphs
You need to be able to sketch
graphs of the form and , and
understand the processes
involved
The diagram shows the graph of ,
with five points labelled.
Sketch each of the following
graphs, labelling points
corresponding to , , , and , as
well as any intersections with the
axes.
a)
b)
𝑦
𝑥
𝐴
𝐵
𝐶
𝐷
𝐸
−7
11
3
(6 ,−5)
(−2.5,15)
𝑦=h (𝑥)
2E
𝑦
𝑥
𝐷
𝐸
11
3
(6 ,−5)
𝑦=h (𝑥)
𝐶
𝐷 ′
−3
𝐸 ′
(−6,−5)
𝑦 =h (|𝑥|)
Teachings for
Section 2F
Functions and Graphs
You need to be able to sketch graphs
which have been transformed in
several different ways
A reminder of the various transformations
you saw last year…
is a translation by vector
reflects in the
reflects in the
is a vertical stretch of factor
is a horizontal stretch of factor
2F
The diagram shows the sketch of . Sketch
the graph of
𝑦
𝑥
𝐴
(2,−1)
𝐵
(6,4)
𝑦= 𝑓 (𝑥)
2 𝑓 (𝑥)−1  Vertical stretch factor 2, then
vertical translation 1 unit down
 The y-coordinates double, then decrease by 1
𝐵 ′
(6,7)
𝐴′
(2,−3)
𝑦=2 𝑓 (𝑥 ) −1
Functions and Graphs
You need to be able to sketch graphs
which have been transformed in
several different ways
A reminder of the various transformations
you saw last year…
is a translation by vector
reflects in the
reflects in the
is a vertical stretch of factor
is a horizontal stretch of factor
2F
The diagram shows the sketch of . Sketch
the graph of
𝑦
𝑥
𝐴
(2,−1)
𝐵
(6,4 )
𝑦= 𝑓 (𝑥)
𝑓 (𝑥+2)+2 Horizontal translation 2 units to the
left, then vertical translation 2 units up
 The x-coordinates decrease by 2, and the y-coordinates increase by 2
𝐵 ′
(4,6)
𝐴′
(0,1)
𝑦 = 𝑓 ( 𝑥+2 )+2
You should apply the
bracketed parts first!
Functions and Graphs
You need to be able to sketch graphs
which have been transformed in
several different ways
A reminder of the various transformations
you saw last year…
2F
The diagram shows the sketch of . Sketch
the graph of
𝑦
𝑥
𝐴
(2,−1)
𝐵
(6,4 )
𝑦= 𝑓 (𝑥)
1
4
𝑓 (2𝑥)
 Horizontal stretch by a factor , followed
by a vertical stretch by factor
 The x-coordinates get divided
by 2, and the y-coordinates get
divided by 4
𝐵 ′(3,1)
𝐴′
(1 ,−
1
4 )
𝑦=
1
4
𝑓 (2𝑥)
Functions and Graphs
You need to be able to sketch graphs
which have been transformed in
several different ways
A reminder of the various transformations
you saw last year…
2F
The diagram shows the sketch of . Sketch
the graph of
𝑦
𝑥
𝐴
(2,−1)
𝐵
(6,4 )
𝑦= 𝑓 (𝑥)
− 𝑓 (𝑥−1)
 Horizontal translation 1 unit to the right,
followed by a reflection in the x-axis
 The x-coordinates get increased
by 1, and then the y-coordinates
get multiplied by -1
𝑦 =− 𝑓 ( 𝑥 −1 )
𝐵 ′
(7 ,−4)
𝐴′
(3,1)
Functions and Graphs
You need to be able to sketch graphs
which have been transformed in
several different ways
Given that:
Sketch the graphs of:
a)
b)
Show on each diagram, the point where
the graph meets or crosses the x-axis,
and state the equations of any
asymptotes
2F
𝑦
The graph will be stretched vertically by a factor of 2, and
then translated down 3 units
 A good way of sketching is to do each translation one step
at a time (although it is fine to calculate the coordinates at the
end)
1
𝑦=𝑙𝑛𝑥
𝑦 𝑦=2𝑙𝑛𝑥
Asymptote
at
Asymptote
at
𝑦
𝑦=2𝑙𝑛𝑥 −3
Asymptote
at
𝑥
𝑥 𝑥
Functions and Graphs
You need to be able to sketch graphs
which have been transformed in
several different ways
Given that:
Sketch the graphs of:
a)
b)
Show on each diagram, the point where
the graph meets or crosses the x-axis,
and state the equations of any
asymptotes
2F
𝑦
𝑦=2𝑙𝑛𝑥 −3
Asymptote
at
𝑥
To find the x-intercept, set
2𝑙𝑛𝑥 −3=0
2𝑙𝑛𝑥=3
𝑙𝑛𝑥=1.5
𝑥=𝑒1.5
Add 3
Divide by 2
Inverse logarithm
𝑥=4.48
Calculate, or use the exact value
4.48
Functions and Graphs
You need to be able to sketch graphs
which have been transformed in
several different ways
Given that:
Sketch the graphs of:
a)
b)
Show on each diagram, the point where
the graph meets or crosses the x-axis,
and state the equations of any
asymptotes
2F
𝑦
For the second transformation:
 Reflect the graph in the y-axis
 Then any values below the x-axis will be reflected above it
1
𝑦=𝑙𝑛𝑥
Asymptote
at
𝑥
𝑦
-1
𝑦=ln ⁡(− 𝑥)
Asymptote
at
𝑥
𝑦
-1
𝑦=|ln ⁡
(− 𝑥) |
Asymptote
at
𝑥
Teachings for
Section 2G
Functions and Graphs
You need to be able to solve
problems involving moduli as well as
graph transformations
Given the function:
a) Sketch the graph of the function
b) State the range of the function
c) Solve the equation
2G
𝑦 𝑦 =|𝑥|
𝑥
𝑦 𝑦 =|𝑥 −1|
𝑥
1
𝑦
𝑥
𝑦
𝑥
1
𝑦 =3|𝑥 −1| 𝑦 =3|𝑥 −1|−2
1
3
1
(1,-2)
Build up the
sketch in stages…
Translation
Vertical stretch factor 3 Translation
Functions and Graphs
You need to be able to solve
problems involving moduli as well as
graph transformations
Given the function:
a) Sketch the graph of the function
b) State the range of the function
c) Solve the equation
2G
𝑦
𝑥
𝑦 =3|𝑥 −1|−2
1
(1,-2)
Range
So the range is any real values greater than or equal to -2
 Use the correct notation when writing this!
Functions and Graphs
You need to be able to solve
problems involving moduli as well as
graph transformations
Given the function:
a) Sketch the graph of the function
b) State the range of the function
c) Solve the equation
2G
𝑦
𝑥
𝑦 =3|𝑥 −1|−2
1
(1,-2)
𝑦 =
1
2
𝑥+3
1
2
𝑥+3=3 (𝑥 −1) −2
1
2
𝑥+3=3 𝑥 −5
8=2.5 𝑥
3.2=𝑥
Finding the first solution (on the non-reflected part
of the graph)
Expand bracket and
simplify
Add 5, subtract
Divide by 2.5
Functions and Graphs
You need to be able to solve
problems involving moduli as well as
graph transformations
Given the function:
a) Sketch the graph of the function
b) State the range of the function
c) Solve the equation
2G
𝑦
𝑥
𝑦 =3|𝑥 −1|−2
1
(1,-2)
𝑦 =
1
2
𝑥+3
1
2
𝑥+3=−3 ( 𝑥 −1) −2
1
2
𝑥+3=−3 𝑥+1
2=−3.5 𝑥
−
4
7
=𝑥
Finding the second solution (on the reflected part
of the graph)
Expand bracket and
simplify
Subtract 1, subtract
Divide by 2.5
𝑥=3.2
Functions and Graphs
You need to be able to solve
problems involving moduli as well as
graph transformations
The function is defined by:
A sketch of the graph is shown.
a) State the range of
b) Explain why does not exist
c) Solve the inequality
2G
𝑦
𝑥
𝑓 (𝑥 )=6 −2|𝑥 +3|
6 0
Since the modulus part is positive, we are always going to
be taking away a value which is greater than or equal to 0
 Therefore the largest value for is 6
 So the range is ,
6
Range
Functions and Graphs
You need to be able to solve
problems involving moduli as well as
graph transformations
The function is defined by:
A sketch of the graph is shown.
a) State the range of
b) Explain why does not exist
c) Solve the inequality
2G
𝑦
𝑥
𝑓 (𝑥 )=6 −2|𝑥 +3|
6 0
This function is many-to-one, as different inputs can give
the same output
The inverse would be one-to-many, which is not a function
6
Functions and Graphs
You need to be able to solve
problems involving moduli as well as
graph transformations
The function is defined by:
A sketch of the graph is shown.
a) State the range of
b) Explain why does not exist
c) Solve the inequality
2G
𝑦
𝑥
𝑓 (𝑥 )=6 −2|𝑥 +3|
6 0
6
𝑓 (𝑥 )=5
6 − 2 (𝑥 +3 )=5
6 − 2𝑥− 6=5
−2 𝑥=5
𝑥=−2.5
Solving for the non-reflected part
Expand bracket
Simplify
Divide by 2
−2.5
Functions and Graphs
You need to be able to solve
problems involving moduli as well as
graph transformations
The function is defined by:
A sketch of the graph is shown.
a) State the range of
b) Explain why does not exist
c) Solve the inequality
2G
𝑦
𝑥
𝑓 (𝑥 )=6 −2|𝑥 +3|
6 0
6
𝑓 (𝑥 )=5
6 +2 (𝑥 +3 )=5
6 +2 𝑥 +6=5
2 𝑥=−7
𝑥=−3.5
Solving for the reflected part
Expand bracket
Rearrange
Divide by 2
−2.5
−3.5
Functions and Graphs
You need to be able to solve
problems involving moduli as well as
graph transformations
The function is defined by:
A sketch of the graph is shown.
a) State the range of
b) Explain why does not exist
c) Solve the inequality
2G
𝑦
𝑥
𝑓 (𝑥 )=6 −2|𝑥 +3|
6 0
6
𝑓 (𝑥 )=5
For
−2.5
−3.5

2)-Functions-and-Graphs Presentation.pptx

  • 1.
  • 2.
    Prior Knowledge Check 1)Make the subject of each of the following: a) b) c) 2) Write each expression in its simplest form: a) b) c) 3) Sketch each of the following graphs. Label any points where the graph cuts the x or y axis. a) b) c) , 4) . Find the values of , and 𝒚 = 𝟗−𝟓 𝒙 𝟕 𝒚 = 𝟓 𝒑−𝟖 𝒙 𝟐 𝒚 = 𝟓 𝒙 − 𝟒 𝟖+𝟗 𝒙 𝟐𝟓 𝒙𝟐 −𝟑𝟎 𝒙 +𝟓 𝟏 𝟔𝒙 −𝟏𝟒 𝟑 𝒙+𝟕 − 𝒙 −𝟐 𝟐𝟖,𝟎,𝟏𝟖
  • 3.
  • 4.
    Functions and Graphs Youneed to be able to draw graphs and solve equations when the modulus function is involved The modulus of a function is its non-negative numerical value (often referred to as the ‘absolute’ value) It is denoted like this: A modulus function is in general, a function of the type 2A 𝑓 (𝑥)=|2 𝑥 − 3|+1 𝑓 (5)=|2 (5)− 3|+1 𝑓 (5)=|7|+1 𝑓 (5)=8 𝑓 (𝑥)=|2 𝑥 − 3|+1 𝑓 (− 1)=|2(−1)− 3|+1 𝑓 (− 1)=|− 5|+1 𝑓 (−1)=5+1 𝑓 (−1)=6 Sub in Calculate the part inside the modulus Calculate Sub in Calculate the part inside the modulus The modulus part will become positive Calculate Find Find Lets see what happens when the modulus part is negative…
  • 5.
    Functions and Graphs Youneed to be able to draw graphs and solve equations when the modulus function is involved Sketch the graph of You should build this up in stages, starting without the modulus part… Once you have the shape of the graph without the modulus, think about how it will affect it 2A 𝑦=3 𝑥− 2 −2 2 3 𝑦=|3𝑥 −2 | 𝑥 𝑦 Any negative output () will now become positive  So any parts of the graph below the x-axis will be reflected above it! 2
  • 6.
    Functions and Graphs Youneed to be able to draw graphs and solve equations when the modulus function is involved Solve the equation Start by sketching the graph of the modulus, as in the previous example. Start without the modulus part… We now need to find where the graph crosses Each part of the graph could be labelled differently… 2A 𝑦=2 𝑥−1 −1 1 2 𝑦=|2𝑥− 1 | 𝑥 𝑦 1 𝑦=2 𝑥−1 𝑦 =−(2 𝑥 −1) 𝑦 =5 2 𝑥−1=5 2 𝑥=6 𝑥=3 −(2 𝑥 −1)=5 2 𝑥−1=−5 2 𝑥=−4 𝑥=−2 Add 1 Divide by 2 Multiply by -1 Add 1 Divide by 2
  • 7.
    Functions and Graphs Youneed to be able to draw graphs and solve equations when the modulus function is involved Solve the equation Sketch both graphs, then consider the intersections and what equations they would represent 2A 𝑦=3 𝑥− 5 −5 5 3 𝑦=|3𝑥 −5 | 𝑥 𝑦 5 𝑦 =2 − 1 2 𝑥 2 4 2− 1 2 𝑥=−(3 𝑥−5) 2− 1 2 𝑥=− 3𝑥+5 5 2 𝑥=3 𝑥= 6 5 2− 1 2 𝑥=3 𝑥− 5 7= 7 2 𝑥 2=𝑥 Expand bracket Add 3x, subtract 2 Divide by Add , Add 5 Divide by 𝑦=3 𝑥− 5 𝑦=−(3 𝑥− 5)
  • 8.
    Functions and Graphs Youneed to be able to draw graphs and solve equations when the modulus function is involved Solve the inequality Start by finding where they cross 2A 𝑦=5 𝑥−1 −1 1 5 𝑦=|5 𝑥− 1 | 𝑥 𝑦 1 𝑦=3 𝑥 𝑦=5 𝑥−1 𝑦=−(5 𝑥 −1) −(5 𝑥−1)=3𝑥 Expand bracket −5 𝑥+1=3𝑥 1=8 𝑥 1 8 =𝑥 Add 5x Divide by 8 5 𝑥−1=3 𝑥 −1=−2 𝑥 1 2 =𝑥 Subtract 5x Divide by -2 Consider the values of x for which is above and
  • 9.
  • 10.
    Mapping Diagrams A mappingdiagram transforms one set of numbers into a different set of numbers. It can be described in words or using algebra. They can also be represented by a Cartesian graph. The original numbers (Set A, or ‘x’) are known as the domain. The results (Set B, or ‘y’) are known as the range (ie range of answers) Set A Set B Add 3 onto the set {-3, 1, 4, 6, x) -3 1 4 6 x 0 4 7 9 x + 3 2 4 6 8 6 4 2 -2 x y y = x + 3 Functions and Graphs 2B
  • 11.
    Mapping Diagrams A mappingdiagram transforms one set of numbers into a different set of numbers. It can be described in words or using algebra. They can also be represented by a Cartesian graph. The original numbers (Set A, or ‘x’) are known as the domain. The results (Set B, or ‘y’) are known as the range (ie range of answers) Set A Set B Square the set {-1, 1, -2, 2, x) -1 1 -2 2 x 1 4 x2 2 4 6 8 6 4 2 -2 x y y = x2 Functions and Graphs 2B
  • 12.
    Many-to-one Function Functions A functionis a mapping whereby every element in the domain is mapped to only 1 element in the range. ie) Whatever number you start with, there is only 1 possible answer to the operation performed on it. An example of a mapping which is not a function would be square rooting, where the starting number may result in no answer, or 2 answers. Set A Set B One-to-one Function Set A Set B Set A Set B Not a function eg) f(x) = x + 5 eg) f(x) = 3x - 2 eg) f(x) = x2 + 1 eg) f(x) = 6 - 3x2 eg) f(x) = √x eg) f(x) = 1/ x Functions and Graphs 2B
  • 13.
    Many-to-one Function Functions A functionis a mapping whereby every element in the domain is mapped to only 1 element in the range. ie) Whatever number you start with, there is only 1 possible answer to the operation performed on it. An example of a mapping which is not a function would be square rooting, where the starting number may result in no answer, or 2 answers. One-to-one Function Not a function ‘A value in the domain (x) gets mapped to one value in the range’ ‘Multiple values in the domain (x) get mapped to the same value in the range’ ‘A value in the range can be mapped to none, one or more values in the range’ Functions and Graphs 2B
  • 14.
    Example Question Given thatthe function g(x) = 2x2 + 3, find; a) the value of g(3) b) the value(s) of a such that g(a) = 35 g(x) = 2x2 + 3 a) g(3) = 2(3)2 + 3 = 2(9) + 3 = 21 g(a) = 35 = 35 2a2 + 3 = 32 2a2 = 16 a2 = ± 4 a b) Functions and Graphs 2B
  • 15.
    Example Question Given thatthe function g(x) = 2x2 + 3, find; a) the value of g(3) b) the value(s) of a such that g(a) = 35 c) the range of the function  g(x) ≥ 3 y = 2x2 + 3 1 2 -1 -2 2 4 6 8 x g(x) To work out the range of the function; - Sketch it first - the range is the set of answers you get (ie the ‘y’ values – now labelled as g(x)…) - Use an Inequality if there is a continuous set of values You can get any value bigger than, or including 3… Functions and Graphs 2B
  • 16.
    An important bitof notation to remember… x can be any ‘real number’  This is for the domain g(x) can be any ‘real number’  This is for the range x g(x) Real Number: A number which has a place on a normal number line. Includes positives, negatives, roots, pi etc…  Does not include imaginary numbers – eg √-1 Functions and Graphs 2B
  • 17.
    Domain changes A mappingwhich is not a function, can be made into one by changing/restricting the domain (the starting values) eg) y = +√x If we restrict the domain to x ≥ 0, then all values in the domain will map to one value in the range.  It now therefore meets the criteria for being a function! y x This will not be a function as some values in the domain (x) will not give an answer in the range (y). For example, -2 ( ) f x x    , 0 x R x   The function x is real numbers x is greater than 0 Real Number: A number which has a place on a normal number line. Includes positives, negatives, roots, pi etc… Functions and Graphs 2B
  • 18.
    Find the rangeof the following function, and state if it is one-to- one or many-to-one. f(x) = 3x – 2, domain {x = 1, 2, 3, 4} f(x) = 3x – 2, {x = 1, 2, 3, 4} 1 4 3 2 1 10 7 4 Range of f(x): {1, 4, 7, 10} Description: One to One No inequality used as there are only certain values (discrete) Domain Range Functions and Graphs 2B
  • 19.
    Find the rangeof the following function, and state if it is one-to- one or many-to-one. g(x) = x2 , domain {x є R, -5 ≤ x ≤ 5} g(x) = x2 , {-5 ≤ x ≤ 5} Range of g(x): 0 ≤ g(x) ≤ 25 Description: Many to one Inequality, so you will have to sketch the graph g(x) = x2 2 4 -2 -4 5 10 15 20 x g(x) Inequality used as the data is continuous Range Functions and Graphs 2B
  • 20.
    Find the rangeof the following function, and state if it is one-to- one or many-to-one. h(x) = 1 /x, domain {x є R, 0 < x ≤ 3} h(x) = 1 /x, {x є R, 0 < x ≤ 3} Range of h(x): h(x) ≥ 1/ 3 Description: One to One Inequality, so you will have to sketch the graph 1 2 -1 -2 2 4 6 8 x h(x) Range 3 -3 In this domain, the smallest value is 1/ 3 As we get close to 0, values will get infinitely high h(x) = 1/ x Functions and Graphs 2B
  • 21.
    You will needto be able to plot more than one function on the same set of axes, possibly for different domains. The function f(x) is defined by: a) Sketch f(x) stating its range f(x) > 3 b) Find the values of a such that f(a) = 19 f(x) = { 5 – 2x x < 1 x2 + 3 x ≥ 1 1 2 -1 -2 2 4 6 8 x f(x) 3 -3 f(x) = 5 – 2x f(x) = x2 + 3  Sketch both graphs on the same axes  Make sure you use the correct domain for each The lowest value plotted is 3.  Careful though as for 5 – 2x, x cannot include 1. Therefore f(x) > 3 (not including 3) Functions and Graphs 2B
  • 22.
    You will needto be able to plot more than one function on the same set of axes, possibly for different domains. The function f(x) is defined by: a) Sketch f(x) stating its range f(x) > 3 b) Find the values of a such that f(a) = 19  Solve both equations separately!  Remember that the answers must be within the domain given, or they cannot be included f(x) = { 5 – 2x x < 1 x2 + 3 x ≥ 1 1 2 -1 -2 2 4 6 8 x 3 -3 f(x) = 5 – 2x f(x) = x2 + 3 5 – 2x = 19 – 2x = 14 x = -7 x2 + 3 = 19 x2 = 16 x = ±4 x = 4 Linear Equation Quadratic Equation (Has to be greater than 1) Functions and Graphs 2B f(x)
  • 23.
  • 24.
    Functions and Graphs Youneed to be able to solve problems involving composite functions, where two or more functions have been combined If you see something such as , it means that you should apply function first, followed by function . When combining functions, the order matters, so ensure you combine them correctly! 2C
  • 25.
    You need tobe able to solve problems involving composite functions, where two or more functions have been combined Given: f(x) = x2 g(x) = x + 1 Find: a) fg(x) b) gf(x) f(x) = x2 g(x) = x + 1 ‘Square x’ ‘Add 1 to x’ It helps to write what you would do to x for each function a) fg(x) means g acts first, followed by f. fg(x) f(x + 1) (x + 1)2 fg(x) = x2 + 2x + 1 Replace g(x) with the function f(x) means ‘square x’, so square g(x) Multiply out and simplify Functions and Graphs 2C
  • 26.
    You need tobe able to solve problems involving composite functions, where two or more functions have been combined Given: f(x) = x2 g(x) = x + 1 Find: a) fg(x) = x2 + 2x + 1 b) gf(x) f(x) = x2 g(x) = x + 1 ‘Square x’ ‘Add 1 to x’ It helps to write what you would do to x for each function b) gf(x) means f acts first, followed by g. gf(x) g(x2) (x2) + 1 gf(x) = x2 + 1 Replace f(x) with the function g(x) means ‘add one to x’, so add 1 to f(x) Simplify Functions and Graphs 2C
  • 27.
    You need tobe able to solve problems involving composite functions, where two or more functions have been combined Given: f(x) = 3x + 2 g(x) = x2 + 4 Find: a) fg(x) b) gf(x) c) f2 (x) d) The values of b so that fg(b) = 62 f(x) = 3x + 2 g(x) = x2 + 4 ‘Multiply by 3, then add 2’ ‘Square x then add 4’ It helps to write what you would do to x for each function a) fg(x) means g acts first, followed by f. fg(x) f(x2 + 4) 3(x2 + 4) + 2 fg(x) = 3x2 + 12 + 2 Replace g(x) with the function f(x) means ‘multiply by 3, then add 2’ Multiply out and simplify fg(x) = 3x2 + 14 Functions and Graphs 2C
  • 28.
    You need tobe able to solve problems involving composite functions, where two or more functions have been combined Given: f(x) = 3x + 2 g(x) = x2 + 4 Find: a) fg(x) = 3x2 + 14 b) gf(x) c) f2 (x) d) The values of b so that fg(b) = 62 f(x) = 3x + 2 g(x) = x2 + 4 ‘Multiply by 3, then add 2’ ‘Square x then add 4’ It helps to write what you would do to x for each function b) gf(x) means f acts first, followed by g. gf(x) g(3x + 2) (3x + 2)2 + 4 gf(x) = 9x2 + 12x + 4 + 4 Replace f(x) with the function g(x) means ‘square then add 4’ Multiply out and simplify gf(x) = 9x2 + 12x + 8 Functions and Graphs 2C
  • 29.
    You need tobe able to solve problems involving composite functions, where two or more functions have been combined Given: f(x) = 3x + 2 g(x) = x2 + 4 Find: a) fg(x) = 3x2 + 14 b) gf(x) = 9x2 + 12x + 8 c) f2 (x) d) The values of b so that fg(b) = 62 f(x) = 3x + 2 g(x) = x2 + 4 ‘Multiply by 3, then add 2’ ‘Square x then add 4’ It helps to write what you would do to x for each function c) f2(x) means f acts again on itself f2(x) f(3x + 2) 3(3x + 2) + 2 f2(x) = 9x + 6 + 2 Replace f(x) with the function f(x) means ‘multiply by 3, then add 2’ Multiply out and simplify f2(x) = 9x + 8 Functions and Graphs 2C
  • 30.
    You need tobe able to solve problems involving composite functions, where two or more functions have been combined Given: f(x) = 3x + 2 g(x) = x2 + 4 Find: a) fg(x) = 3x2 + 14 b) gf(x) = 9x2 + 12x + 8 c) f2 (x) = 9x + 8 d) The values of b so that fg(b) = 62 f(x) = 3x + 2 g(x) = x2 + 4 ‘Multiply by 3, then add 2’ ‘Square x then add 4’ It helps to write what you would do to x for each function d) fg(b) = 62, find b fg(b) = 62 3x2 + 14 = 62 3x2 = 48 x2 = 16 Replace fg(b) with the function fg(x) Work through and solve the equation Remember 2 possible values x = ± 4 Functions and Graphs 2C
  • 31.
    You need tobe able to solve problems involving composite functions, where two or more functions have been combined The functions and are defined by: a) Find b) Solve Functions and Graphs 2C 𝑔: 𝑥→ 𝑥+1 2 𝑔: 3→ 3+1 2 𝑔: 3→2 𝑓 : 𝑥→|2𝑥 −8| 𝑓 :2 →|2(2 )− 8| 𝑓 :2→|− 4| 𝑓 :2→4 Sub in Calculate Now we substitute this value into Sub in Calculate Use the modulus
  • 32.
    You need tobe able to solve problems involving composite functions, where two or more functions have been combined The functions and are defined by: a) Find b) Solve Functions and Graphs 2C 𝑓 (𝑥 )=|2 𝑥 −8| 𝑓 (𝑥+1 2 )= |2(𝑥+1 2 )−8 | 𝑓 (𝑥+1 2 )=|𝑥 −7| |𝑥 − 7|=𝑥 We replace with (since that is ) Simplify right side 𝑥 𝑦 𝑦=𝑥 𝑦 =|𝑥 −7| So the equation we need to solve is: 𝑦=−(𝑥 −7) 7 7 −( 𝑥 − 7)=𝑥 − 𝑥 +7=𝑥 7=2 𝑥 3.5=𝑥 Expand bracket Add Divide by 2
  • 33.
  • 34.
    Functions and Graphs Aninverse operation performs the opposite operations to the original function. You need to be able to calculate the inverse of a function Functions and are inverses of each other. The above are true since if you substitute a value into a function, and then the answer into the inverse function, the operation will cancel out and you are back where you started! 2D 𝑦 𝑥 𝑦=𝑥 𝑓 (𝑥) 𝑓 −1 (𝑥)  If you plot a function and its inverse, they are a reflection in the line  This means that the domain and range of the original function, become the range and domain of the inverse (they swap around)
  • 35.
    Functions and Graphs Aninverse operation performs the opposite operations to the original function. You need to be able to calculate the inverse of a function Inverse functions only exist for one-to-one functions  If you have a many-to-one function, such as , then the inverse will be one-to-many  Remember that by definition from section 2B, this is not a function 𝑦 𝑥 𝑦=𝑥 𝑦 =𝑥2 𝑦=√𝑥 2D
  • 36.
    Functions and Graphs Aninverse operation performs the opposite operations to the original function. You need to be able to calculate the inverse of a function Find the inverse of the function: To find the inverse of a function, you can write is as ‘‘, and then rearrange to make the subject… 2D This notation means that ‘ is a member of the set of real numbers, but not equal to 1’  Without this ‘clause’, this would not be a function since putting in would not yield an output… 𝑦 = 3 𝑥 −1 𝑦 (𝑥 −1)=3 𝑥𝑦 − 𝑦=3 𝑥𝑦=3+ 𝑦 𝑥= 3+ 𝑦 𝑦 𝑓 −1 (𝑥)= 3+ 𝑥 𝑥 Multiply by Expand bracket Add Divide by Rewrite using and the inverse function notation
  • 37.
    Functions and Graphs Aninverse operation performs the opposite operations to the original function. You need to be able to calculate the inverse of a function The function: a) State the range of b) Find the function and state its domain and range c) Sketch and and the line 2D Substituting in (the smallest ‘allowed’ value) will give an answer 0 As we increase the value of , the answer will increase above 0 There is no limit to how high a value we can substitute, so the range will increase indefinitely… Therefore, the range is anything greater than and including 0 𝑓 (𝑥 ) ∈ℝ , 𝑓 (𝑥)≥ 0 You need to state your answer like the above, using the correct notation
  • 38.
    Functions and Graphs Aninverse operation performs the opposite operations to the original function. You need to be able to calculate the inverse of a function The function: a) State the range of b) Find the function and state its domain and range c) Sketch and and the line 2D 𝑓 (𝑥 ) ∈ℝ , 𝑓 ( 𝑥) ≥ 0 𝑦=√𝑥− 2 𝑦 2 =𝑥 − 2 𝑦 2 + 2=𝑥 𝑓 −1 ( 𝑥)=𝑥2 +2 Square both sides Add 2 Rewrite using the inverse function notation 𝑓 (𝑥)=√𝑥 −2 𝑓 −1 ( 𝑥)=𝑥2 +2 Original function Inverse function Domain: Range: Domain: Range: Consider the domain and range for the original function, and swap them around for the inverse…
  • 39.
    Functions and Graphs Aninverse operation performs the opposite operations to the original function. You need to be able to calculate the inverse of a function The function: a) State the range of b) Find the function and state its domain and range c) Sketch and and the line 2D 𝑓 (𝑥 ) ∈ℝ , 𝑓 ( 𝑥) ≥ 0 𝑦 𝑥 𝑦=𝑥 2 2 Remember to take the domain into account when plotting the graphs  You could also use the line to help create the correct shape… 𝑦= 𝑓 (𝑥) 𝑦 = 𝑓 − 1 (𝑥 )
  • 40.
    Functions and Graphs Aninverse operation performs the opposite operations to the original function. You need to be able to calculate the inverse of a function The function is defined by: a) Find b) Sketch and state its domain c) Solve the equation 2D 𝑦 =𝑥2 − 3 𝑦 +3=𝑥2 √𝑦+3=𝑥 𝑓 −1 (𝑥)=√ 𝑥+3 Add 3 Square root Rewrite using and the inverse function notation
  • 41.
    Functions and Graphs Aninverse operation performs the opposite operations to the original function. You need to be able to calculate the inverse of a function The function is defined by: a) Find b) Sketch and state its domain c) Solve the equation 2D 𝑓 −1 (𝑥)=√ 𝑥+3 We need to know the domain to be able to draw the sketch  We can find the domain by finding the range of the original function 𝑓 (𝑥 )=𝑥2 −3 𝑓 (0)=−3 Sub in 0 Larger values of will increase the value of  The range is therefore  So the domain of the inverse will be
  • 42.
    Functions and Graphs Aninverse operation performs the opposite operations to the original function. You need to be able to calculate the inverse of a function The function is defined by: a) Find b) Sketch and state its domain c) Solve the equation 2D 𝑓 −1 (𝑥)=√ 𝑥+3 𝑓 −1 ( 𝑥)=√ 𝑥+3 , 𝑥 ≥ − 3 𝑦 𝑥 -3 𝑦 = 𝑓 − 1 (𝑥 )
  • 43.
    Functions and Graphs Aninverse operation performs the opposite operations to the original function. You need to be able to calculate the inverse of a function The function is defined by: a) Find b) Sketch and state its domain c) Solve the equation 2D 𝑓 −1 (𝑥)=√ 𝑥+3 𝑓 −1 ( 𝑥)=√ 𝑥+3 , 𝑥 ≥ − 3 𝑦 𝑥 -3 𝑦 = 𝑓 − 1 (𝑥 ) 𝑦= 𝑓 (𝑥) -3 The equations will meet at one point  To find this point, you could set the equations equal to each other…  However, since they meet on the line , it is usually easier to set one of them equal to that instead! 𝑦=𝑥
  • 44.
    Functions and Graphs Aninverse operation performs the opposite operations to the original function. You need to be able to calculate the inverse of a function The function is defined by: a) Find b) Sketch and state its domain c) Solve the equation 2D 𝑓 −1 (𝑥)=√ 𝑥+3 𝑥2 −3=𝑥 𝑥2 − 𝑥 − 3=0 𝑎=1 𝑏=−1 𝑐=− 3 Subtract 𝑥= −𝑏± √𝑏2 − 4𝑎𝑐 2𝑎 𝑥= −(−1)± √(−1)2 − 4(1)(−3) 2(1) 𝑥= 1+√13 2 Sub in values Calculate (in this case the answer must be positive, based on the graph we sketched)
  • 45.
  • 46.
    Functions and Graphs Youneed to be able to sketch graphs of the form and , and understand the processes involved Sketching the graph of 1) Sketch the graph of 2) Reflect any parts where in the x-axis 3) Remove the parts below the x-axis 2E 𝑓 (𝑥 )=𝑥2 −3 𝑥 −10 Sketch and 𝑦 𝑥 𝑥 𝑦 𝑓 (𝑥)=𝑥2 −3 𝑥 − 10 𝑓 (𝑥)=(𝑥 −5)(𝑥+2) Crosses the x-axis at 5 and -2 The y-intercept is at -10 |𝑓 (𝑥) | The modulus above is of the whole function  This means that any final answers (‘y’) that we get which are negative, they will become positive at the end 5 -2 -10 5 -2 -10 10 𝑓 (𝑥) 𝑓 (𝑥)
  • 47.
    Functions and Graphs Youneed to be able to sketch graphs of the form and , and understand the processes involved Sketching the graph of 1) Sketch the graph of for 2) Reflect this in the y-axis 2E 𝑓 (𝑥 )=𝑥2 −3 𝑥 −10 Sketch and 𝑦 𝑥 𝑥 𝑦 𝑓 (𝑥)=𝑥2 −3 𝑥 − 10 𝑓 (𝑥)=(𝑥 −5)(𝑥+2) Crosses the x-axis at 5 and -2 The y-intercept is at -10 𝑓 (|𝑥|) The modulus above is of the inputs (x)  This means that when we put in a negative number, we get the same output as for the equivalent positive number 5 -2 -10 5 -10 𝑓 (𝑥) 𝑓 (𝑥) -5
  • 48.
    Functions and Graphs Youneed to be able to sketch graphs of the form and , and understand the processes involved Given that: a) Sketch b) Sketch c) Sketch 2E 360 180 -180 -360 1 -1 𝑦=𝑔(𝑥) 360 180 -180 -360 1 -1 𝑦 =|𝑔(𝑥 ) | 360 180 -180 -360 1 -1 𝑦 =𝑔(|𝑥|) 𝑦 𝑦 𝑦 𝑥 𝑥 𝑥 𝑦=𝑔(𝑥)
  • 49.
    Functions and Graphs Youneed to be able to sketch graphs of the form and , and understand the processes involved The diagram shows the graph of , with five points labelled. Sketch each of the following graphs, labelling points corresponding to , , , and , as well as any intersections with the axes. a) b) 𝑦 𝑥 𝐴 𝐵 𝐶 𝐷 𝐸 −7 11 3 (6 ,−5) (−2.5,15) 𝑦=h (𝑥) 2E 𝑦 𝑥 𝐴 𝐵 𝐶 𝐷 𝐸 −7 11 3 (6 ,−5) (−2.5,15) 𝑦=h(𝑥) 𝐸 ′ (6,5) 𝑦 =|h(𝑥) |
  • 50.
    Functions and Graphs Youneed to be able to sketch graphs of the form and , and understand the processes involved The diagram shows the graph of , with five points labelled. Sketch each of the following graphs, labelling points corresponding to , , , and , as well as any intersections with the axes. a) b) 𝑦 𝑥 𝐴 𝐵 𝐶 𝐷 𝐸 −7 11 3 (6 ,−5) (−2.5,15) 𝑦=h (𝑥) 2E 𝑦 𝑥 𝐷 𝐸 11 3 (6 ,−5) 𝑦=h (𝑥) 𝐶 𝐷 ′ −3 𝐸 ′ (−6,−5) 𝑦 =h (|𝑥|)
  • 51.
  • 52.
    Functions and Graphs Youneed to be able to sketch graphs which have been transformed in several different ways A reminder of the various transformations you saw last year… is a translation by vector is a translation by vector reflects in the reflects in the is a vertical stretch of factor is a horizontal stretch of factor 2F The diagram shows the sketch of . Sketch the graph of 𝑦 𝑥 𝐴 (2,−1) 𝐵 (6,4) 𝑦= 𝑓 (𝑥) 2 𝑓 (𝑥)−1  Vertical stretch factor 2, then vertical translation 1 unit down  The y-coordinates double, then decrease by 1 𝐵 ′ (6,7) 𝐴′ (2,−3) 𝑦=2 𝑓 (𝑥 ) −1
  • 53.
    Functions and Graphs Youneed to be able to sketch graphs which have been transformed in several different ways A reminder of the various transformations you saw last year… is a translation by vector is a translation by vector reflects in the reflects in the is a vertical stretch of factor is a horizontal stretch of factor 2F The diagram shows the sketch of . Sketch the graph of 𝑦 𝑥 𝐴 (2,−1) 𝐵 (6,4 ) 𝑦= 𝑓 (𝑥) 𝑓 (𝑥+2)+2 Horizontal translation 2 units to the left, then vertical translation 2 units up  The x-coordinates decrease by 2, and the y-coordinates increase by 2 𝐵 ′ (4,6) 𝐴′ (0,1) 𝑦 = 𝑓 ( 𝑥+2 )+2 You should apply the bracketed parts first!
  • 54.
    Functions and Graphs Youneed to be able to sketch graphs which have been transformed in several different ways A reminder of the various transformations you saw last year… 2F The diagram shows the sketch of . Sketch the graph of 𝑦 𝑥 𝐴 (2,−1) 𝐵 (6,4 ) 𝑦= 𝑓 (𝑥) 1 4 𝑓 (2𝑥)  Horizontal stretch by a factor , followed by a vertical stretch by factor  The x-coordinates get divided by 2, and the y-coordinates get divided by 4 𝐵 ′(3,1) 𝐴′ (1 ,− 1 4 ) 𝑦= 1 4 𝑓 (2𝑥)
  • 55.
    Functions and Graphs Youneed to be able to sketch graphs which have been transformed in several different ways A reminder of the various transformations you saw last year… 2F The diagram shows the sketch of . Sketch the graph of 𝑦 𝑥 𝐴 (2,−1) 𝐵 (6,4 ) 𝑦= 𝑓 (𝑥) − 𝑓 (𝑥−1)  Horizontal translation 1 unit to the right, followed by a reflection in the x-axis  The x-coordinates get increased by 1, and then the y-coordinates get multiplied by -1 𝑦 =− 𝑓 ( 𝑥 −1 ) 𝐵 ′ (7 ,−4) 𝐴′ (3,1)
  • 56.
    Functions and Graphs Youneed to be able to sketch graphs which have been transformed in several different ways Given that: Sketch the graphs of: a) b) Show on each diagram, the point where the graph meets or crosses the x-axis, and state the equations of any asymptotes 2F 𝑦 The graph will be stretched vertically by a factor of 2, and then translated down 3 units  A good way of sketching is to do each translation one step at a time (although it is fine to calculate the coordinates at the end) 1 𝑦=𝑙𝑛𝑥 𝑦 𝑦=2𝑙𝑛𝑥 Asymptote at Asymptote at 𝑦 𝑦=2𝑙𝑛𝑥 −3 Asymptote at 𝑥 𝑥 𝑥
  • 57.
    Functions and Graphs Youneed to be able to sketch graphs which have been transformed in several different ways Given that: Sketch the graphs of: a) b) Show on each diagram, the point where the graph meets or crosses the x-axis, and state the equations of any asymptotes 2F 𝑦 𝑦=2𝑙𝑛𝑥 −3 Asymptote at 𝑥 To find the x-intercept, set 2𝑙𝑛𝑥 −3=0 2𝑙𝑛𝑥=3 𝑙𝑛𝑥=1.5 𝑥=𝑒1.5 Add 3 Divide by 2 Inverse logarithm 𝑥=4.48 Calculate, or use the exact value 4.48
  • 58.
    Functions and Graphs Youneed to be able to sketch graphs which have been transformed in several different ways Given that: Sketch the graphs of: a) b) Show on each diagram, the point where the graph meets or crosses the x-axis, and state the equations of any asymptotes 2F 𝑦 For the second transformation:  Reflect the graph in the y-axis  Then any values below the x-axis will be reflected above it 1 𝑦=𝑙𝑛𝑥 Asymptote at 𝑥 𝑦 -1 𝑦=ln ⁡(− 𝑥) Asymptote at 𝑥 𝑦 -1 𝑦=|ln ⁡ (− 𝑥) | Asymptote at 𝑥
  • 59.
  • 60.
    Functions and Graphs Youneed to be able to solve problems involving moduli as well as graph transformations Given the function: a) Sketch the graph of the function b) State the range of the function c) Solve the equation 2G 𝑦 𝑦 =|𝑥| 𝑥 𝑦 𝑦 =|𝑥 −1| 𝑥 1 𝑦 𝑥 𝑦 𝑥 1 𝑦 =3|𝑥 −1| 𝑦 =3|𝑥 −1|−2 1 3 1 (1,-2) Build up the sketch in stages… Translation Vertical stretch factor 3 Translation
  • 61.
    Functions and Graphs Youneed to be able to solve problems involving moduli as well as graph transformations Given the function: a) Sketch the graph of the function b) State the range of the function c) Solve the equation 2G 𝑦 𝑥 𝑦 =3|𝑥 −1|−2 1 (1,-2) Range So the range is any real values greater than or equal to -2  Use the correct notation when writing this!
  • 62.
    Functions and Graphs Youneed to be able to solve problems involving moduli as well as graph transformations Given the function: a) Sketch the graph of the function b) State the range of the function c) Solve the equation 2G 𝑦 𝑥 𝑦 =3|𝑥 −1|−2 1 (1,-2) 𝑦 = 1 2 𝑥+3 1 2 𝑥+3=3 (𝑥 −1) −2 1 2 𝑥+3=3 𝑥 −5 8=2.5 𝑥 3.2=𝑥 Finding the first solution (on the non-reflected part of the graph) Expand bracket and simplify Add 5, subtract Divide by 2.5
  • 63.
    Functions and Graphs Youneed to be able to solve problems involving moduli as well as graph transformations Given the function: a) Sketch the graph of the function b) State the range of the function c) Solve the equation 2G 𝑦 𝑥 𝑦 =3|𝑥 −1|−2 1 (1,-2) 𝑦 = 1 2 𝑥+3 1 2 𝑥+3=−3 ( 𝑥 −1) −2 1 2 𝑥+3=−3 𝑥+1 2=−3.5 𝑥 − 4 7 =𝑥 Finding the second solution (on the reflected part of the graph) Expand bracket and simplify Subtract 1, subtract Divide by 2.5 𝑥=3.2
  • 64.
    Functions and Graphs Youneed to be able to solve problems involving moduli as well as graph transformations The function is defined by: A sketch of the graph is shown. a) State the range of b) Explain why does not exist c) Solve the inequality 2G 𝑦 𝑥 𝑓 (𝑥 )=6 −2|𝑥 +3| 6 0 Since the modulus part is positive, we are always going to be taking away a value which is greater than or equal to 0  Therefore the largest value for is 6  So the range is , 6 Range
  • 65.
    Functions and Graphs Youneed to be able to solve problems involving moduli as well as graph transformations The function is defined by: A sketch of the graph is shown. a) State the range of b) Explain why does not exist c) Solve the inequality 2G 𝑦 𝑥 𝑓 (𝑥 )=6 −2|𝑥 +3| 6 0 This function is many-to-one, as different inputs can give the same output The inverse would be one-to-many, which is not a function 6
  • 66.
    Functions and Graphs Youneed to be able to solve problems involving moduli as well as graph transformations The function is defined by: A sketch of the graph is shown. a) State the range of b) Explain why does not exist c) Solve the inequality 2G 𝑦 𝑥 𝑓 (𝑥 )=6 −2|𝑥 +3| 6 0 6 𝑓 (𝑥 )=5 6 − 2 (𝑥 +3 )=5 6 − 2𝑥− 6=5 −2 𝑥=5 𝑥=−2.5 Solving for the non-reflected part Expand bracket Simplify Divide by 2 −2.5
  • 67.
    Functions and Graphs Youneed to be able to solve problems involving moduli as well as graph transformations The function is defined by: A sketch of the graph is shown. a) State the range of b) Explain why does not exist c) Solve the inequality 2G 𝑦 𝑥 𝑓 (𝑥 )=6 −2|𝑥 +3| 6 0 6 𝑓 (𝑥 )=5 6 +2 (𝑥 +3 )=5 6 +2 𝑥 +6=5 2 𝑥=−7 𝑥=−3.5 Solving for the reflected part Expand bracket Rearrange Divide by 2 −2.5 −3.5
  • 68.
    Functions and Graphs Youneed to be able to solve problems involving moduli as well as graph transformations The function is defined by: A sketch of the graph is shown. a) State the range of b) Explain why does not exist c) Solve the inequality 2G 𝑦 𝑥 𝑓 (𝑥 )=6 −2|𝑥 +3| 6 0 6 𝑓 (𝑥 )=5 For −2.5 −3.5