Downloaded 106 times

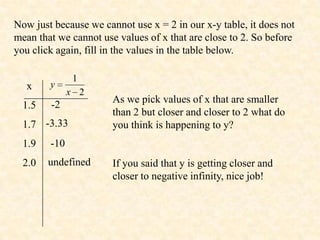
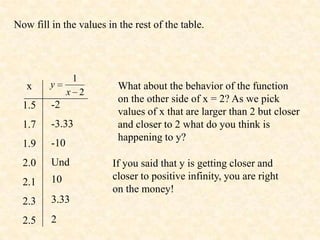
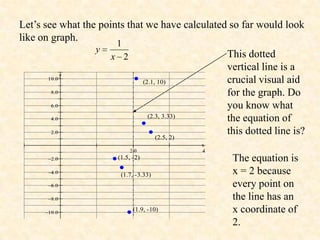
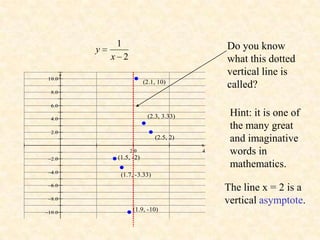
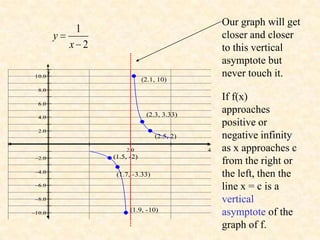

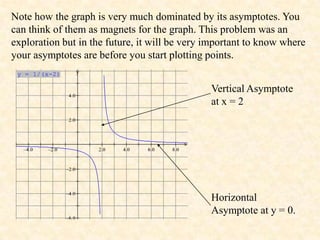


1. The rational function f(x) = 1/x^2 has a vertical asymptote at x = 2 because the denominator is 0 at that point. 2. As x values approach 2 from either side, y values approach positive or negative infinity, respectively. 3. The graph gets closer and closer to the vertical line x = 2 but never touches it. This line is called a vertical asymptote. 4. The graph also has a horizontal asymptote at y = 0, as y values approach 0 as x values increase or decrease indefinitely.