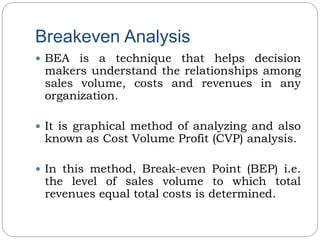
This document defines key concepts related to costs in economics. It discusses different types of costs businesses face, including fixed costs that do not vary with production and variable costs that change with output levels. The document also explains break-even analysis, which is a technique that determines the sales volume needed for total revenue to equal total costs. It involves graphing total revenue, total costs, and fixed costs lines to find the break-even point. The summary defines several terms used in break-even analysis, like contribution, margin of safety, and profit-volume ratio.
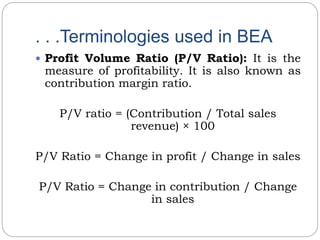
![. . .Terminologies used in BEA. . .
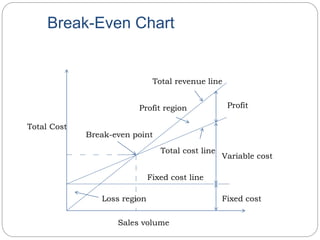
The point at which total cost line and total
revenue line intersect is known as break-even
point.
Break-even Point in terms of sales value
(Rs.):
BEP(Rs.) = [Total fixed cost / (Total revenue –
Total variable cost)] × Selling price
Break-even Point in terms of quantity
(units):
BEP(units) = [Total fixed cost / (Selling price per
unit - Variable cost per unit)]](https://image.slidesharecdn.com/theoryofcost-160116081028/85/Theoryofcost-21-320.jpg)
![. . .Terminologies used in BEA. .
.
Angle of incidence (ϴ): It is the angle at which
total revenue line intersects the total cost line.
Large angle of incidence means higher profits.
Small angle of incidence means less profits are
being made at less favorable conditions.
Contribution: It is the difference between the
selling price per unit and variable cost per unit.
Contribution = [Selling price per unit – Variable cost
per unit]
OR
Contribution = [Fixed cost per unit + Profit per unit]](https://image.slidesharecdn.com/theoryofcost-160116081028/85/Theoryofcost-23-320.jpg)