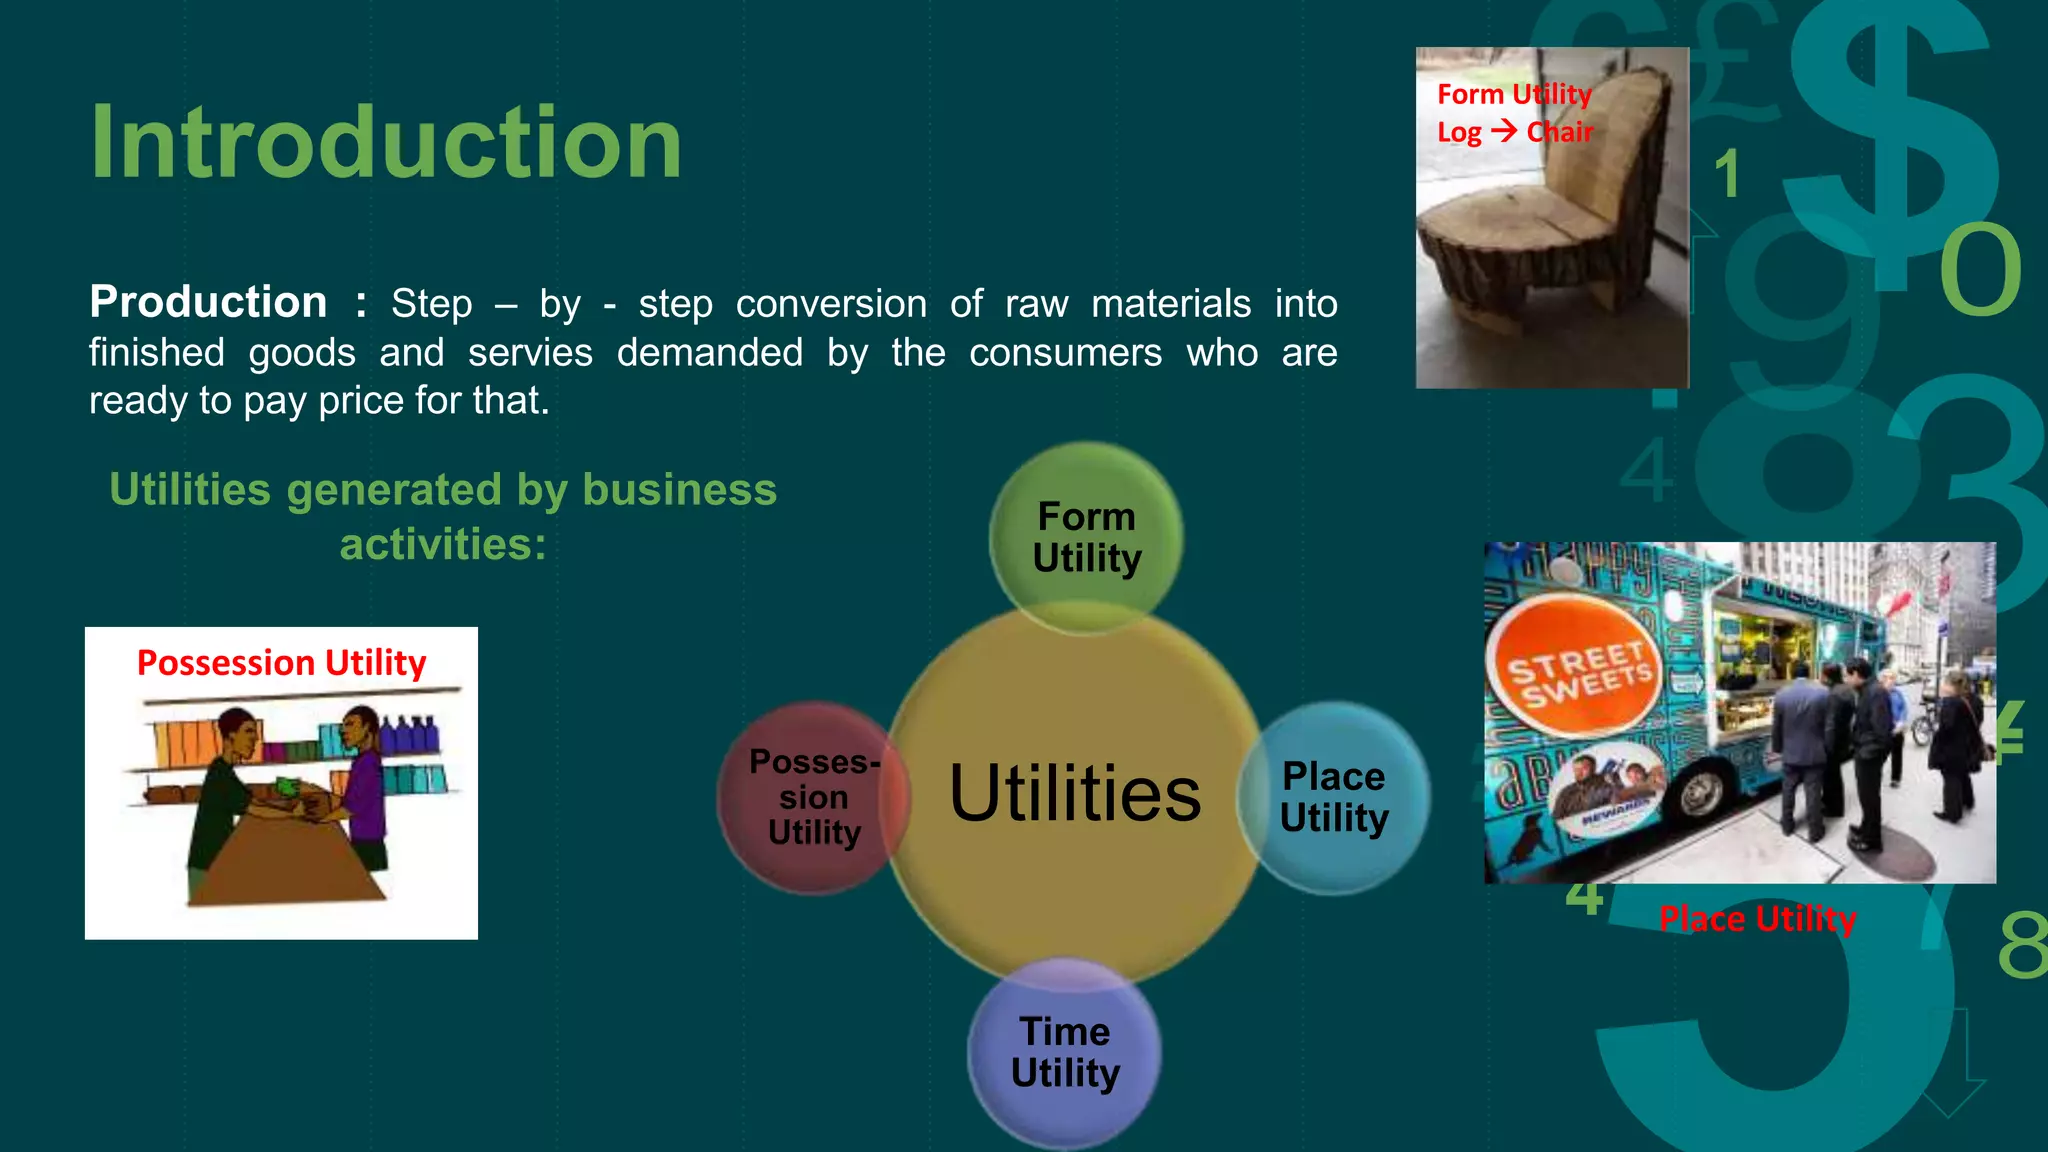
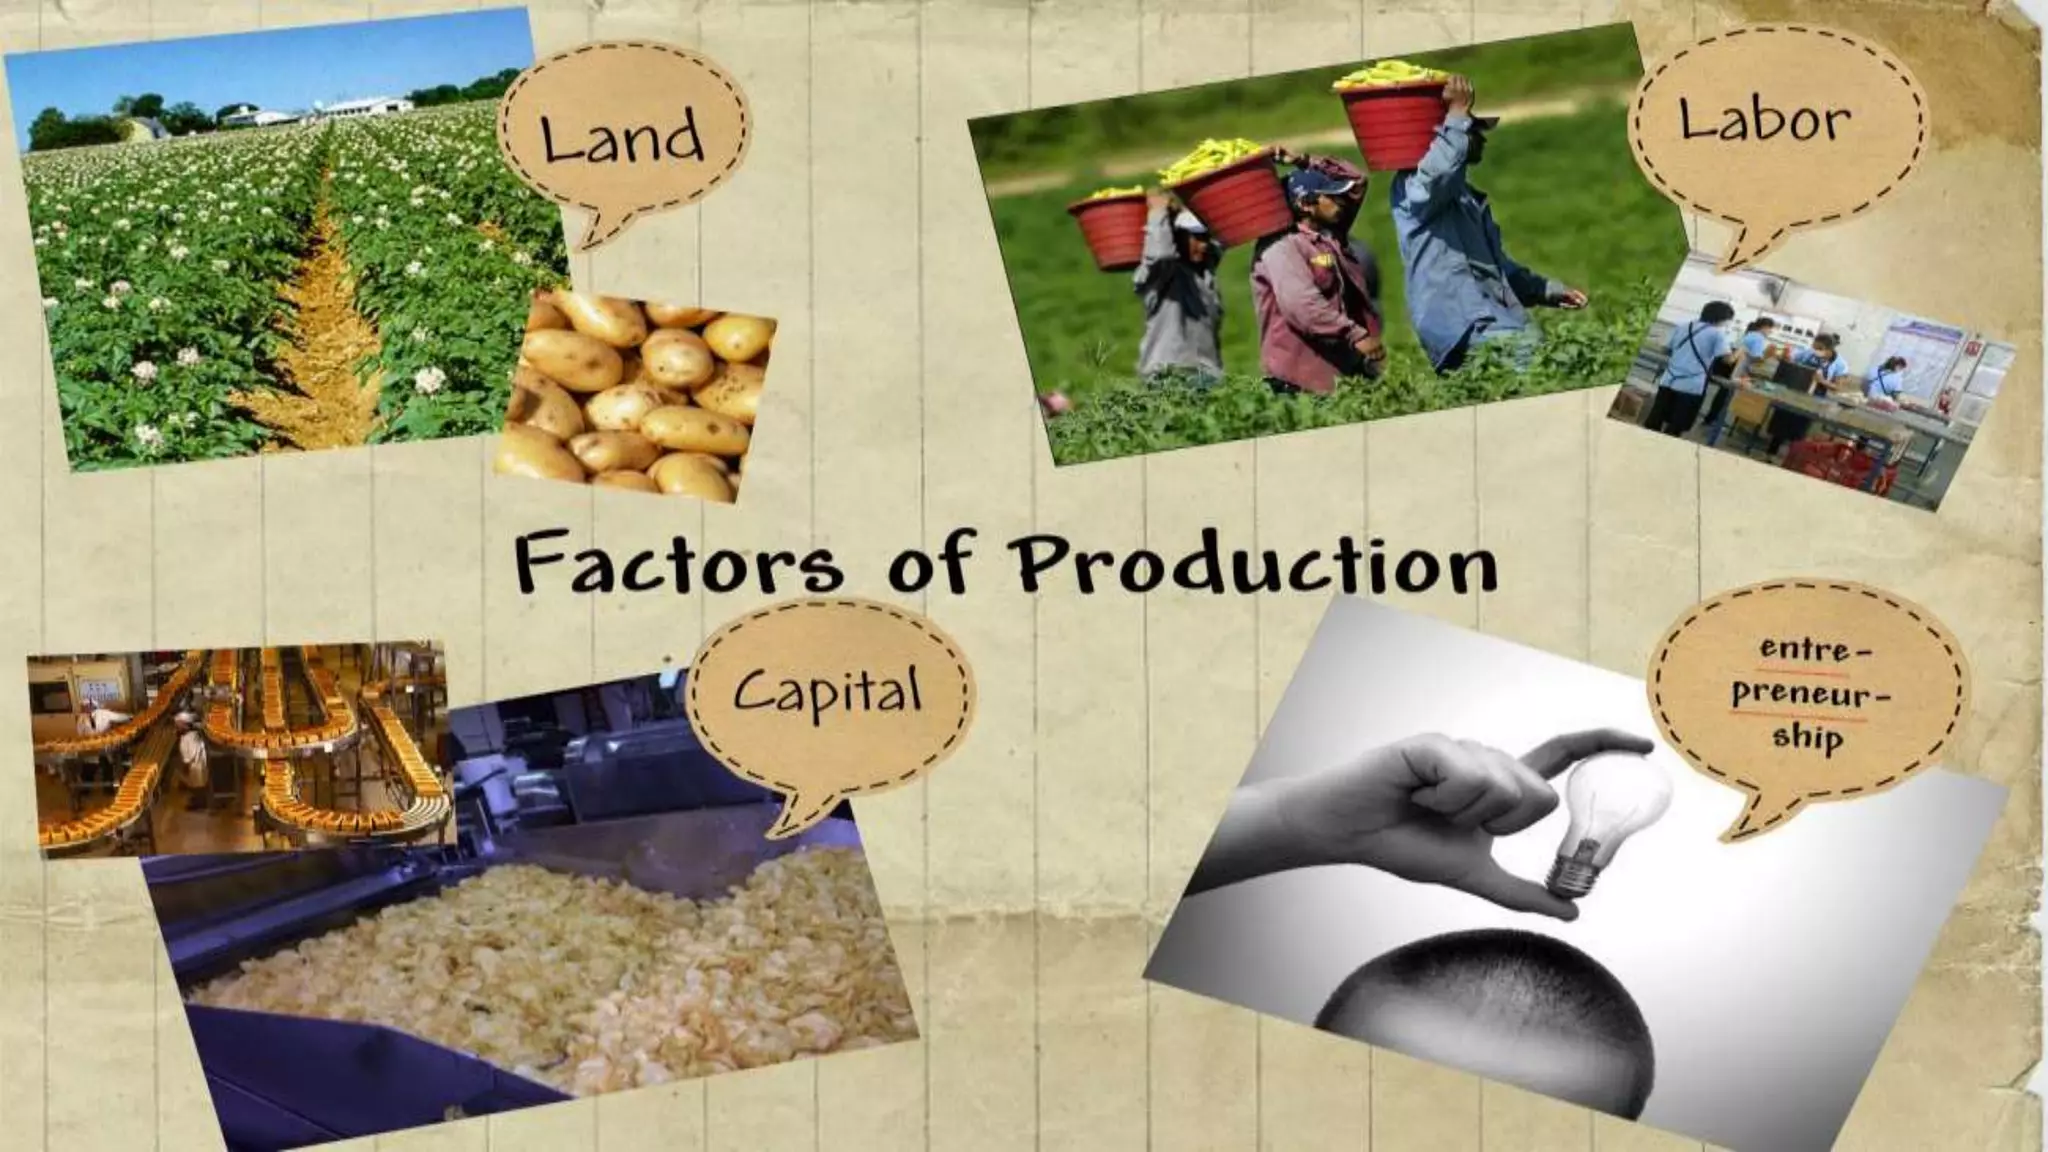
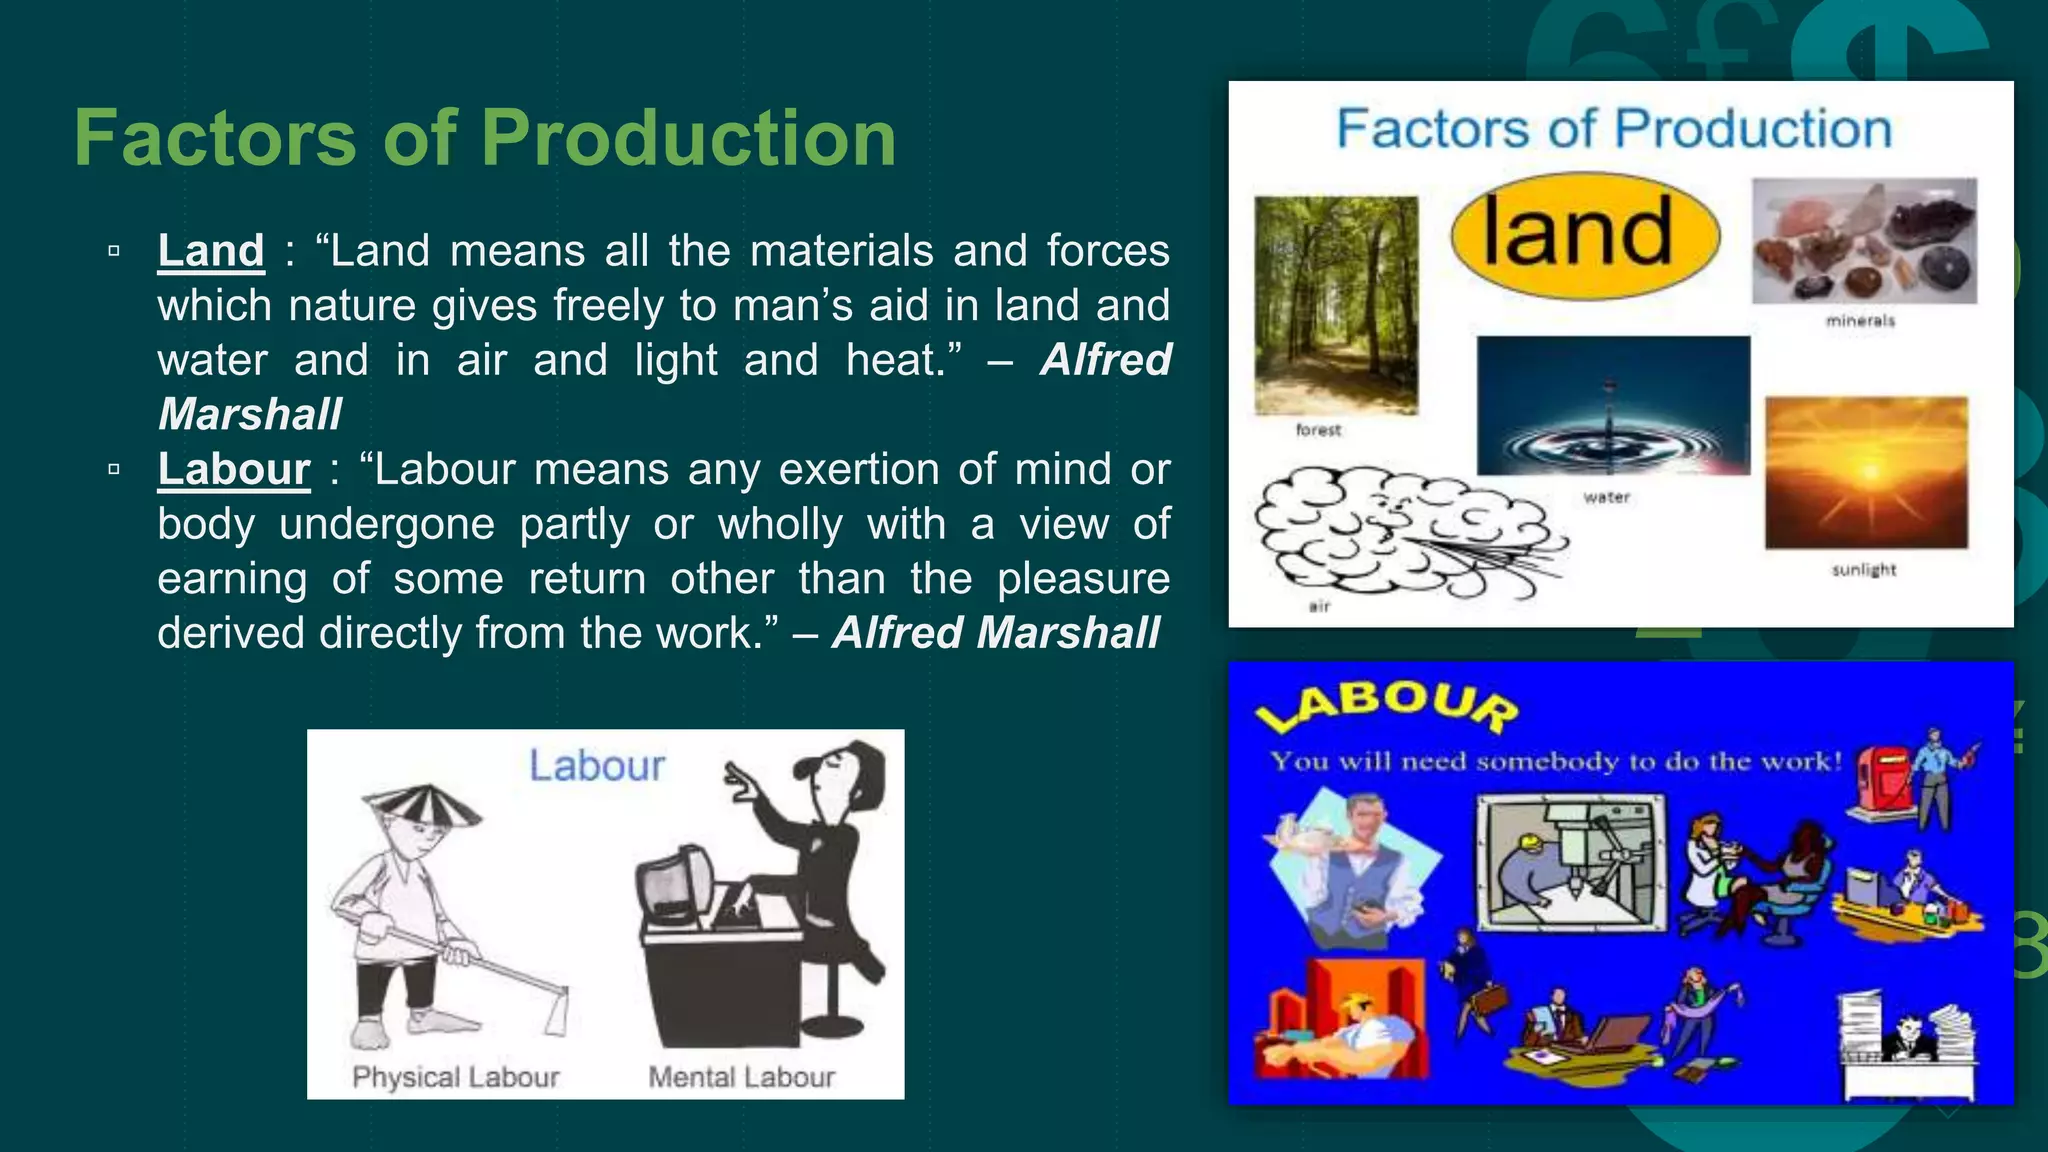
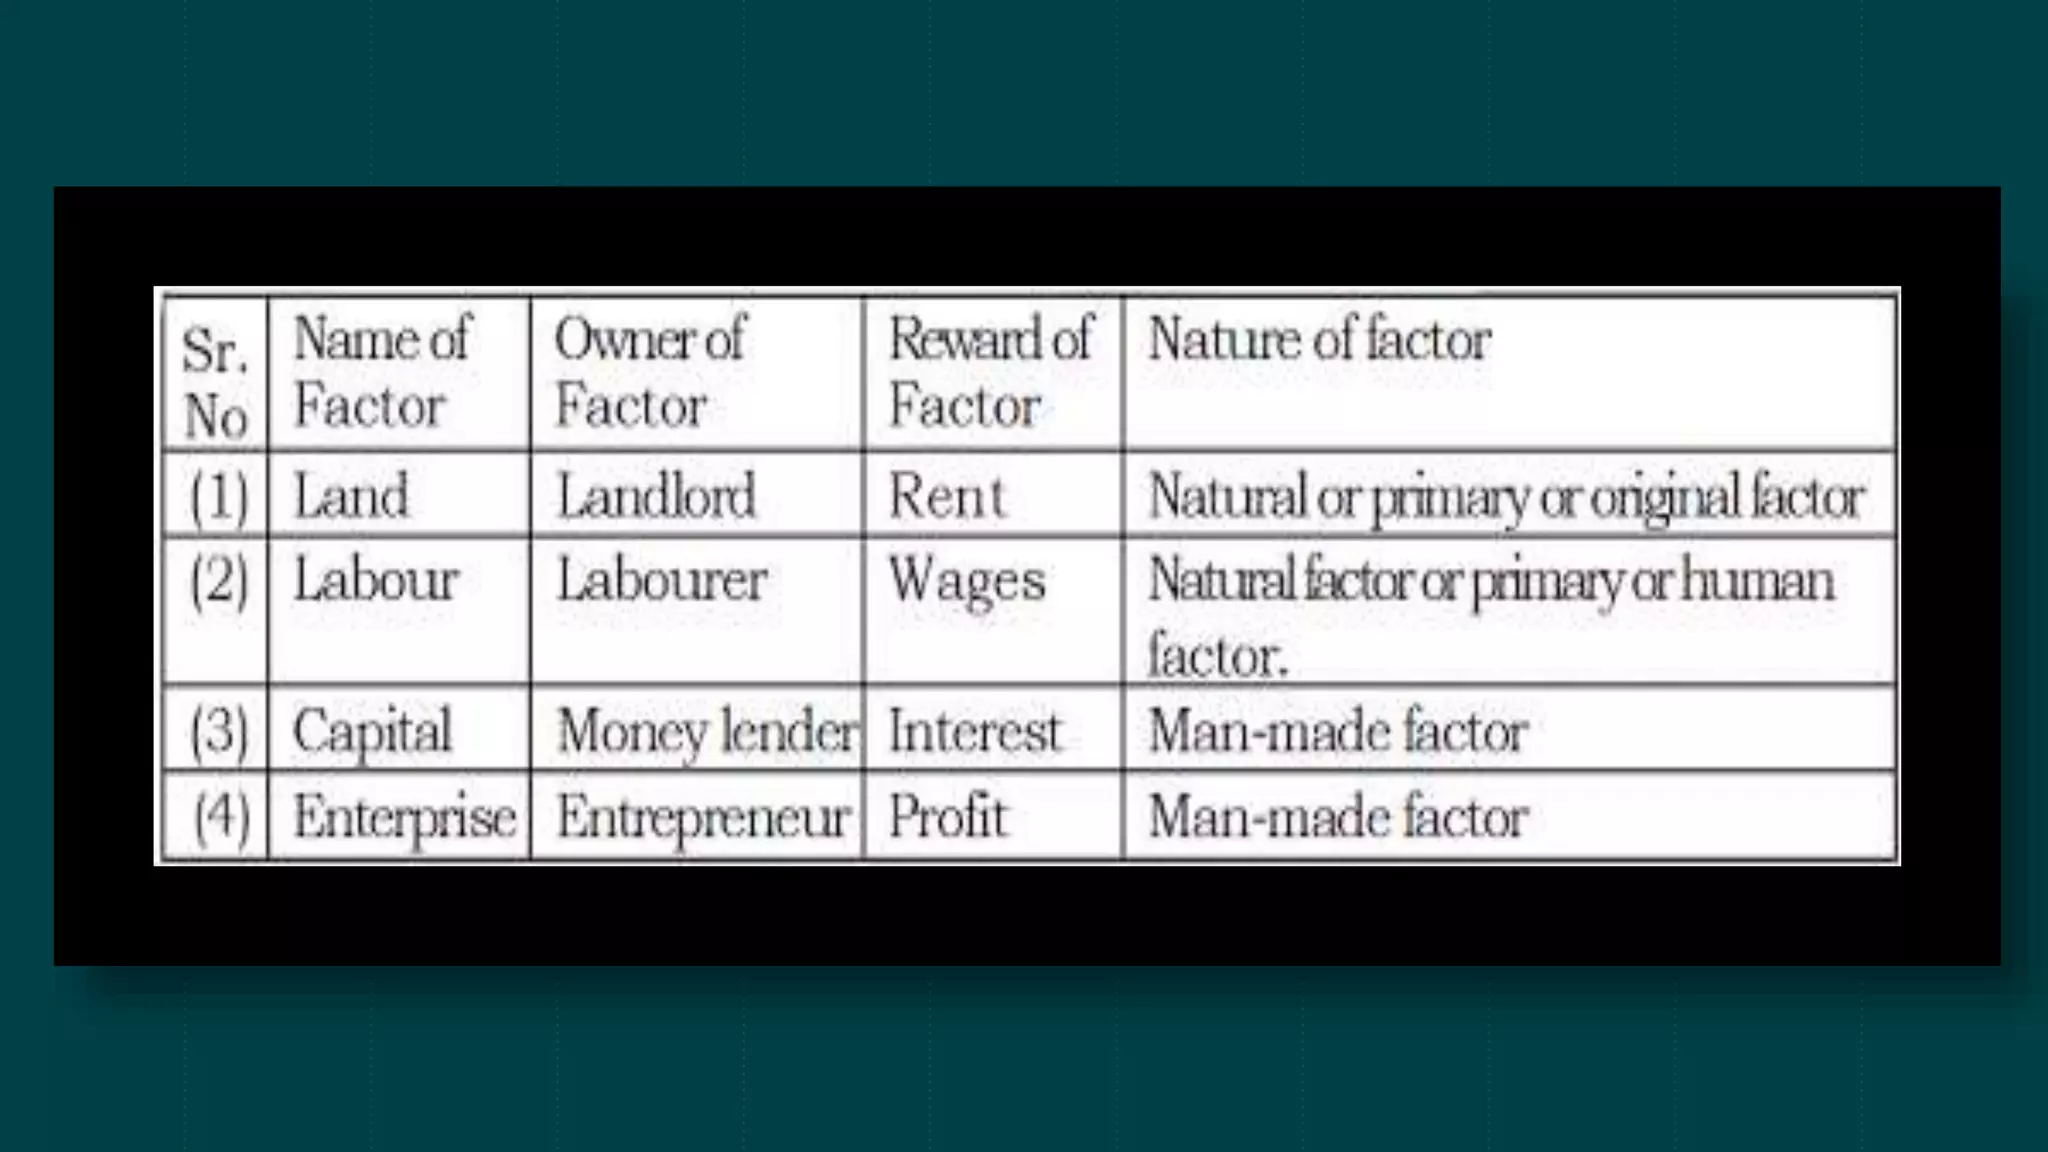
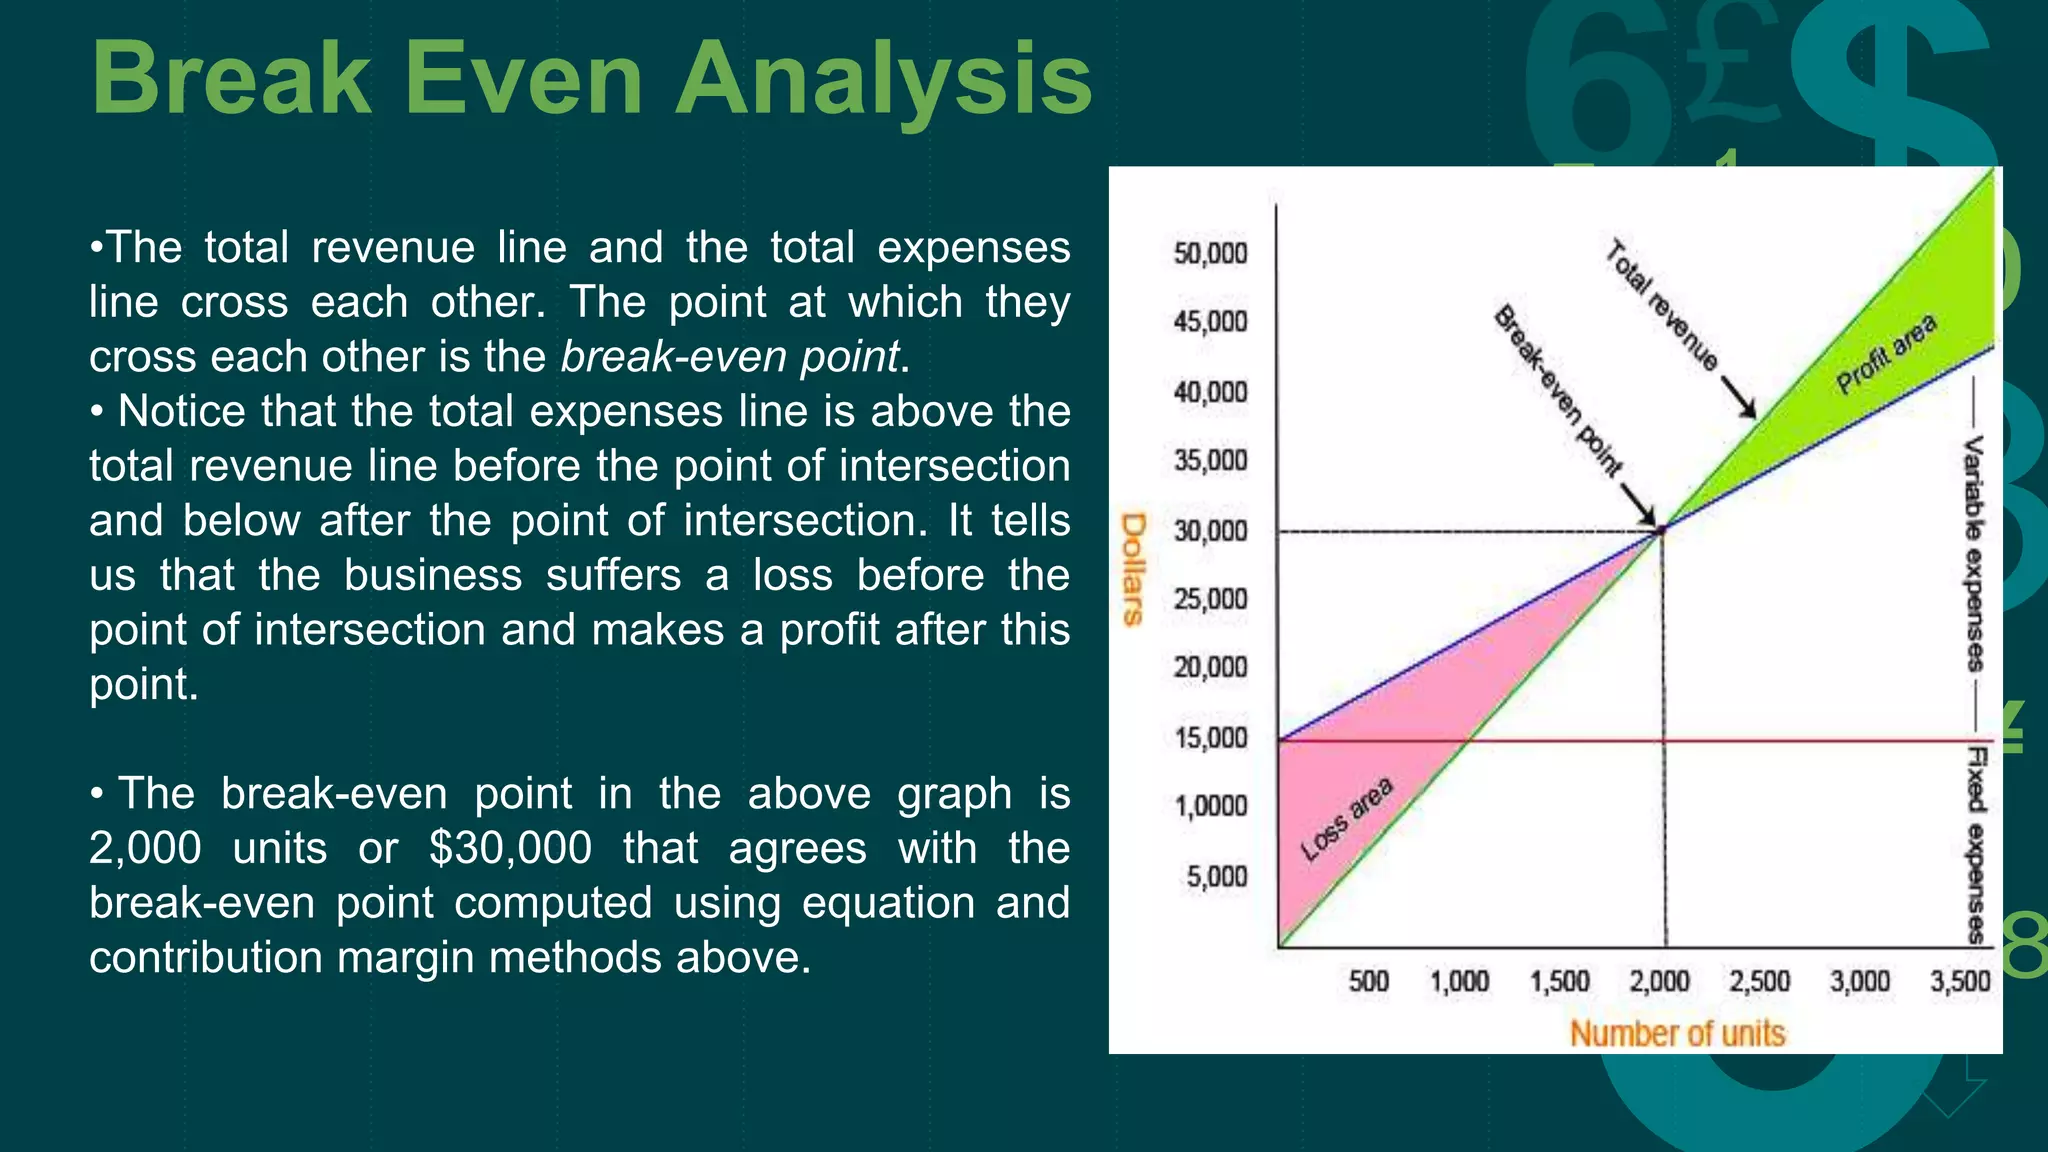
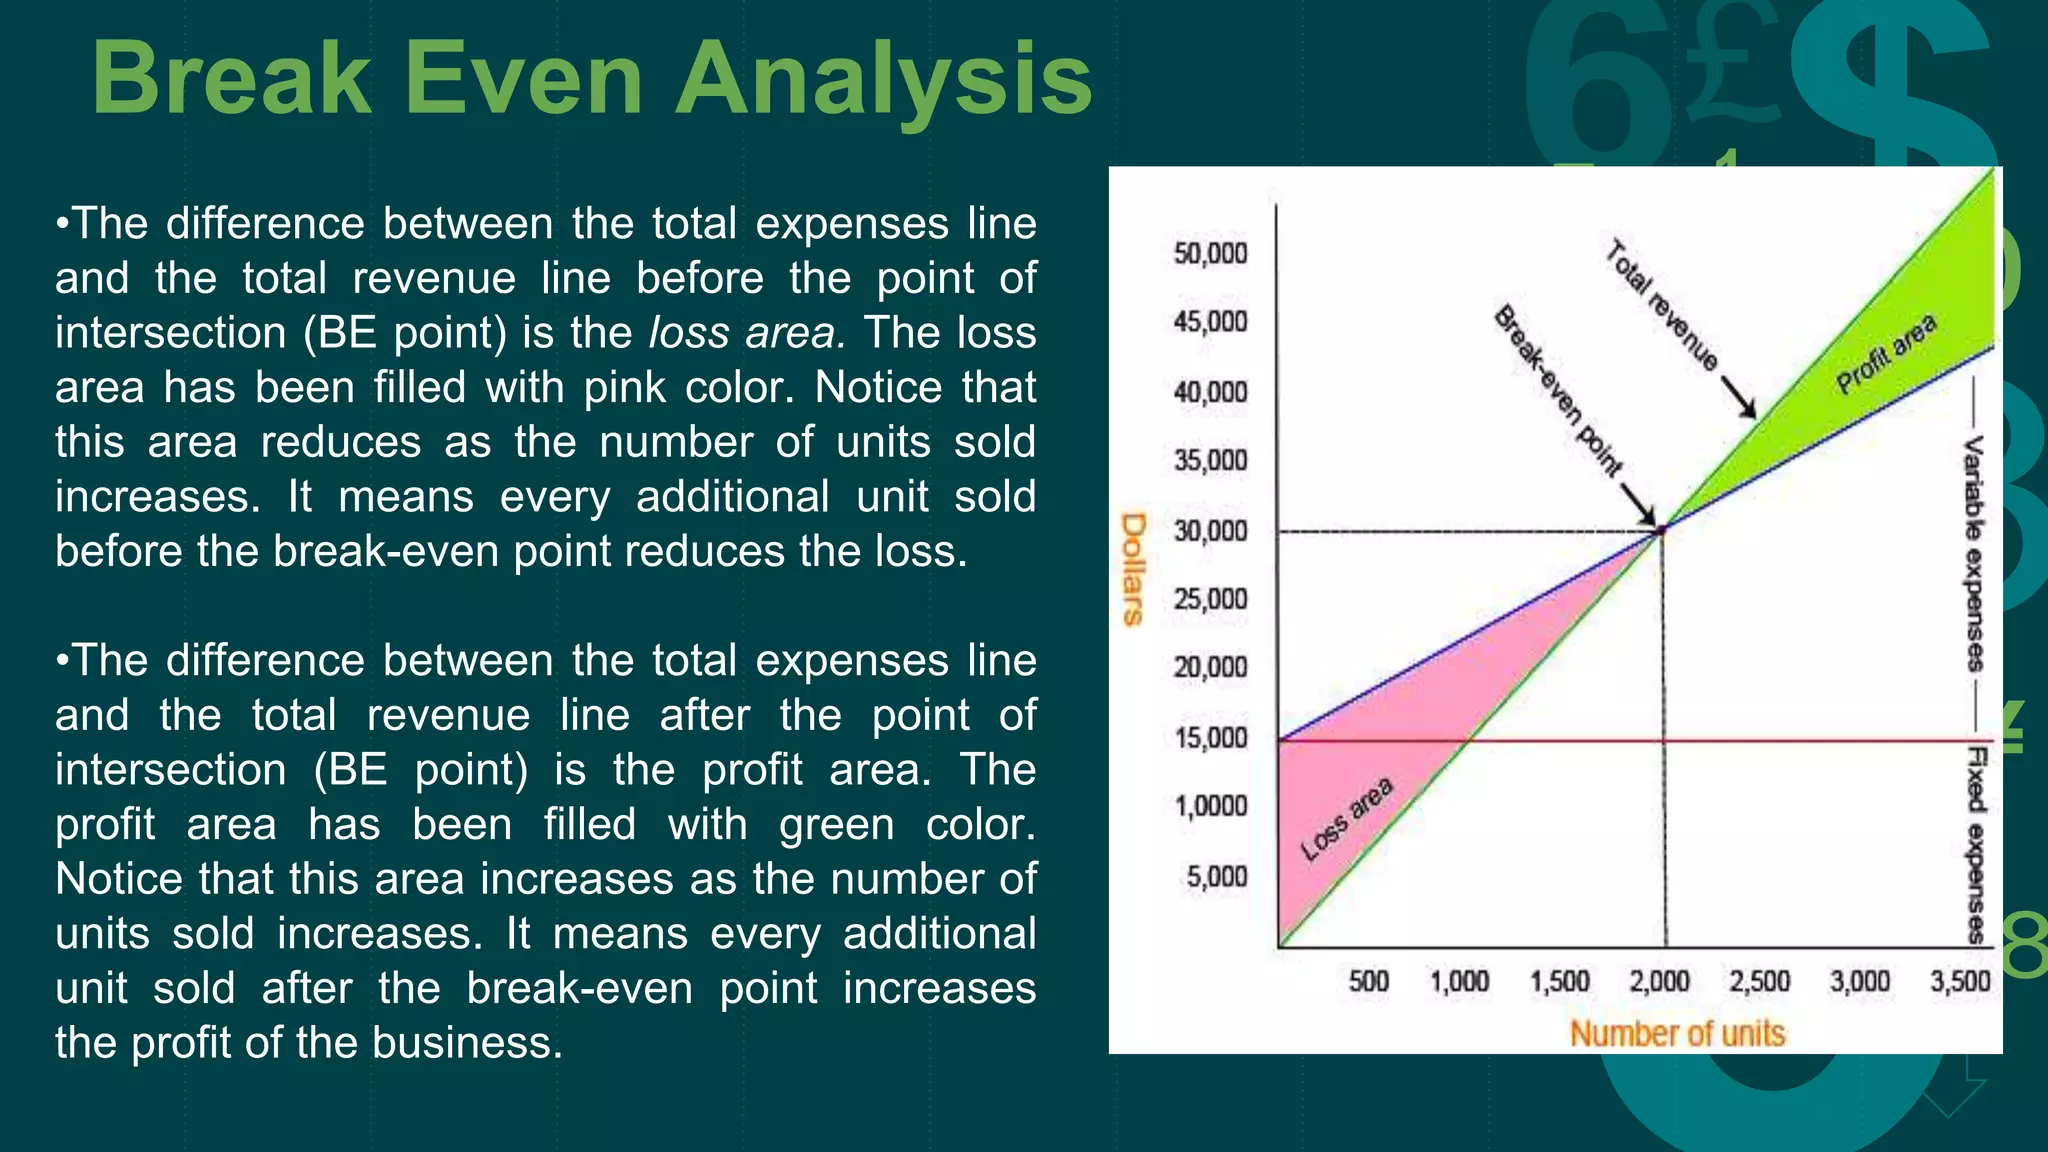
THEORY OF
PRODUCTION
&
COST AND COST
CONCEPTS
Prepared By:
Aakash Singh
Mechanical – 2
Batch – C
150410119112
Theory Of Production
1. Introduction to Theory
of Production
2. Factors of Production
Content
Cost & Cost Concepts
1. Introduction
2. Cost Concepts
3. Break Even Analysis
Theory Of
Production
Introduction
Production : Step – by - step conversion of raw materials into
finished goods and servies demanded by the consumers who are
ready to pay price for that.
Utilities generated by business
activities:
Utilities
Form
Utility
Place
Utility
Time
Utility
Posses-
sion
Utility
Form Utility
Log  Chair
Place Utility
Possession Utility
Factors of Production
Factors of
Production
Land
Labour
Capital
Entrepreneur
Factors of Production
▫ Land : “Land means all the materials and forces
which nature gives freely to man’s aid in land and
water and in air and light and heat.” – Alfred
Marshall
▫ Labour : “Labour means any exertion of mind or
body undergone partly or wholly with a view of
earning of some return other than the pleasure
derived directly from the work.” – Alfred Marshall
Factors of Production
▫ Capital : “Refers to stock of assets at a particular
point time which is used to generate a stream of
income over the life span of the business.”
[OR]
▫ “Capital represents the total capitalization of a
business represented by owner’s equity funds and
outside debt funds.”
▫ Entrepreneur : “An entrepreuner is an economic
agent who unites all the means of production.” –
J.B. Say
[OR]
▫ “An entrepreneur is a person who assumes risk of
mobilizing resources for the wealth generation.”
Cost
&
Cost Concepts
Introduction
Cost signifies sacrifice of resources with a view to
generate some value resulting into some economic
benefits.
Economic cost is the combination of gains and losses
of any goods that have a value attached to them by
any one individual.
Economic cost is used mainly by economists
as means to compare the prudence of one course of
action with that of another.
Various Cost Concepts
Costs are classified as under:
1. Short-run costs : They have a short-term tenure, usually up to
one year. Costs incurred on materials , operating expenses
like cost of labour and utilities like power, water, etc., are
known as Short-term costs.
2. Long-run costs : These are costs whose benefits tenure
extend for a long time in future. The costs incurred on
research and development and training of employees are
examples of long-run costs.
3. Fixed costs : Fixed costs remain fixed as per unit of time
rather than volume of production. Such costs remain fixed
irrespective of volume of production. Depreciation on
machines, salary, interest on borrowings, etc., are fixed costs.
Various Cost Concepts
4. Variable cost : Those costs which vary with the volume of
production are variable costs. Costs of materials, direct labour,
power consumption costs, etc., are variable costs.
5. Total cost : It is the sum of total fixed costs and total variable
costs.
6. Average costs : It indicates the per unit costs at diferent levels of
production activities.
7. Marginal cost : It is defined as the change in total costs with one
unit increase or decrease in the current quantity produced.
8. Opportunity cost : A benefit, profit, or value of something that must
be given up to acquire or achieve something else is called
opportunity cost.
9. Implicit cost : An implicit cost is any cost that has already occurred
but is not necessarily shown or reported as a separate expense.
10. Sunk cost : The cash outflows incurred currently which cannot be
reversed at later stage. The government stamp duty or registration
fee, etc are sunk cost.
Break Even Analysis
Break Even Analysis
• The Break – Even Analysis is based on the
cost behaviour pattern to the level of
production.
• The term break-even analysis primarily refers
to breaking the business event evenly i.e.
equally into two parts. The business events are
profit and losses.
• So, the break-even analysis deals with that
production level which results into a no-profit,
no-loss situation.
Break Even Analysis
Assumptions
• The total costs may be classified into fixed and variable costs. It ignores semi-
variable cost.
• The cost and revenue functions remain linear.
• The price of the product is assumed to be constant.
• The volume of sales and volume of production are equal.
• The fixed costs remain constant over the volume under consideration.
• It assumes constant rate of increase in variable cost.
• It assumes constant technology and no improvement in labour efficiency.
• The price of the product is assumed to be constant.
• The factor price remains unaltered.
• Changes in input prices are ruled out.
• In the case of multi-product firm, the product mix is stable.
Break Even Analysis
• The number of units have been presented on
the X-axis (horizontally) where as dollars have
been presented on Y-axis (vertically).
•The straight line in red color represents the total
annual fixed expenses of $15,000.
• The blue line represents the total expenses.
Notice that the line has a positive or upward slop
that indicates the effect of increasing variable
expenses with the increase in production.
• The green line with positive or upward slop
indicates that every unit sold increases the total
sales revenue.
Break Even Analysis
•The total revenue line and the total expenses
line cross each other. The point at which they
cross each other is the break-even point.
• Notice that the total expenses line is above the
total revenue line before the point of intersection
and below after the point of intersection. It tells
us that the business suffers a loss before the
point of intersection and makes a profit after this
point.
• The break-even point in the above graph is
2,000 units or $30,000 that agrees with the
break-even point computed using equation and
contribution margin methods above.
Break Even Analysis
•The difference between the total expenses line
and the total revenue line before the point of
intersection (BE point) is the loss area. The loss
area has been filled with pink color. Notice that
this area reduces as the number of units sold
increases. It means every additional unit sold
before the break-even point reduces the loss.
•The difference between the total expenses line
and the total revenue line after the point of
intersection (BE point) is the profit area. The
profit area has been filled with green color.
Notice that this area increases as the number of
units sold increases. It means every additional
unit sold after the break-even point increases
the profit of the business.
Break Even Analysis
Limitations
• Break-even analysis is only a supply-side (i.e., costs only) analysis,
as it tells you nothing about what sales are actually likely to be for the
product at these various prices.
• It assumes that fixed costs are constant. Although this is true in the
short run, an increase in the scale of production is likely to cause
fixed costs to rise.
• It assumes average variable costs are constant per unit of output, at
least in the range of likely quantities of sales. (i.e., linearity).
• It assumes that the quantity of goods produced is equal to the
quantity of goods sold (i.e., there is no change in the quantity of
goods held in inventory at the beginning of the period and the
quantity of goods held in inventory at the end of the period).
• In multi-product companies, it assumes that the relative proportions
of each product sold and produced are constant (i.e., the sales mix is
constant).
Thanks!

Theory of Production and Costs & Cost Concepts

  • 1.
  • 2.
    Prepared By: Aakash Singh Mechanical– 2 Batch – C 150410119112
  • 3.
    Theory Of Production 1.Introduction to Theory of Production 2. Factors of Production Content Cost & Cost Concepts 1. Introduction 2. Cost Concepts 3. Break Even Analysis
  • 4.
  • 5.
    Introduction Production : Step– by - step conversion of raw materials into finished goods and servies demanded by the consumers who are ready to pay price for that. Utilities generated by business activities: Utilities Form Utility Place Utility Time Utility Posses- sion Utility Form Utility Log  Chair Place Utility Possession Utility
  • 6.
    Factors of Production Factorsof Production Land Labour Capital Entrepreneur
  • 7.
    Factors of Production ▫Land : “Land means all the materials and forces which nature gives freely to man’s aid in land and water and in air and light and heat.” – Alfred Marshall ▫ Labour : “Labour means any exertion of mind or body undergone partly or wholly with a view of earning of some return other than the pleasure derived directly from the work.” – Alfred Marshall
  • 8.
    Factors of Production ▫Capital : “Refers to stock of assets at a particular point time which is used to generate a stream of income over the life span of the business.” [OR] ▫ “Capital represents the total capitalization of a business represented by owner’s equity funds and outside debt funds.” ▫ Entrepreneur : “An entrepreuner is an economic agent who unites all the means of production.” – J.B. Say [OR] ▫ “An entrepreneur is a person who assumes risk of mobilizing resources for the wealth generation.”
  • 10.
  • 11.
    Introduction Cost signifies sacrificeof resources with a view to generate some value resulting into some economic benefits. Economic cost is the combination of gains and losses of any goods that have a value attached to them by any one individual. Economic cost is used mainly by economists as means to compare the prudence of one course of action with that of another.
  • 12.
    Various Cost Concepts Costsare classified as under: 1. Short-run costs : They have a short-term tenure, usually up to one year. Costs incurred on materials , operating expenses like cost of labour and utilities like power, water, etc., are known as Short-term costs. 2. Long-run costs : These are costs whose benefits tenure extend for a long time in future. The costs incurred on research and development and training of employees are examples of long-run costs. 3. Fixed costs : Fixed costs remain fixed as per unit of time rather than volume of production. Such costs remain fixed irrespective of volume of production. Depreciation on machines, salary, interest on borrowings, etc., are fixed costs.
  • 13.
    Various Cost Concepts 4.Variable cost : Those costs which vary with the volume of production are variable costs. Costs of materials, direct labour, power consumption costs, etc., are variable costs. 5. Total cost : It is the sum of total fixed costs and total variable costs. 6. Average costs : It indicates the per unit costs at diferent levels of production activities. 7. Marginal cost : It is defined as the change in total costs with one unit increase or decrease in the current quantity produced. 8. Opportunity cost : A benefit, profit, or value of something that must be given up to acquire or achieve something else is called opportunity cost. 9. Implicit cost : An implicit cost is any cost that has already occurred but is not necessarily shown or reported as a separate expense. 10. Sunk cost : The cash outflows incurred currently which cannot be reversed at later stage. The government stamp duty or registration fee, etc are sunk cost.
  • 14.
  • 15.
    Break Even Analysis •The Break – Even Analysis is based on the cost behaviour pattern to the level of production. • The term break-even analysis primarily refers to breaking the business event evenly i.e. equally into two parts. The business events are profit and losses. • So, the break-even analysis deals with that production level which results into a no-profit, no-loss situation.
  • 16.
    Break Even Analysis Assumptions •The total costs may be classified into fixed and variable costs. It ignores semi- variable cost. • The cost and revenue functions remain linear. • The price of the product is assumed to be constant. • The volume of sales and volume of production are equal. • The fixed costs remain constant over the volume under consideration. • It assumes constant rate of increase in variable cost. • It assumes constant technology and no improvement in labour efficiency. • The price of the product is assumed to be constant. • The factor price remains unaltered. • Changes in input prices are ruled out. • In the case of multi-product firm, the product mix is stable.
  • 17.
    Break Even Analysis •The number of units have been presented on the X-axis (horizontally) where as dollars have been presented on Y-axis (vertically). •The straight line in red color represents the total annual fixed expenses of $15,000. • The blue line represents the total expenses. Notice that the line has a positive or upward slop that indicates the effect of increasing variable expenses with the increase in production. • The green line with positive or upward slop indicates that every unit sold increases the total sales revenue.
  • 18.
    Break Even Analysis •Thetotal revenue line and the total expenses line cross each other. The point at which they cross each other is the break-even point. • Notice that the total expenses line is above the total revenue line before the point of intersection and below after the point of intersection. It tells us that the business suffers a loss before the point of intersection and makes a profit after this point. • The break-even point in the above graph is 2,000 units or $30,000 that agrees with the break-even point computed using equation and contribution margin methods above.
  • 19.
    Break Even Analysis •Thedifference between the total expenses line and the total revenue line before the point of intersection (BE point) is the loss area. The loss area has been filled with pink color. Notice that this area reduces as the number of units sold increases. It means every additional unit sold before the break-even point reduces the loss. •The difference between the total expenses line and the total revenue line after the point of intersection (BE point) is the profit area. The profit area has been filled with green color. Notice that this area increases as the number of units sold increases. It means every additional unit sold after the break-even point increases the profit of the business.
  • 20.
    Break Even Analysis Limitations •Break-even analysis is only a supply-side (i.e., costs only) analysis, as it tells you nothing about what sales are actually likely to be for the product at these various prices. • It assumes that fixed costs are constant. Although this is true in the short run, an increase in the scale of production is likely to cause fixed costs to rise. • It assumes average variable costs are constant per unit of output, at least in the range of likely quantities of sales. (i.e., linearity). • It assumes that the quantity of goods produced is equal to the quantity of goods sold (i.e., there is no change in the quantity of goods held in inventory at the beginning of the period and the quantity of goods held in inventory at the end of the period). • In multi-product companies, it assumes that the relative proportions of each product sold and produced are constant (i.e., the sales mix is constant).
  • 21.