Downloaded 552 times

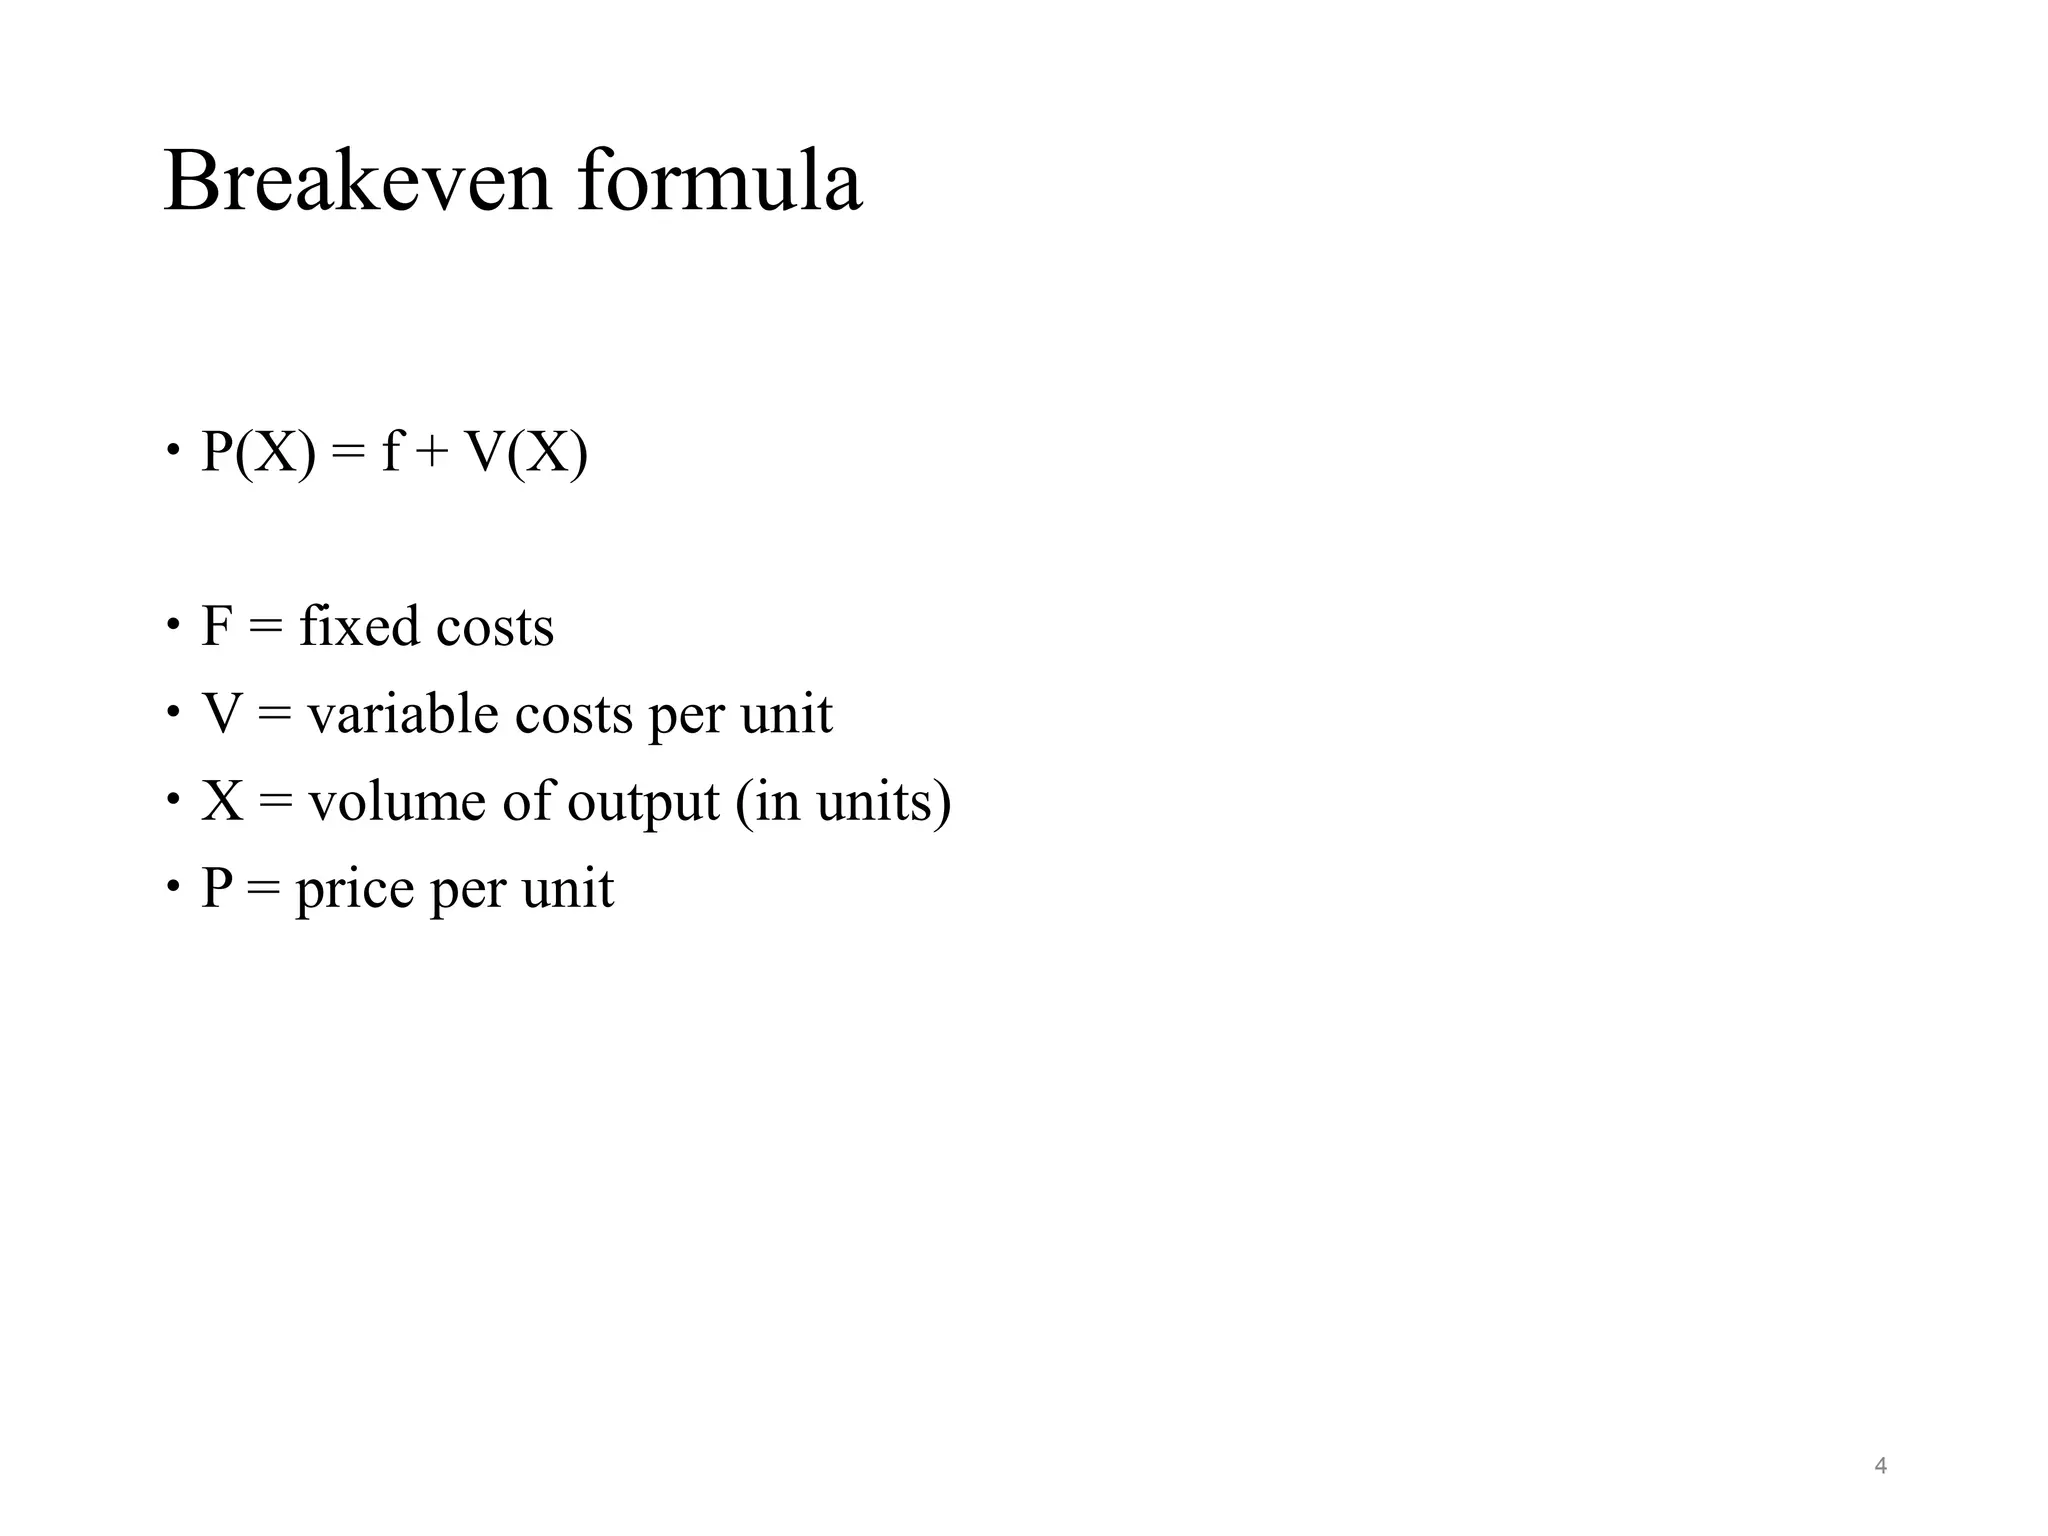
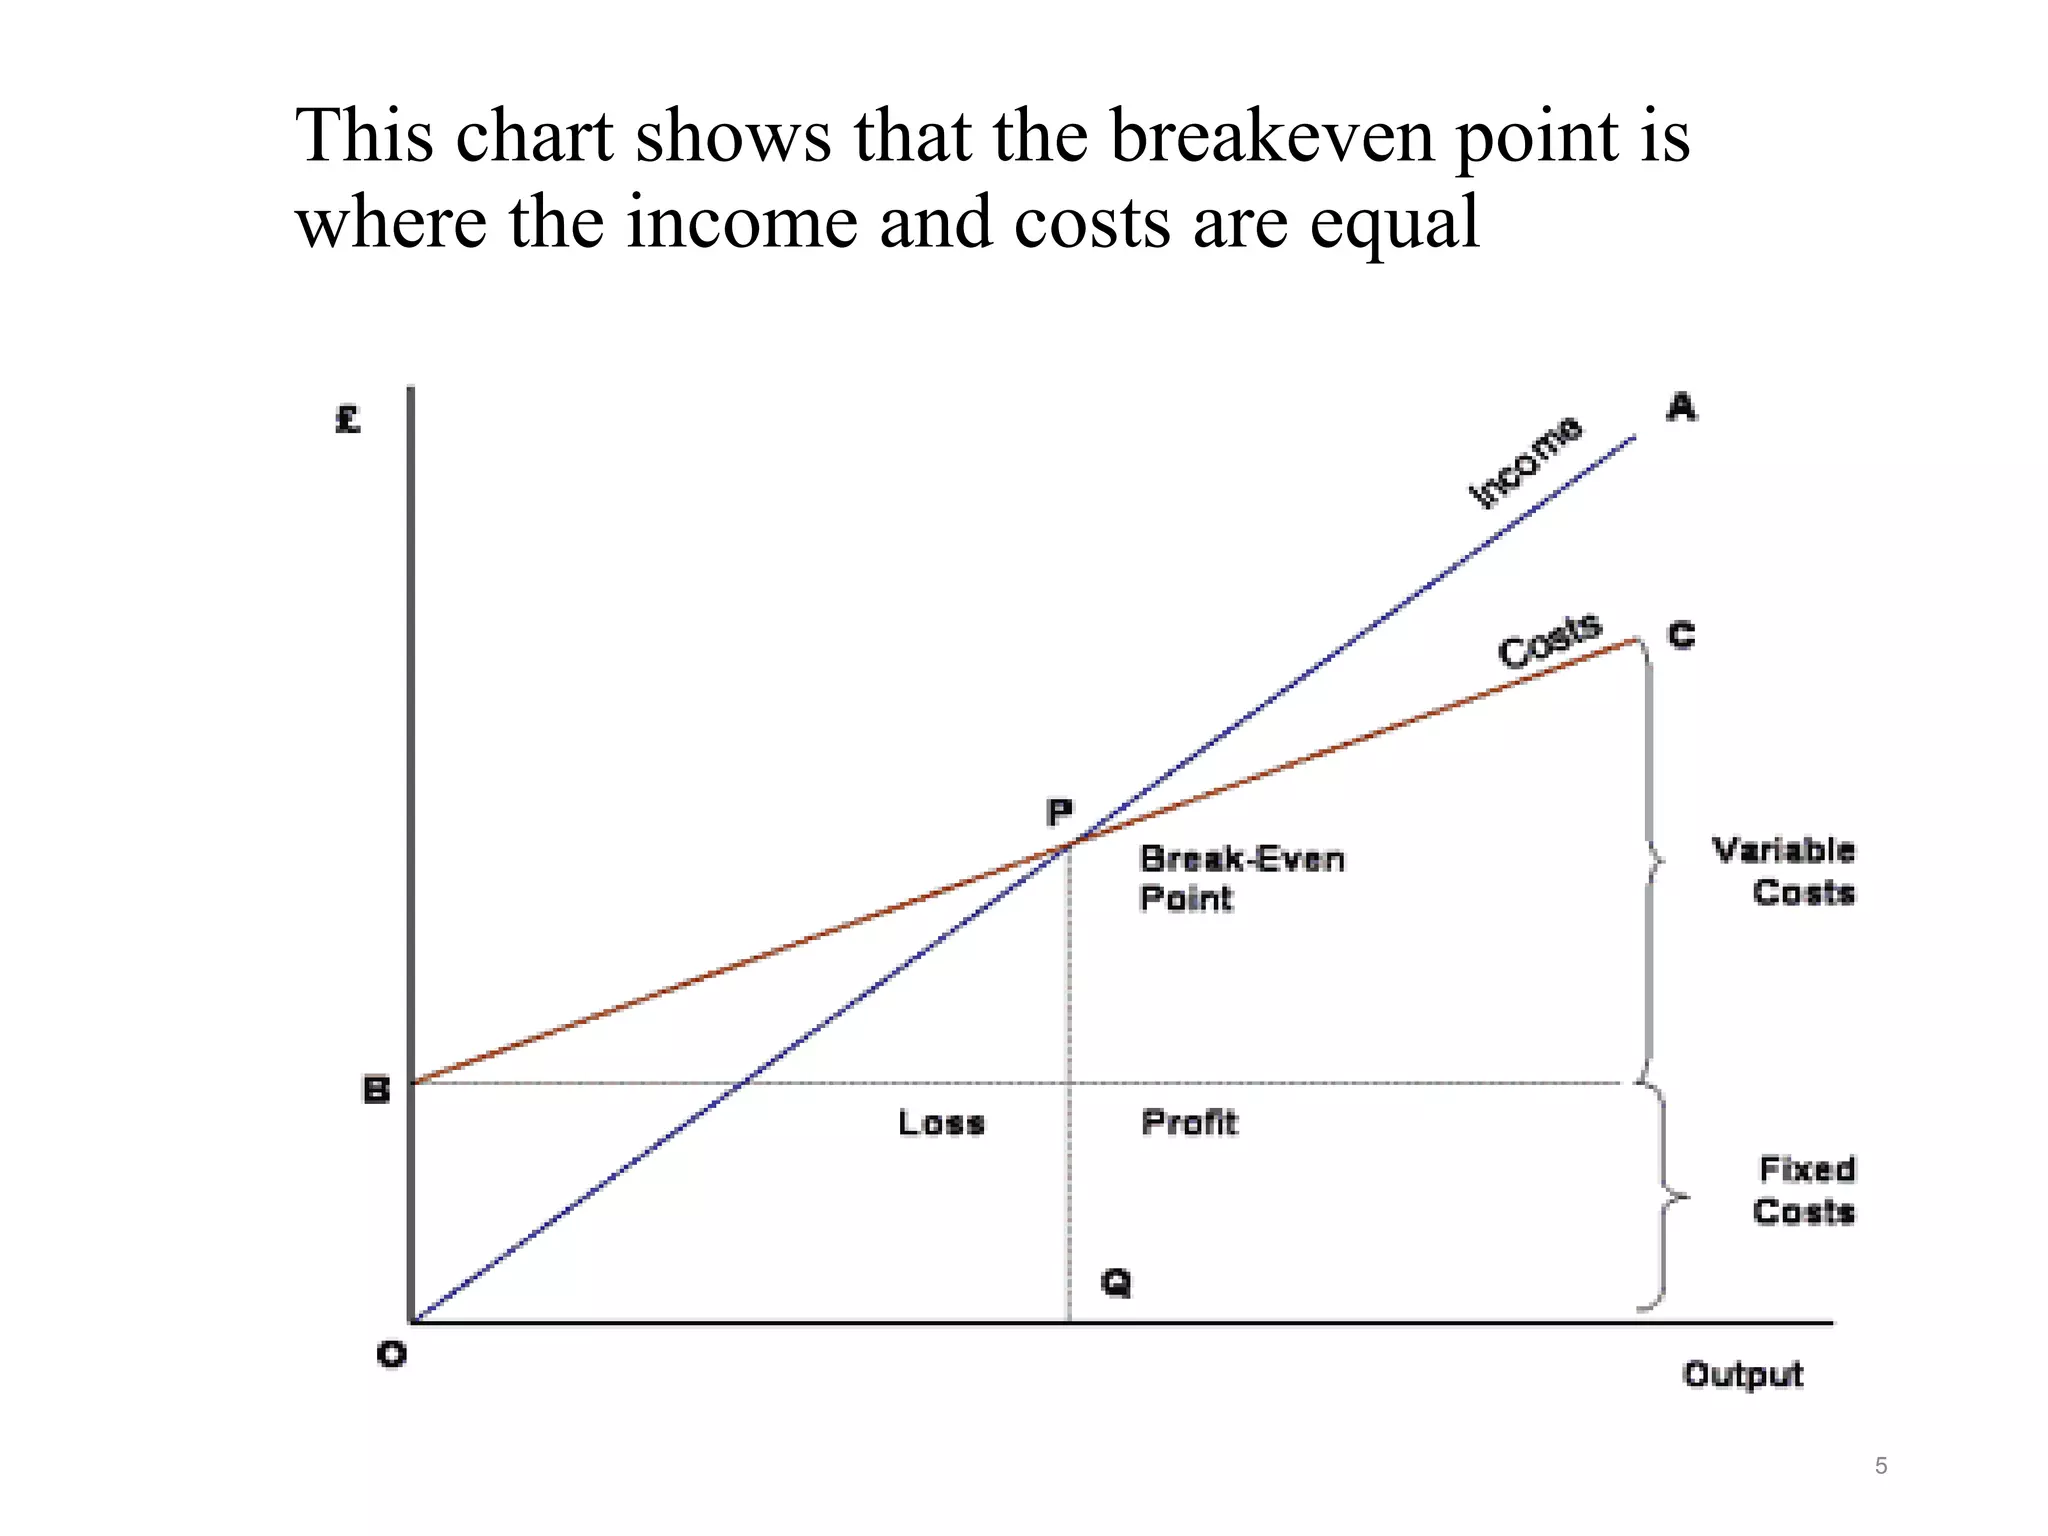


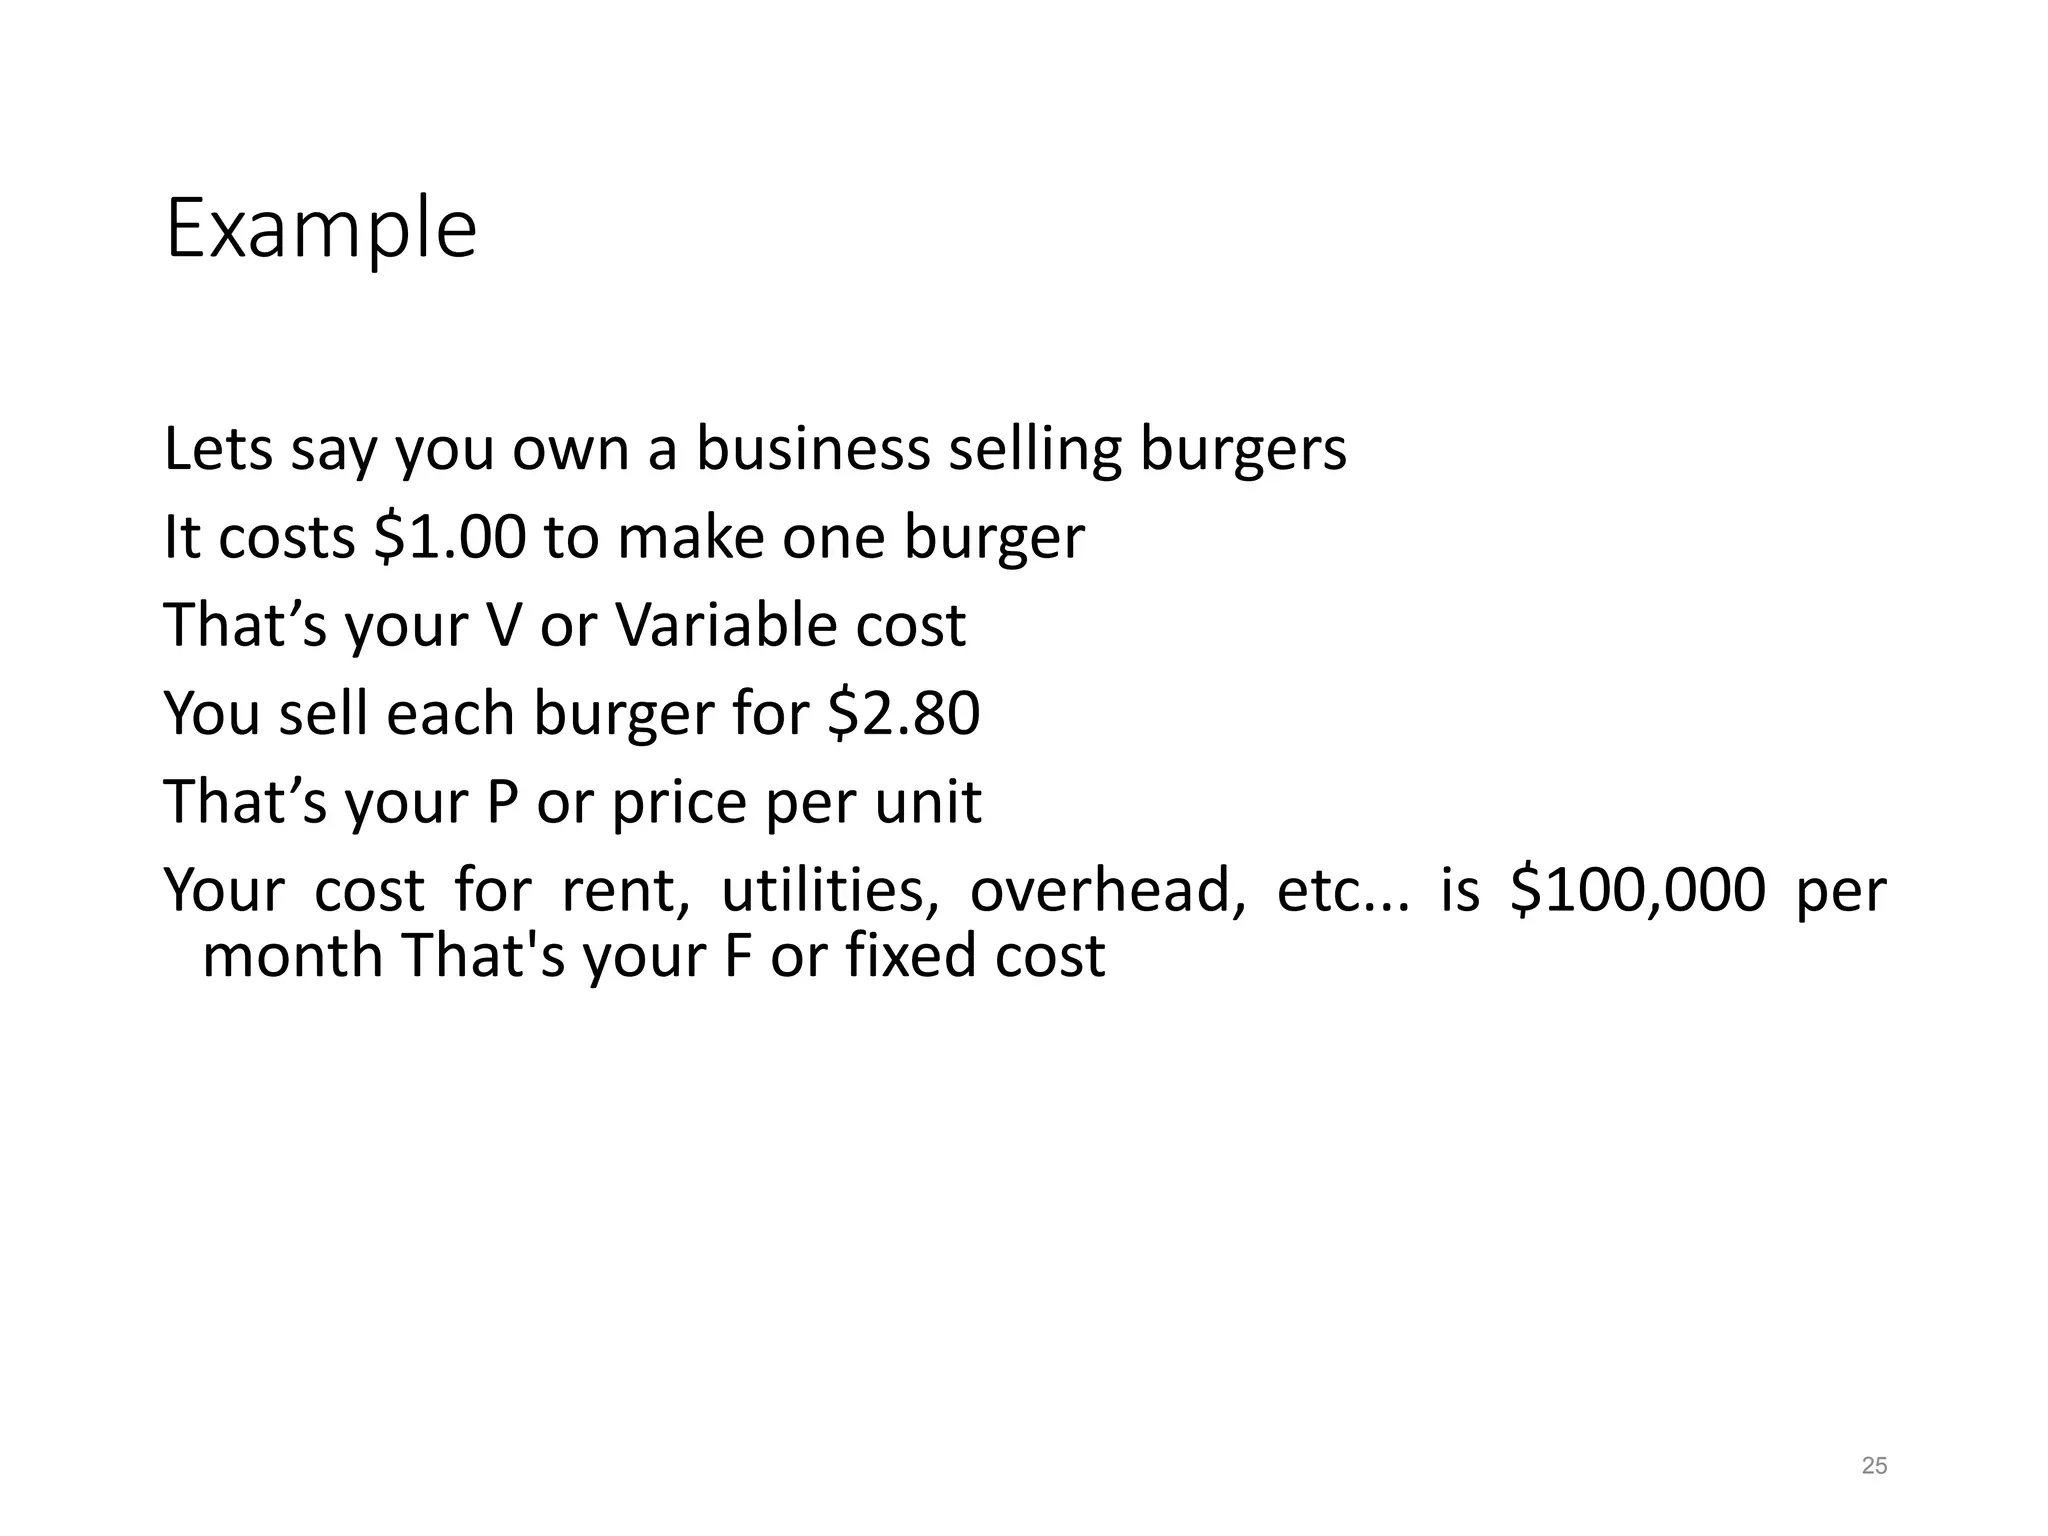
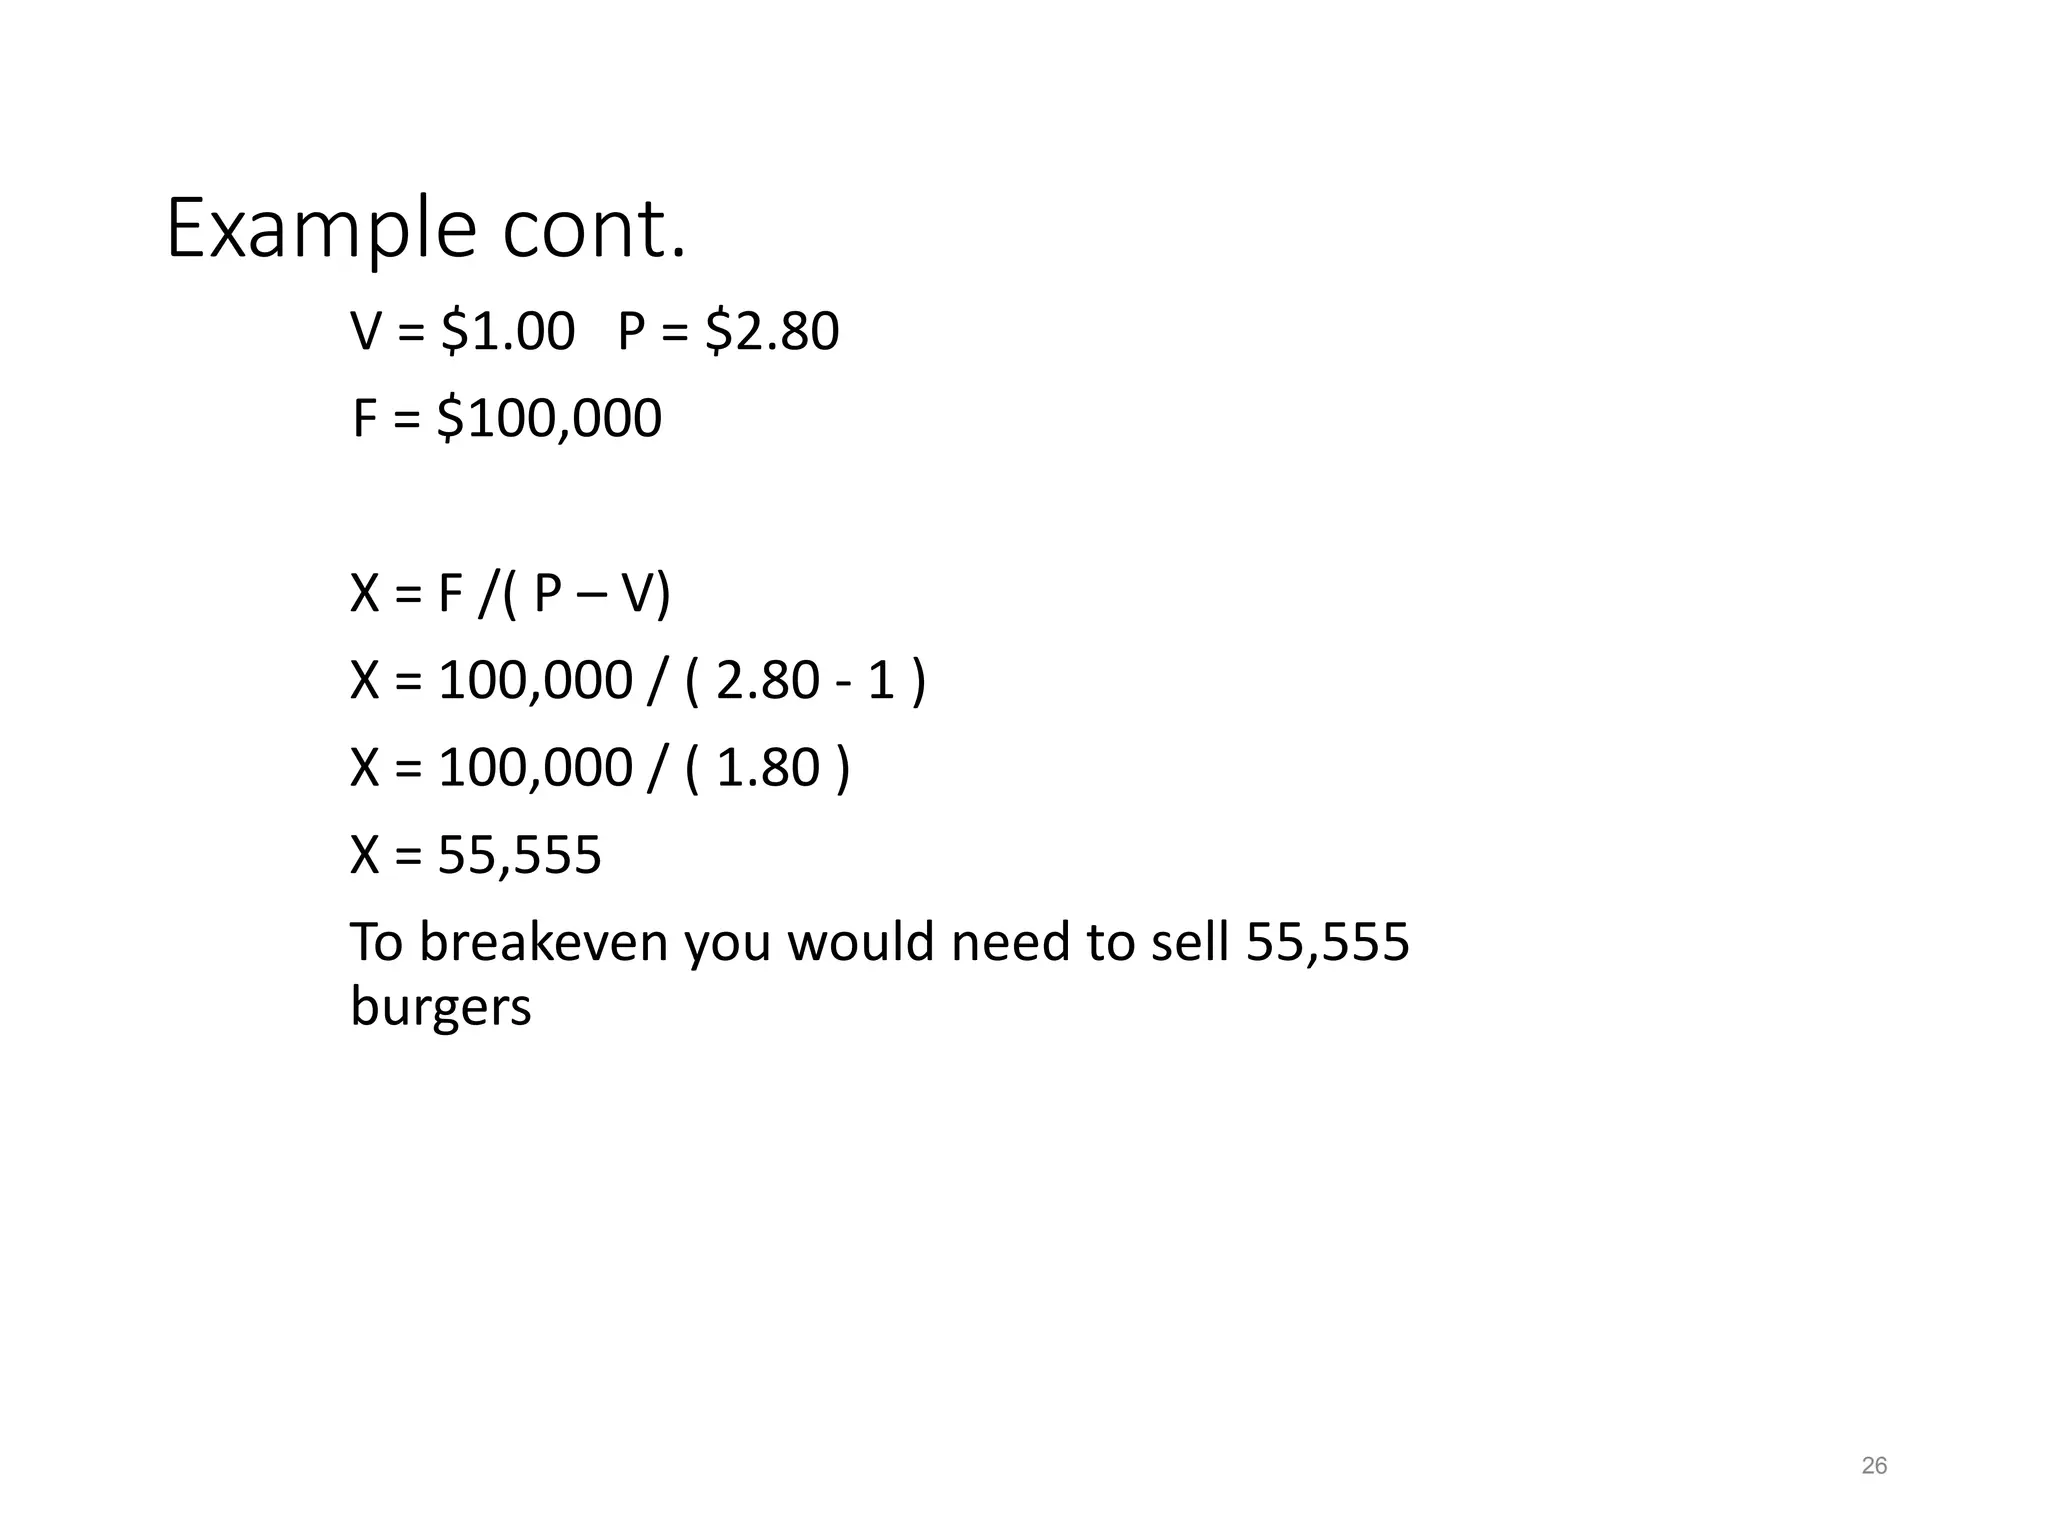

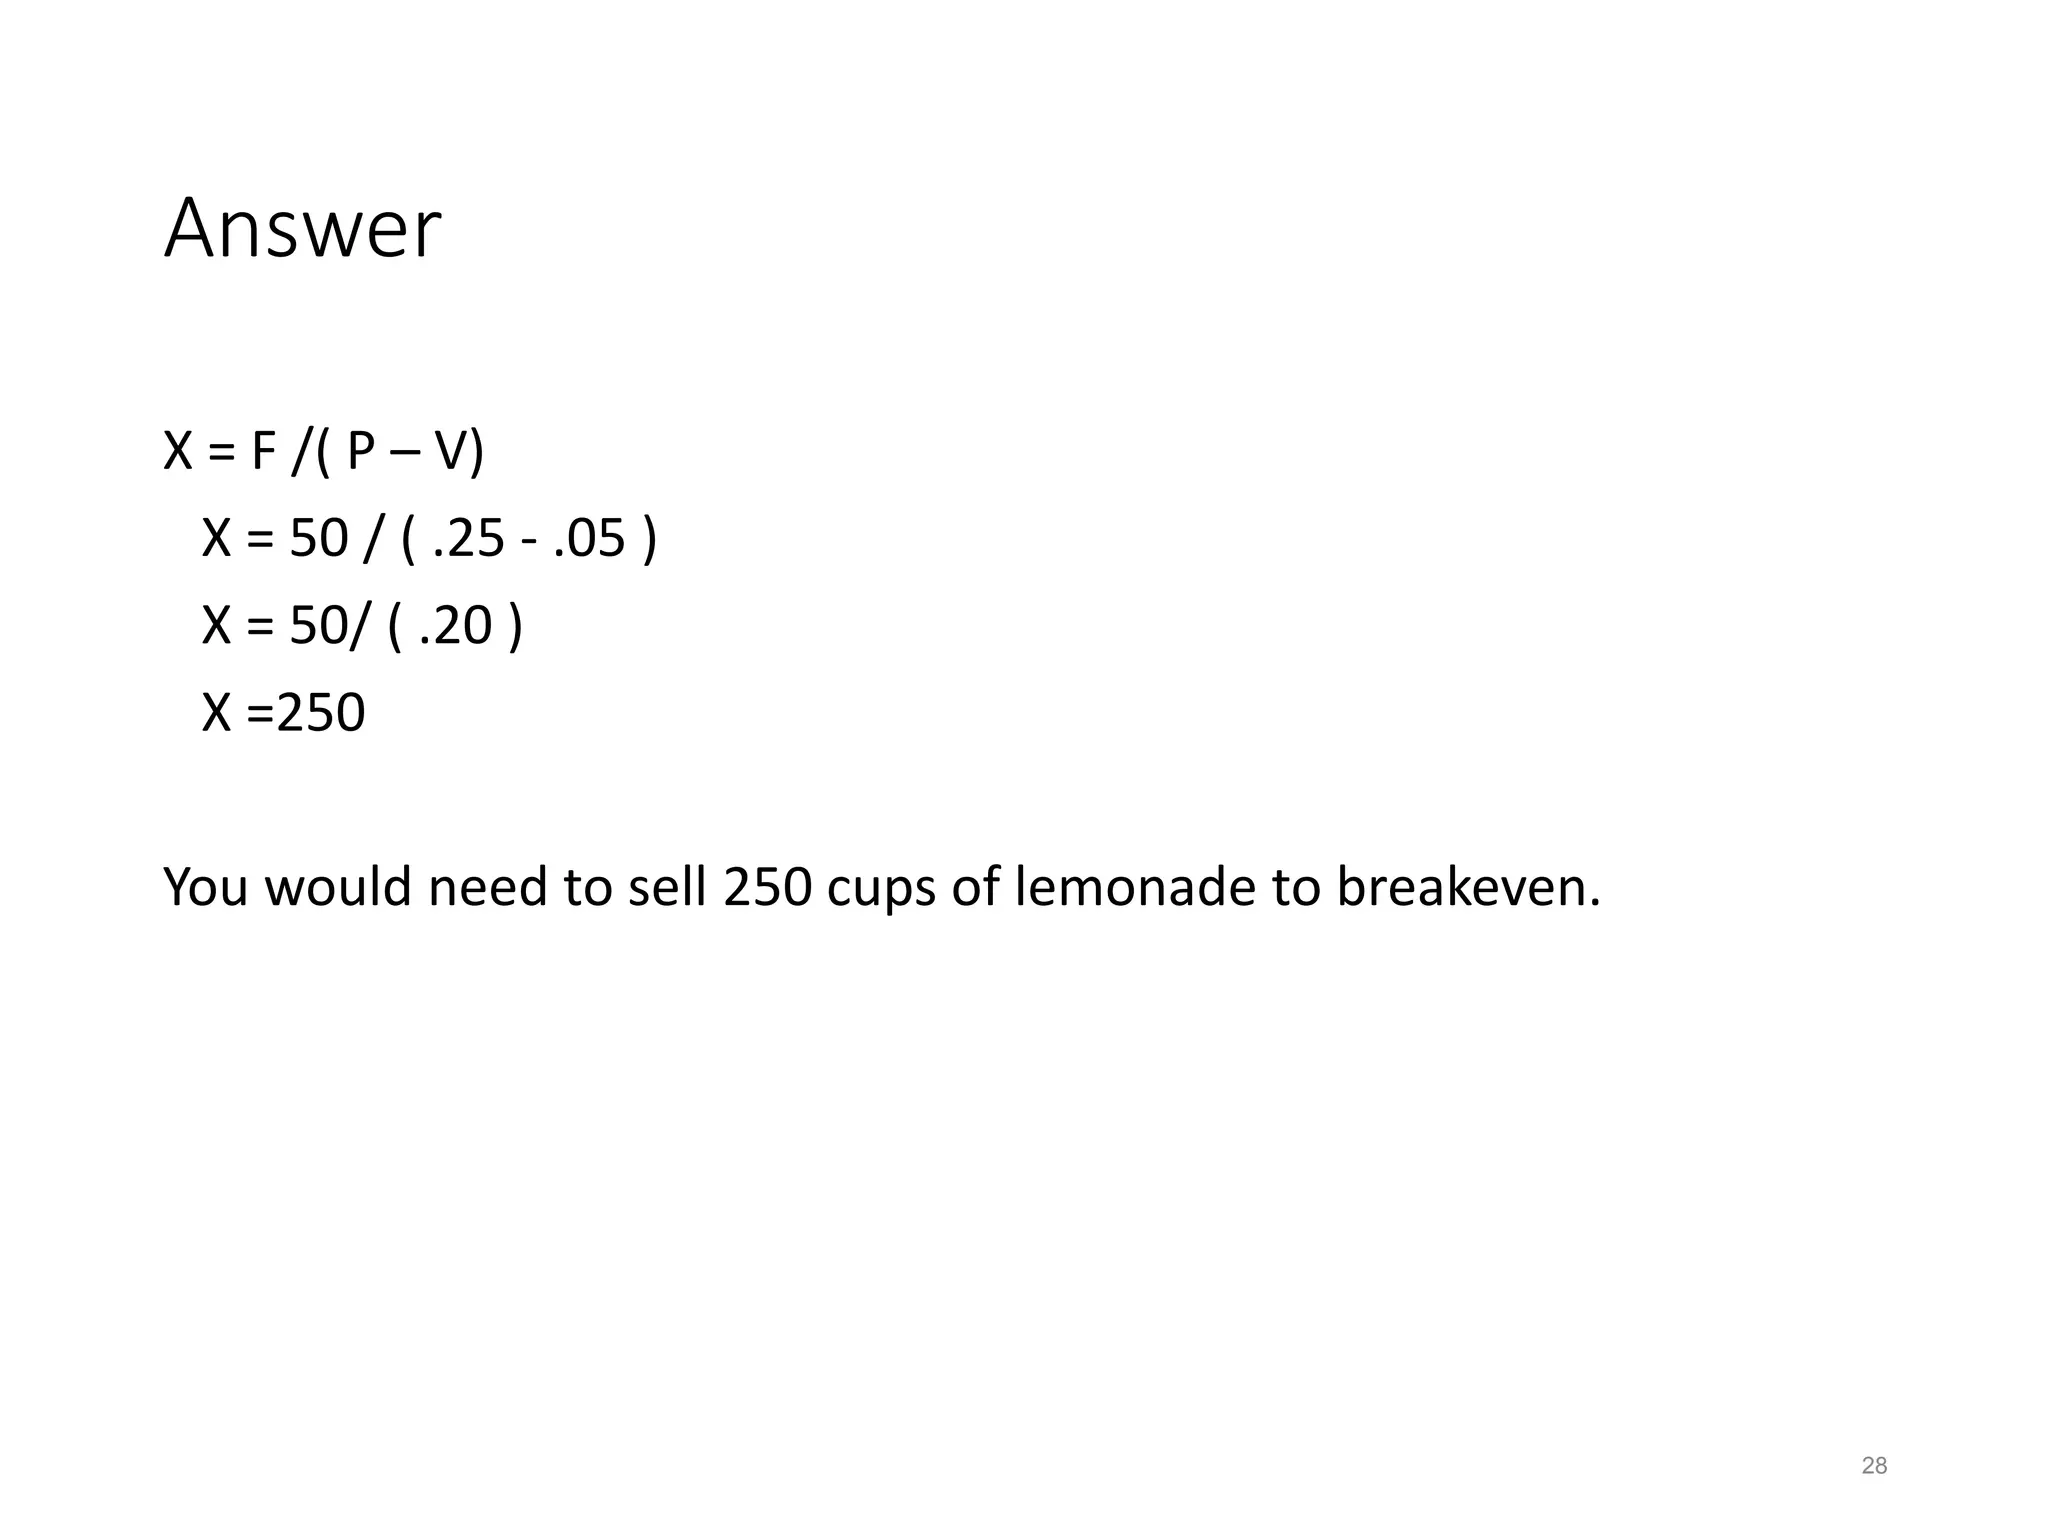

Break-even analysis is a decision-making tool that helps managers determine the sales volume required to avoid losses. It is based on key concepts such as fixed costs, variable costs, revenue, and profit, and employs a formula to calculate the break-even point where income and costs are equal. The analysis can be used for various managerial decisions, including pricing strategies, cost changes, and evaluating production techniques, while also having limitations due to its assumptions.