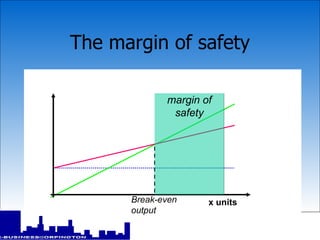
Accounting and finance Break-even analysis
Marginal Costing Marginal costing is one of the most useful techniques available to the management. It guides the management in pricing, decision-making and assessment of profitability. It reveals the interrelationship between cost, volume of sales and profit. It classifies cost into fixed and variable and only variable costs are charged to products. It does not include fixed expenses. Marginal costing is also known as direct costing or variable costing or incremental costing.  According to ICMA, England, “Marginal cost is the amount, at any given volume of output, by which aggregate cost are changed, if the volume of output is increased or decreased by one unit”
Break – Even Analysis : The term BEA is interpreted in two senses. In its narrow sense, it is concerned with finding out the BEP. BEP is the point at which total revenue is equal to total cost. It is the point of no profit, no loss. In broad sense, it means a system of analysis that can be used to determine the probable profit at any level of production
Break-even analysis break-even analysis provides a simple means of measuring profits and losses at different levels of output sales revenues and total costs are analysed for each different level of production analysis is normally done graphically using a  break-even  chart
Assumption    All cost are classified into two – fixed and variable. Fixed cost remain constant at all level of output Variable cost very proportionally with the volume of output. Selling price per unit remains constant in spite of completion or changes in the volume of production. There will be no change in operating efficiency  There will be no change in the general price level. Volume of production is the only factor affecting the cost Volume of sales and volume of production are equal. Hence, there is no unsold stock There is only one product or in the case of multiple products, sale mix remains constant.
Drawing a break-even chart £ Quantity Fixed costs Total costs Sales revenue Break-even output Break-even sales break- even point at the break-even point, total sales = total cost (i.e. no profit or loss is made) Angle of Incidence Loss
The margin of safety the difference between actual output and the break-even output is known as the  margin of safety
The margin of safety x units Break-even output margin of safety
Break-even point the point at which total costs are covered and no profit or loss is made is called the  break-even point   the break-even point is where the  total revenue  and  total cost  lines intersect on the chart this can also be calculated using the formula:
Uses of break-even analysis To calculate the minimum amount of sales required in order to be able to break even To see how changes in output, selling price or costs will affect profit levels To calculate the level of output required to reach a certain level of profit To allow various scenarios (what-if) to be tested out To aid forecasting and planning BEC can be understood more easily than those contained in the profit & loss account and cost statements. BEC disclose the relationship between cost, volume and profit. So, it helps the management in decision making.  It is very useful for forecasting cost and profits, long –term planning and growth. The chart discloses profits at various levels of profits at various levels of production. It can also be used study the comparative plant efficiencies of the industry. BEC presents the different elements in the costs- direct material, direct labour, fixed and variable overheads.
Limitations of break-even analysis it’s accuracy depends upon the accuracy of the data used forecasting the future is difficult, especially long term  it assumes there is a simple relationship between variable costs and sales sales income does not necessarily rise in a constant relationship to sales volume  external constraints have to be recognised  BEC presents only cost, volume and profits. It ignore other consideration such as capital amount, marketing aspects and effect of government policy etc. which are necessary in decision making. A major draw back of BEC is its inability to handle production and sales of multiple products. It ignore economies of scale in production  Semi-variable costs are completely ignored. It  assumes production is equal to sales. It is not always true because generally there may be opening stock In practice, selling price may not remain fixed. More over, it may be necessary to give extra discount to sell extra units.
Format  Sales XXXX Less: Variable Cost XXXX Contribution  XXXX Less:  Fixed Cost   XXXX Profit/ Loss  XXXX
Important formula:     Contribution  PVR  =  X 100   Sales  (Or)     Changes in profit    PVR  =  X 100   Changes in Sales
Fixed Expenses BEP (Volume) =    PVR  (or )      Fixed Expenses BEP (Unit) =    Contribution per unit
      Profit Margin of Safety  =    PVR (or) Present sales – Break even sales
Summary the break-even point occurs when total sales revenue matches total costs the break-even point can be worked out either numerically or graphically break-even analysis is a very useful tool for businesses to use although it does have some limitations Key concepts: Break-even output Contribution per unit Fixed costs Variable costs Margin of safety

Ppt12

  • 1.
    Accounting and financeBreak-even analysis
  • 2.
    Marginal Costing Marginalcosting is one of the most useful techniques available to the management. It guides the management in pricing, decision-making and assessment of profitability. It reveals the interrelationship between cost, volume of sales and profit. It classifies cost into fixed and variable and only variable costs are charged to products. It does not include fixed expenses. Marginal costing is also known as direct costing or variable costing or incremental costing. According to ICMA, England, “Marginal cost is the amount, at any given volume of output, by which aggregate cost are changed, if the volume of output is increased or decreased by one unit”
  • 3.
    Break – EvenAnalysis : The term BEA is interpreted in two senses. In its narrow sense, it is concerned with finding out the BEP. BEP is the point at which total revenue is equal to total cost. It is the point of no profit, no loss. In broad sense, it means a system of analysis that can be used to determine the probable profit at any level of production
  • 4.
    Break-even analysis break-evenanalysis provides a simple means of measuring profits and losses at different levels of output sales revenues and total costs are analysed for each different level of production analysis is normally done graphically using a break-even chart
  • 5.
    Assumption   All cost are classified into two – fixed and variable. Fixed cost remain constant at all level of output Variable cost very proportionally with the volume of output. Selling price per unit remains constant in spite of completion or changes in the volume of production. There will be no change in operating efficiency There will be no change in the general price level. Volume of production is the only factor affecting the cost Volume of sales and volume of production are equal. Hence, there is no unsold stock There is only one product or in the case of multiple products, sale mix remains constant.
  • 6.
    Drawing a break-evenchart £ Quantity Fixed costs Total costs Sales revenue Break-even output Break-even sales break- even point at the break-even point, total sales = total cost (i.e. no profit or loss is made) Angle of Incidence Loss
  • 7.
    The margin ofsafety the difference between actual output and the break-even output is known as the margin of safety
  • 8.
    The margin ofsafety x units Break-even output margin of safety
  • 9.
    Break-even point thepoint at which total costs are covered and no profit or loss is made is called the break-even point the break-even point is where the total revenue and total cost lines intersect on the chart this can also be calculated using the formula:
  • 10.
    Uses of break-evenanalysis To calculate the minimum amount of sales required in order to be able to break even To see how changes in output, selling price or costs will affect profit levels To calculate the level of output required to reach a certain level of profit To allow various scenarios (what-if) to be tested out To aid forecasting and planning BEC can be understood more easily than those contained in the profit & loss account and cost statements. BEC disclose the relationship between cost, volume and profit. So, it helps the management in decision making. It is very useful for forecasting cost and profits, long –term planning and growth. The chart discloses profits at various levels of profits at various levels of production. It can also be used study the comparative plant efficiencies of the industry. BEC presents the different elements in the costs- direct material, direct labour, fixed and variable overheads.
  • 11.
    Limitations of break-evenanalysis it’s accuracy depends upon the accuracy of the data used forecasting the future is difficult, especially long term it assumes there is a simple relationship between variable costs and sales sales income does not necessarily rise in a constant relationship to sales volume external constraints have to be recognised BEC presents only cost, volume and profits. It ignore other consideration such as capital amount, marketing aspects and effect of government policy etc. which are necessary in decision making. A major draw back of BEC is its inability to handle production and sales of multiple products. It ignore economies of scale in production Semi-variable costs are completely ignored. It assumes production is equal to sales. It is not always true because generally there may be opening stock In practice, selling price may not remain fixed. More over, it may be necessary to give extra discount to sell extra units.
  • 12.
    Format SalesXXXX Less: Variable Cost XXXX Contribution XXXX Less: Fixed Cost XXXX Profit/ Loss XXXX
  • 13.
    Important formula:   Contribution PVR = X 100 Sales (Or) Changes in profit PVR = X 100 Changes in Sales
  • 14.
    Fixed Expenses BEP(Volume) = PVR (or )   Fixed Expenses BEP (Unit) = Contribution per unit
  • 15.
      Profit Margin of Safety = PVR (or) Present sales – Break even sales
  • 16.
    Summary the break-evenpoint occurs when total sales revenue matches total costs the break-even point can be worked out either numerically or graphically break-even analysis is a very useful tool for businesses to use although it does have some limitations Key concepts: Break-even output Contribution per unit Fixed costs Variable costs Margin of safety

Editor's Notes