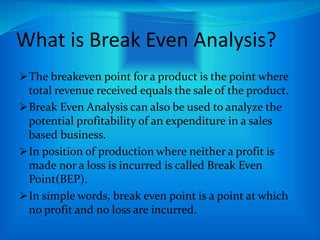
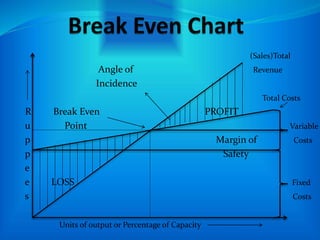
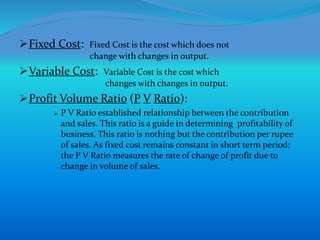
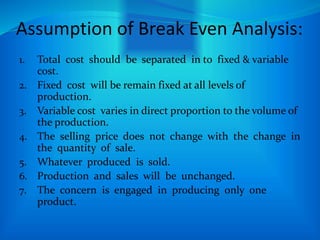
Gandhinagar Institute of
Technology
Topic : “Break Even Analysis”.
EEM ( 2130004 )
Active Learning Assignment
Prepared by : Jaimin Darji (150120116013)
GUDED BY: - Prof. Prashant R. Pandya
Branch : IT
Division : A(A1)
Index
What is Break Even Analysis?
Break Even Chart
Assumption of Break Even Analysis.
What is Break Even Analysis?
The breakeven point for a product is the point where
total revenue received equals the sale of the product.
Break Even Analysis can also be used to analyze the
potential profitability of an expenditure in a sales
based business.
In position of production where neither a profit is
made nor a loss is incurred is called Break Even
Point(BEP).
In simple words, break even point is a point at which
no profit and no loss are incurred.
(Sales)Total
Angle of Revenue
Incidence
Total Costs
R Break Even PROFIT
u Point Variable
p Margin of Costs
p Safety
e
e LOSS Fixed
s Costs
Units of output or Percentage of Capacity
Fixed Cost: Fixed Cost is the cost which does not
change with changes in output.
Variable Cost: Variable Cost is the cost which
changes with changes in output.
Profit Volume Ratio (P V Ratio):
 P V Ratio established relationship between the contribution
and sales. This ratio is a guide in determining profitability of
business. This ratio is nothing but the contribution per rupee
of sales. As fixed cost remains constant in short term period;
the P V Ratio measures the rate of change of profit due to
change in volume of sales.
Assumption of Break Even Analysis:
1. Total cost should be separated in to fixed & variable
cost.
2. Fixed cost will be remain fixed at all levels of
production.
3. Variable cost varies in direct proportion to the volume of
the production.
4. The selling price does not change with the change in
the quantity of sale.
5. Whatever produced is sold.
6. Production and sales will be unchanged.
7. The concern is engaged in producing only one
product.
Thank You!!!

What is Break Even Analysis.

  • 1.
    Gandhinagar Institute of Technology Topic: “Break Even Analysis”. EEM ( 2130004 ) Active Learning Assignment Prepared by : Jaimin Darji (150120116013) GUDED BY: - Prof. Prashant R. Pandya Branch : IT Division : A(A1)
  • 2.
    Index What is BreakEven Analysis? Break Even Chart Assumption of Break Even Analysis.
  • 3.
    What is BreakEven Analysis? The breakeven point for a product is the point where total revenue received equals the sale of the product. Break Even Analysis can also be used to analyze the potential profitability of an expenditure in a sales based business. In position of production where neither a profit is made nor a loss is incurred is called Break Even Point(BEP). In simple words, break even point is a point at which no profit and no loss are incurred.
  • 4.
    (Sales)Total Angle of Revenue Incidence TotalCosts R Break Even PROFIT u Point Variable p Margin of Costs p Safety e e LOSS Fixed s Costs Units of output or Percentage of Capacity
  • 5.
    Fixed Cost: FixedCost is the cost which does not change with changes in output. Variable Cost: Variable Cost is the cost which changes with changes in output. Profit Volume Ratio (P V Ratio):  P V Ratio established relationship between the contribution and sales. This ratio is a guide in determining profitability of business. This ratio is nothing but the contribution per rupee of sales. As fixed cost remains constant in short term period; the P V Ratio measures the rate of change of profit due to change in volume of sales.
  • 6.
    Assumption of BreakEven Analysis: 1. Total cost should be separated in to fixed & variable cost. 2. Fixed cost will be remain fixed at all levels of production. 3. Variable cost varies in direct proportion to the volume of the production. 4. The selling price does not change with the change in the quantity of sale. 5. Whatever produced is sold. 6. Production and sales will be unchanged. 7. The concern is engaged in producing only one product.
  • 7.