Download to read offline
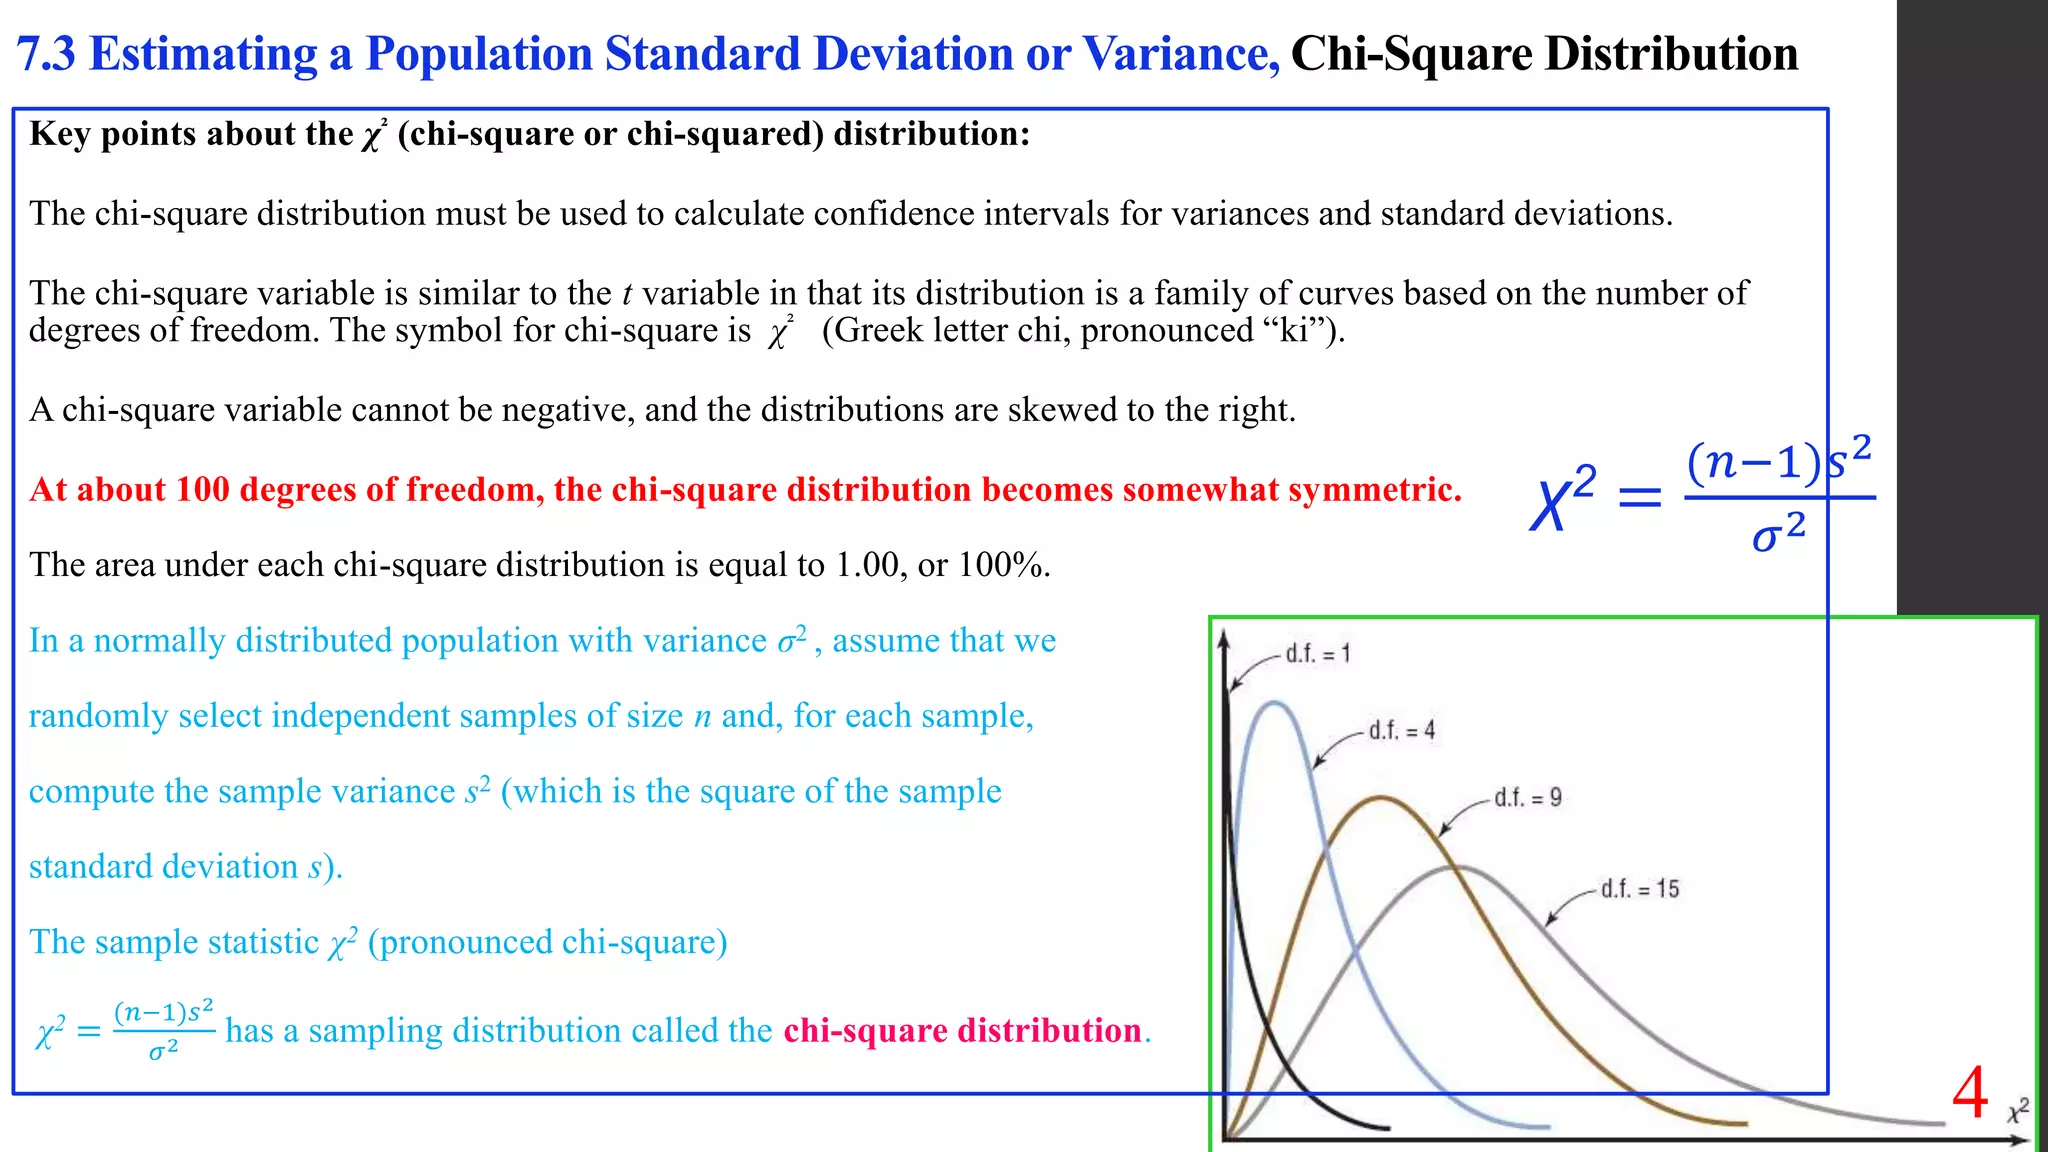


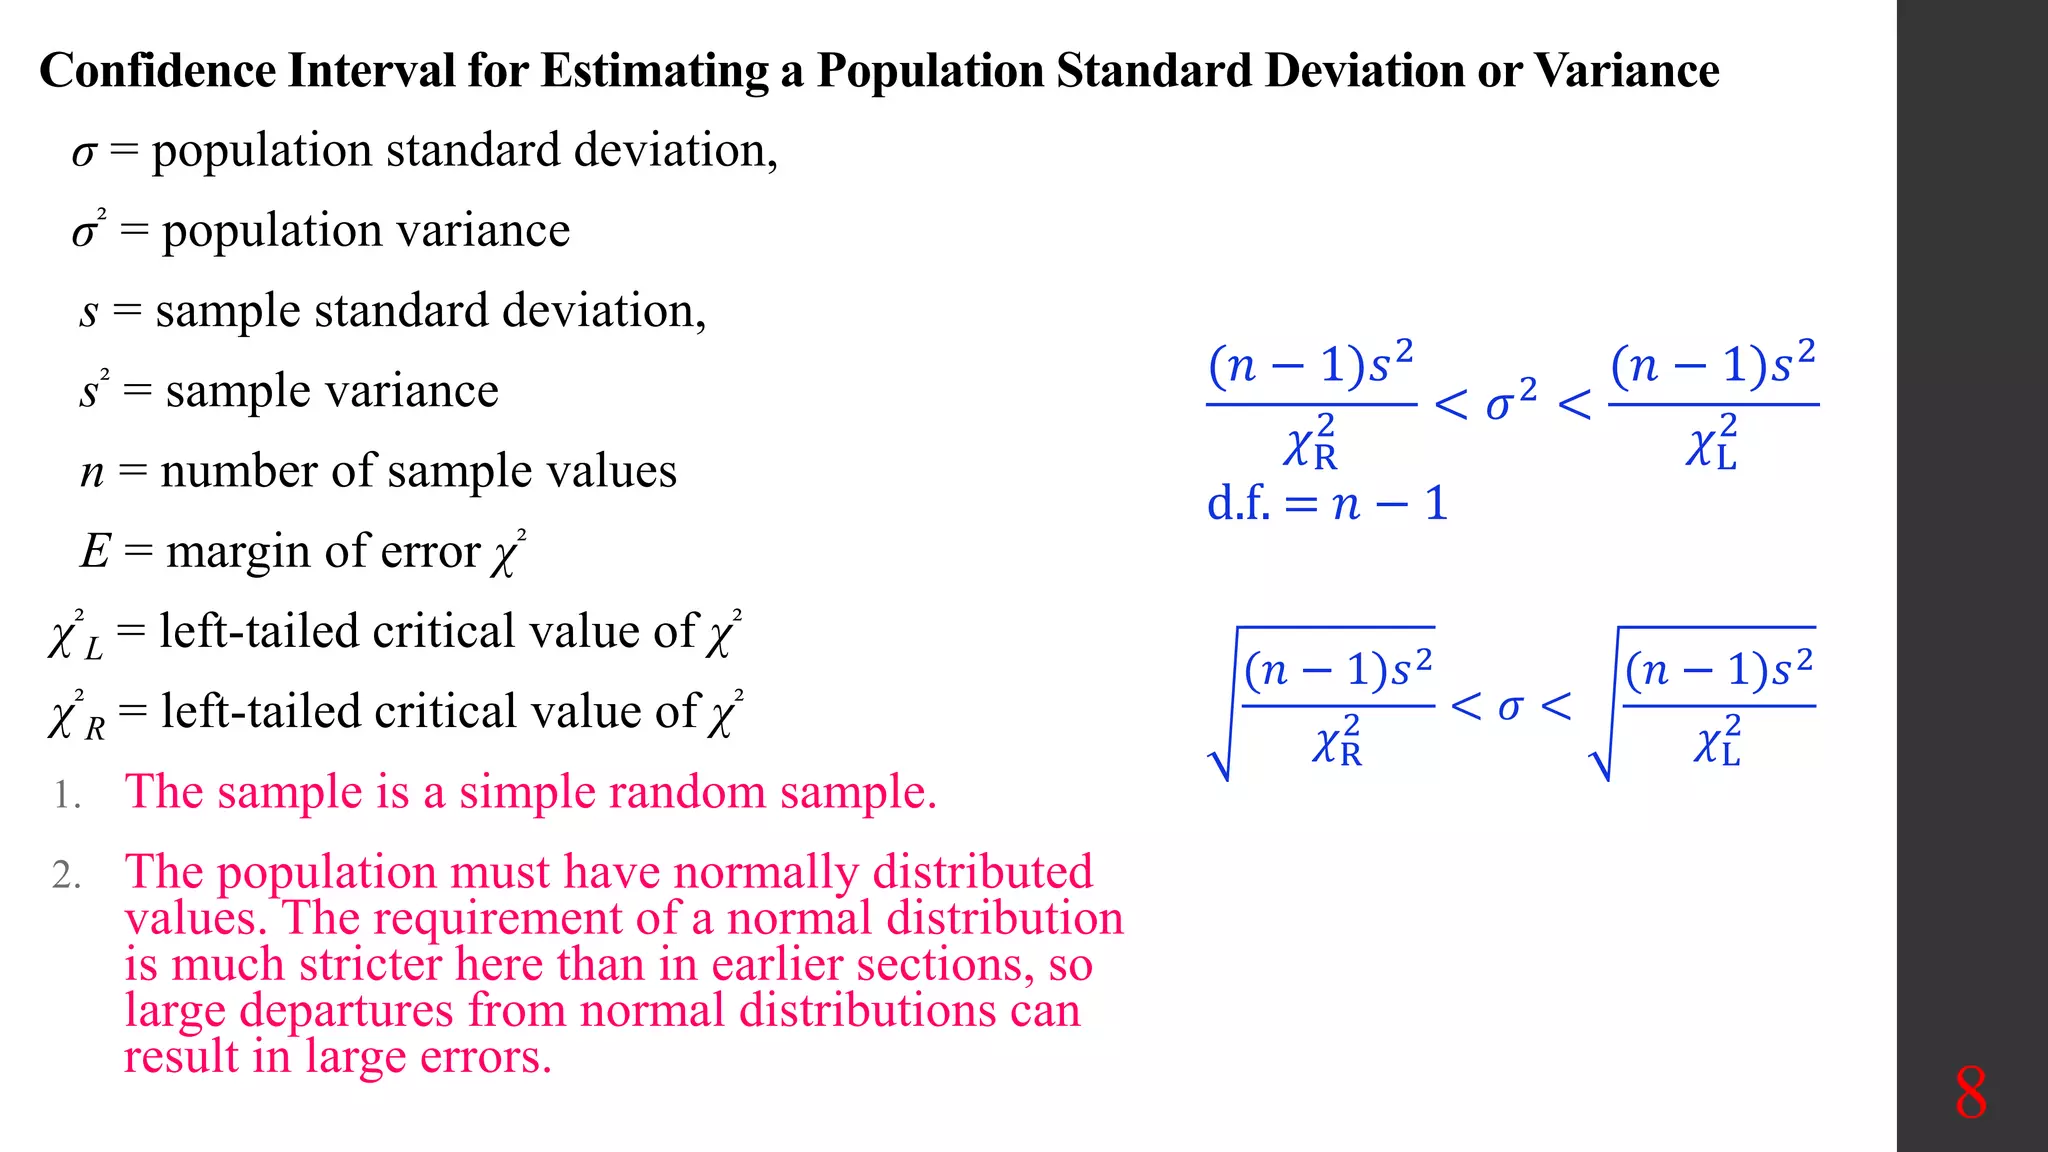

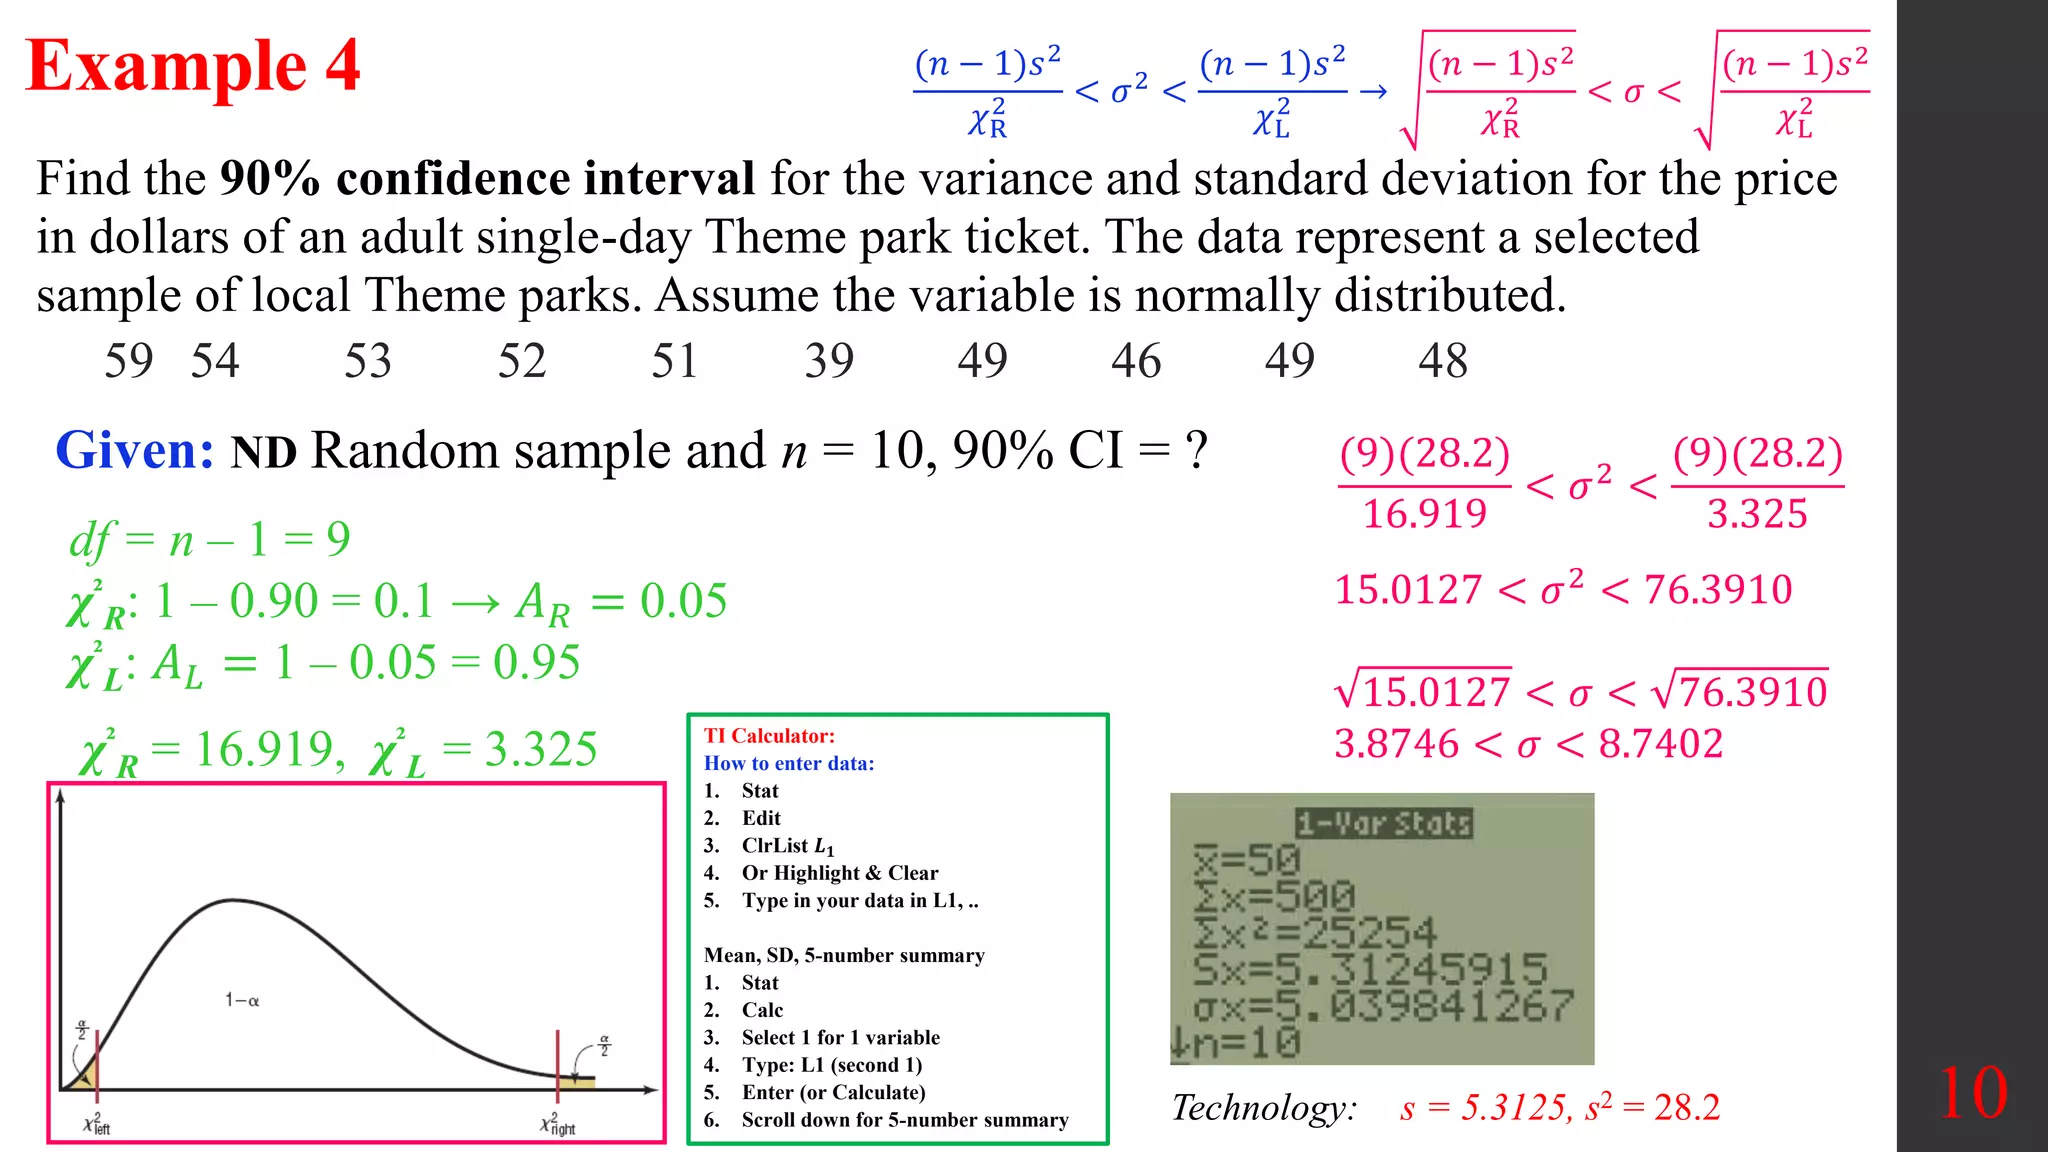


Chapter 7 of the document discusses estimating population parameters, specifically focusing on estimating population means, proportions, variances, and standard deviations using confidence intervals. It emphasizes the use of the chi-square distribution for calculating confidence intervals for variances and standards, along with the critical values needed for these calculations. Additionally, the document outlines methods for determining necessary sample sizes to achieve specified confidence levels for estimates.


