Downloaded 17 times


The document provides solutions to various statistical problems involving normal probability distributions and binomial approximations. Key concepts include the properties of normal distribution, calculations of z-scores, and applications to real-life scenarios such as IQ scores and passenger weights. It emphasizes the use of the central limit theorem and the importance of unbiased estimators in sampling.
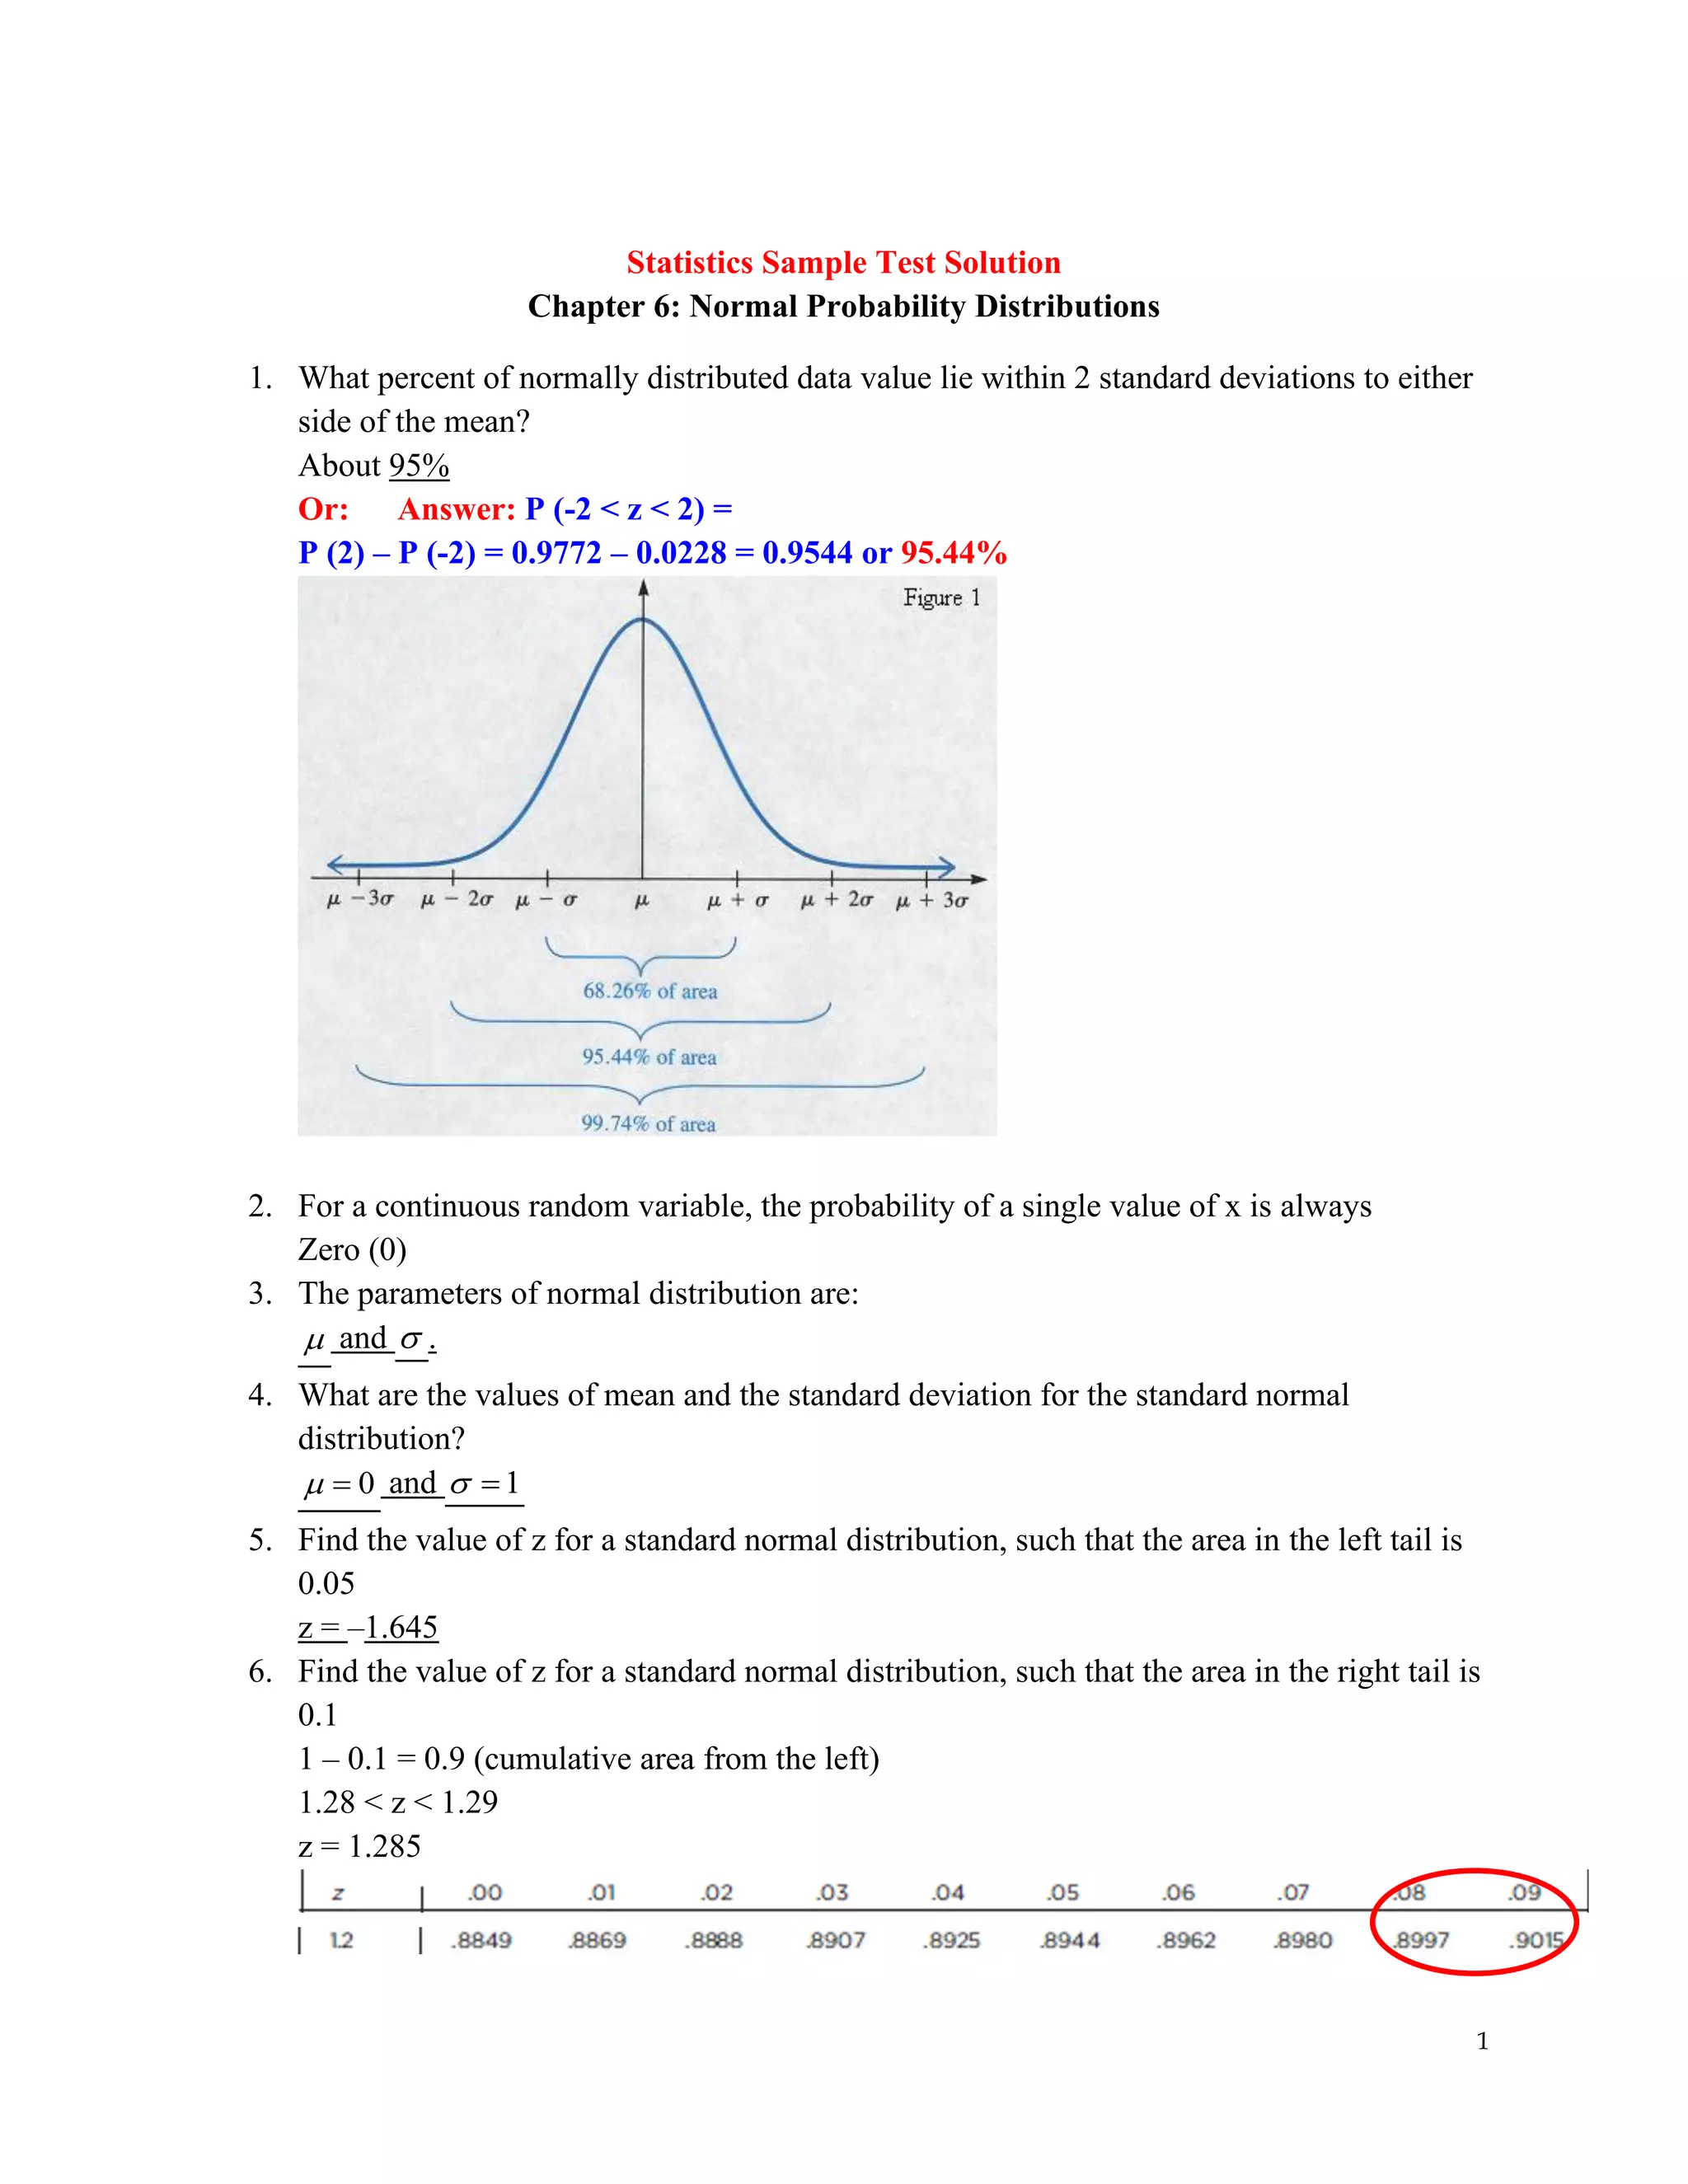
Introduction to normal distribution, standard deviations, and parameters. 95% of data within 2 SD, mean (μ) and SD (σ) of standard distribution.
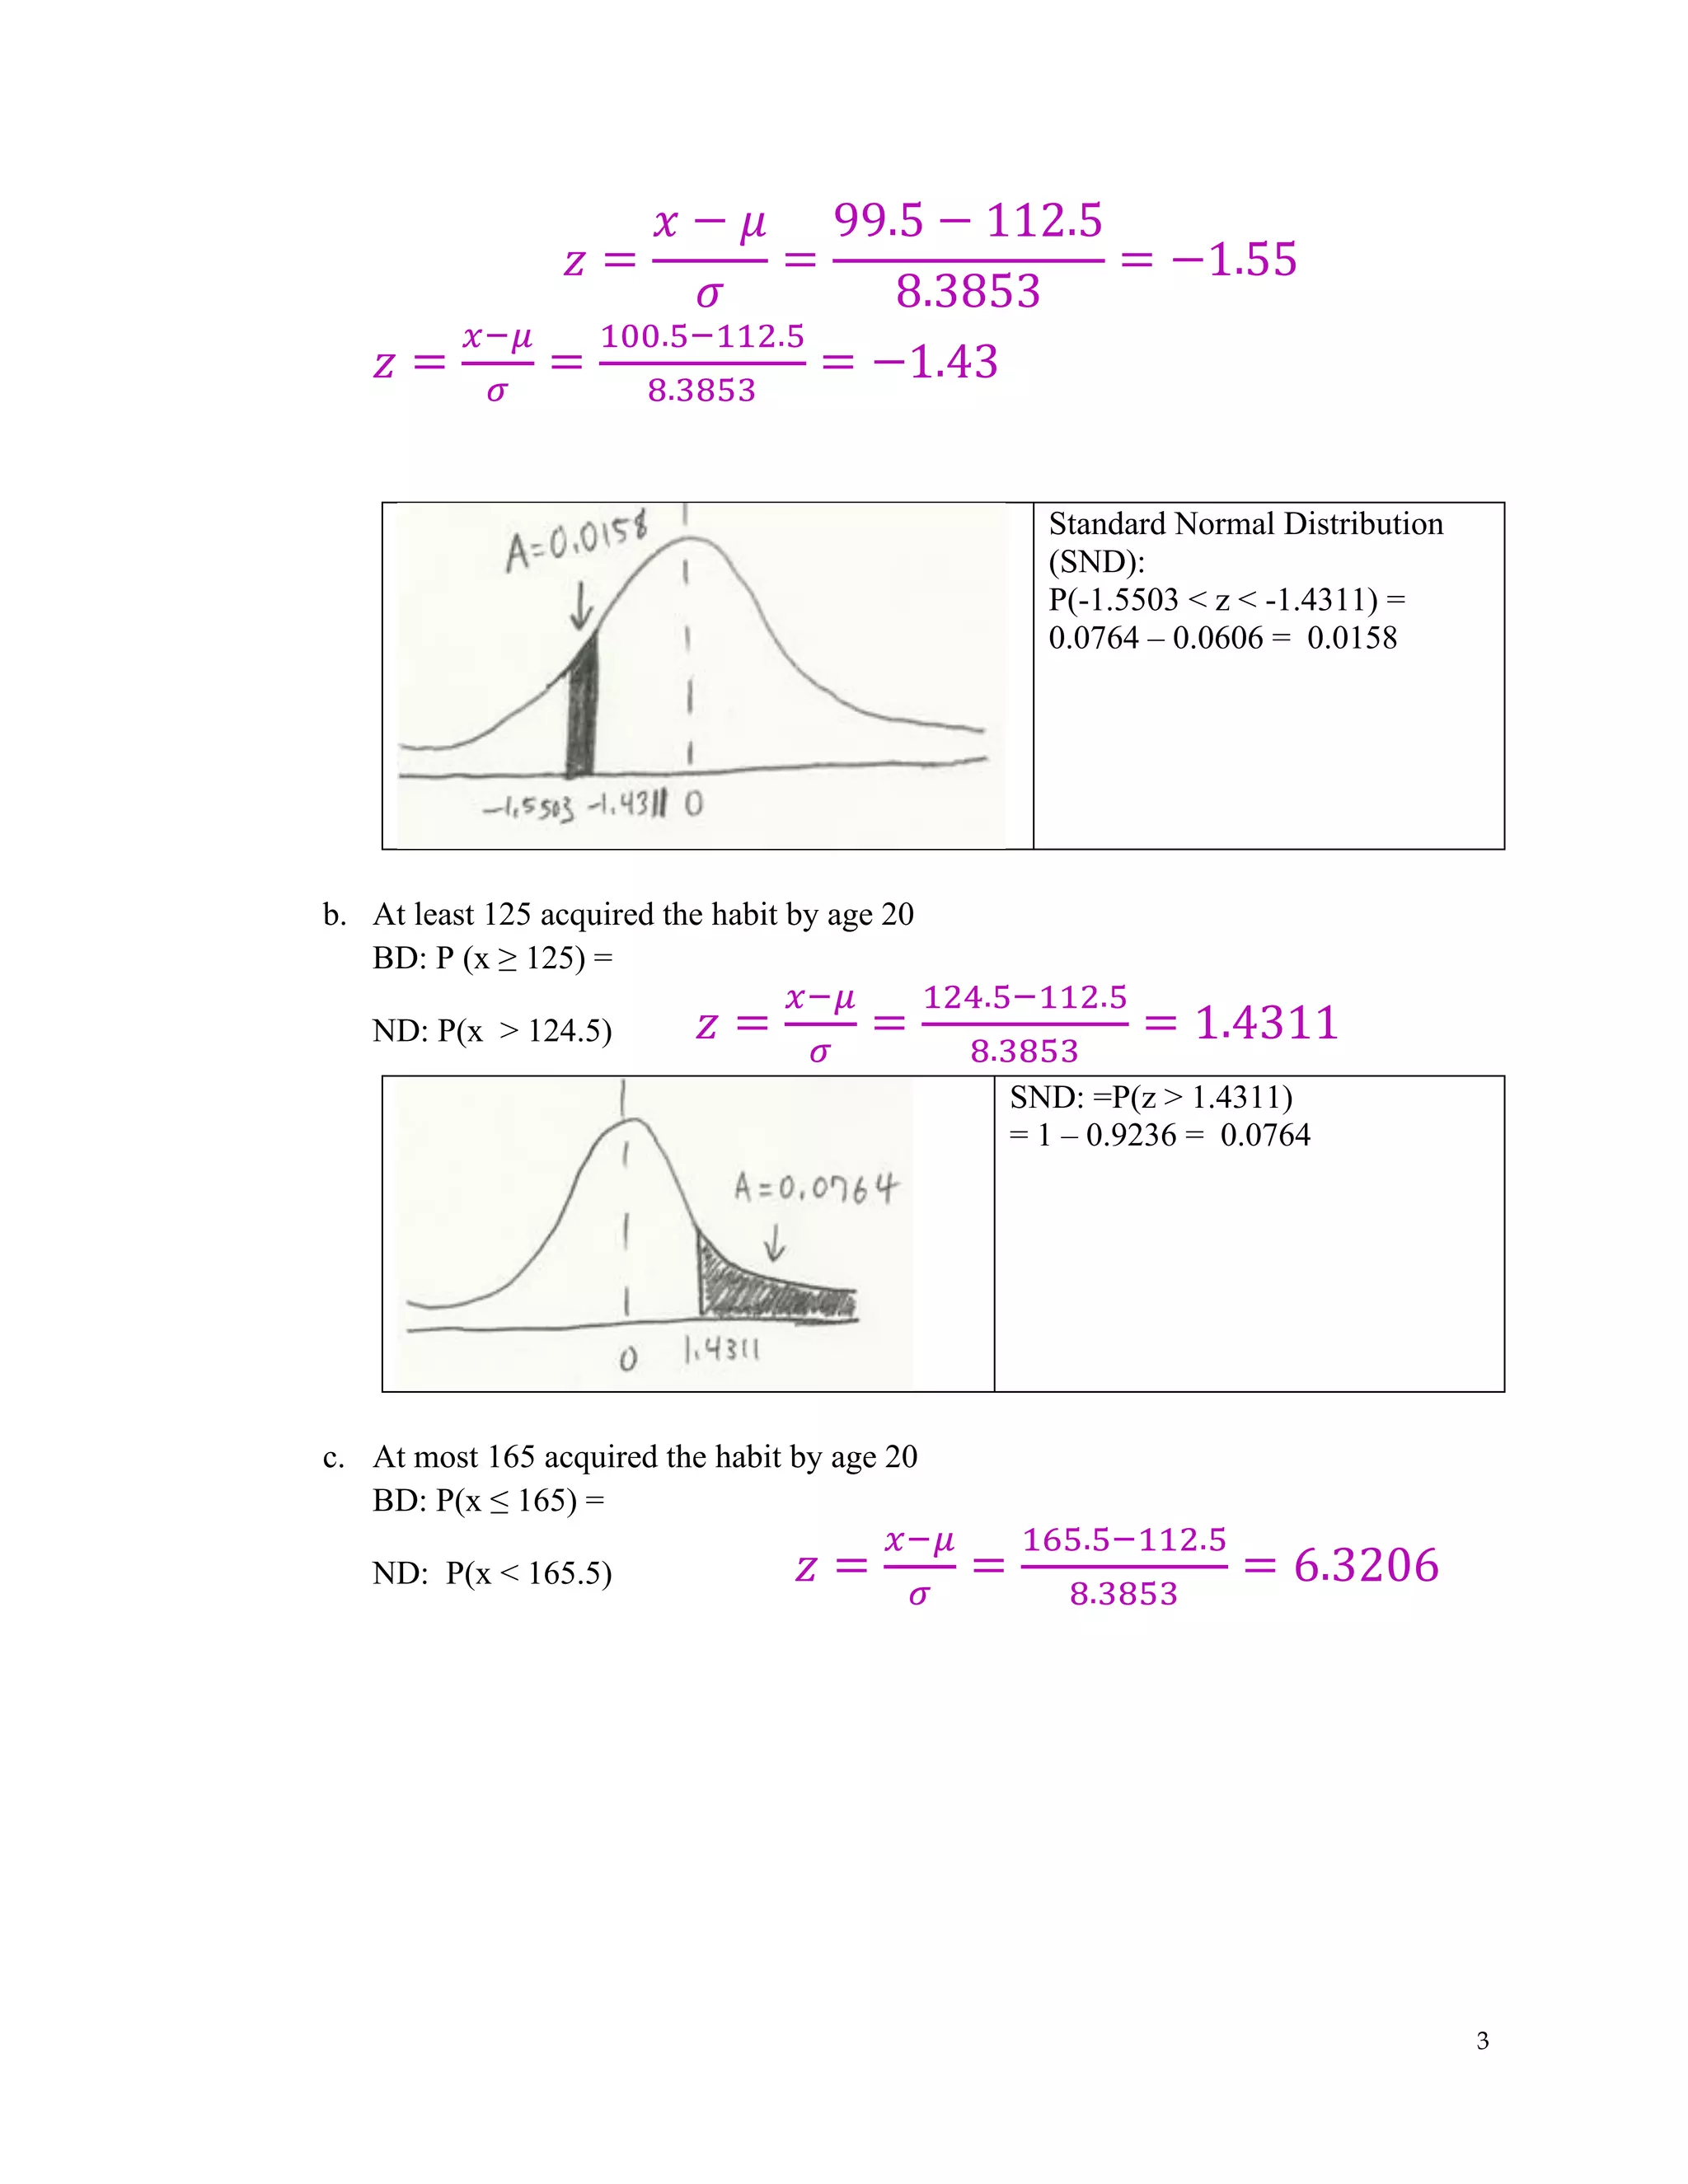
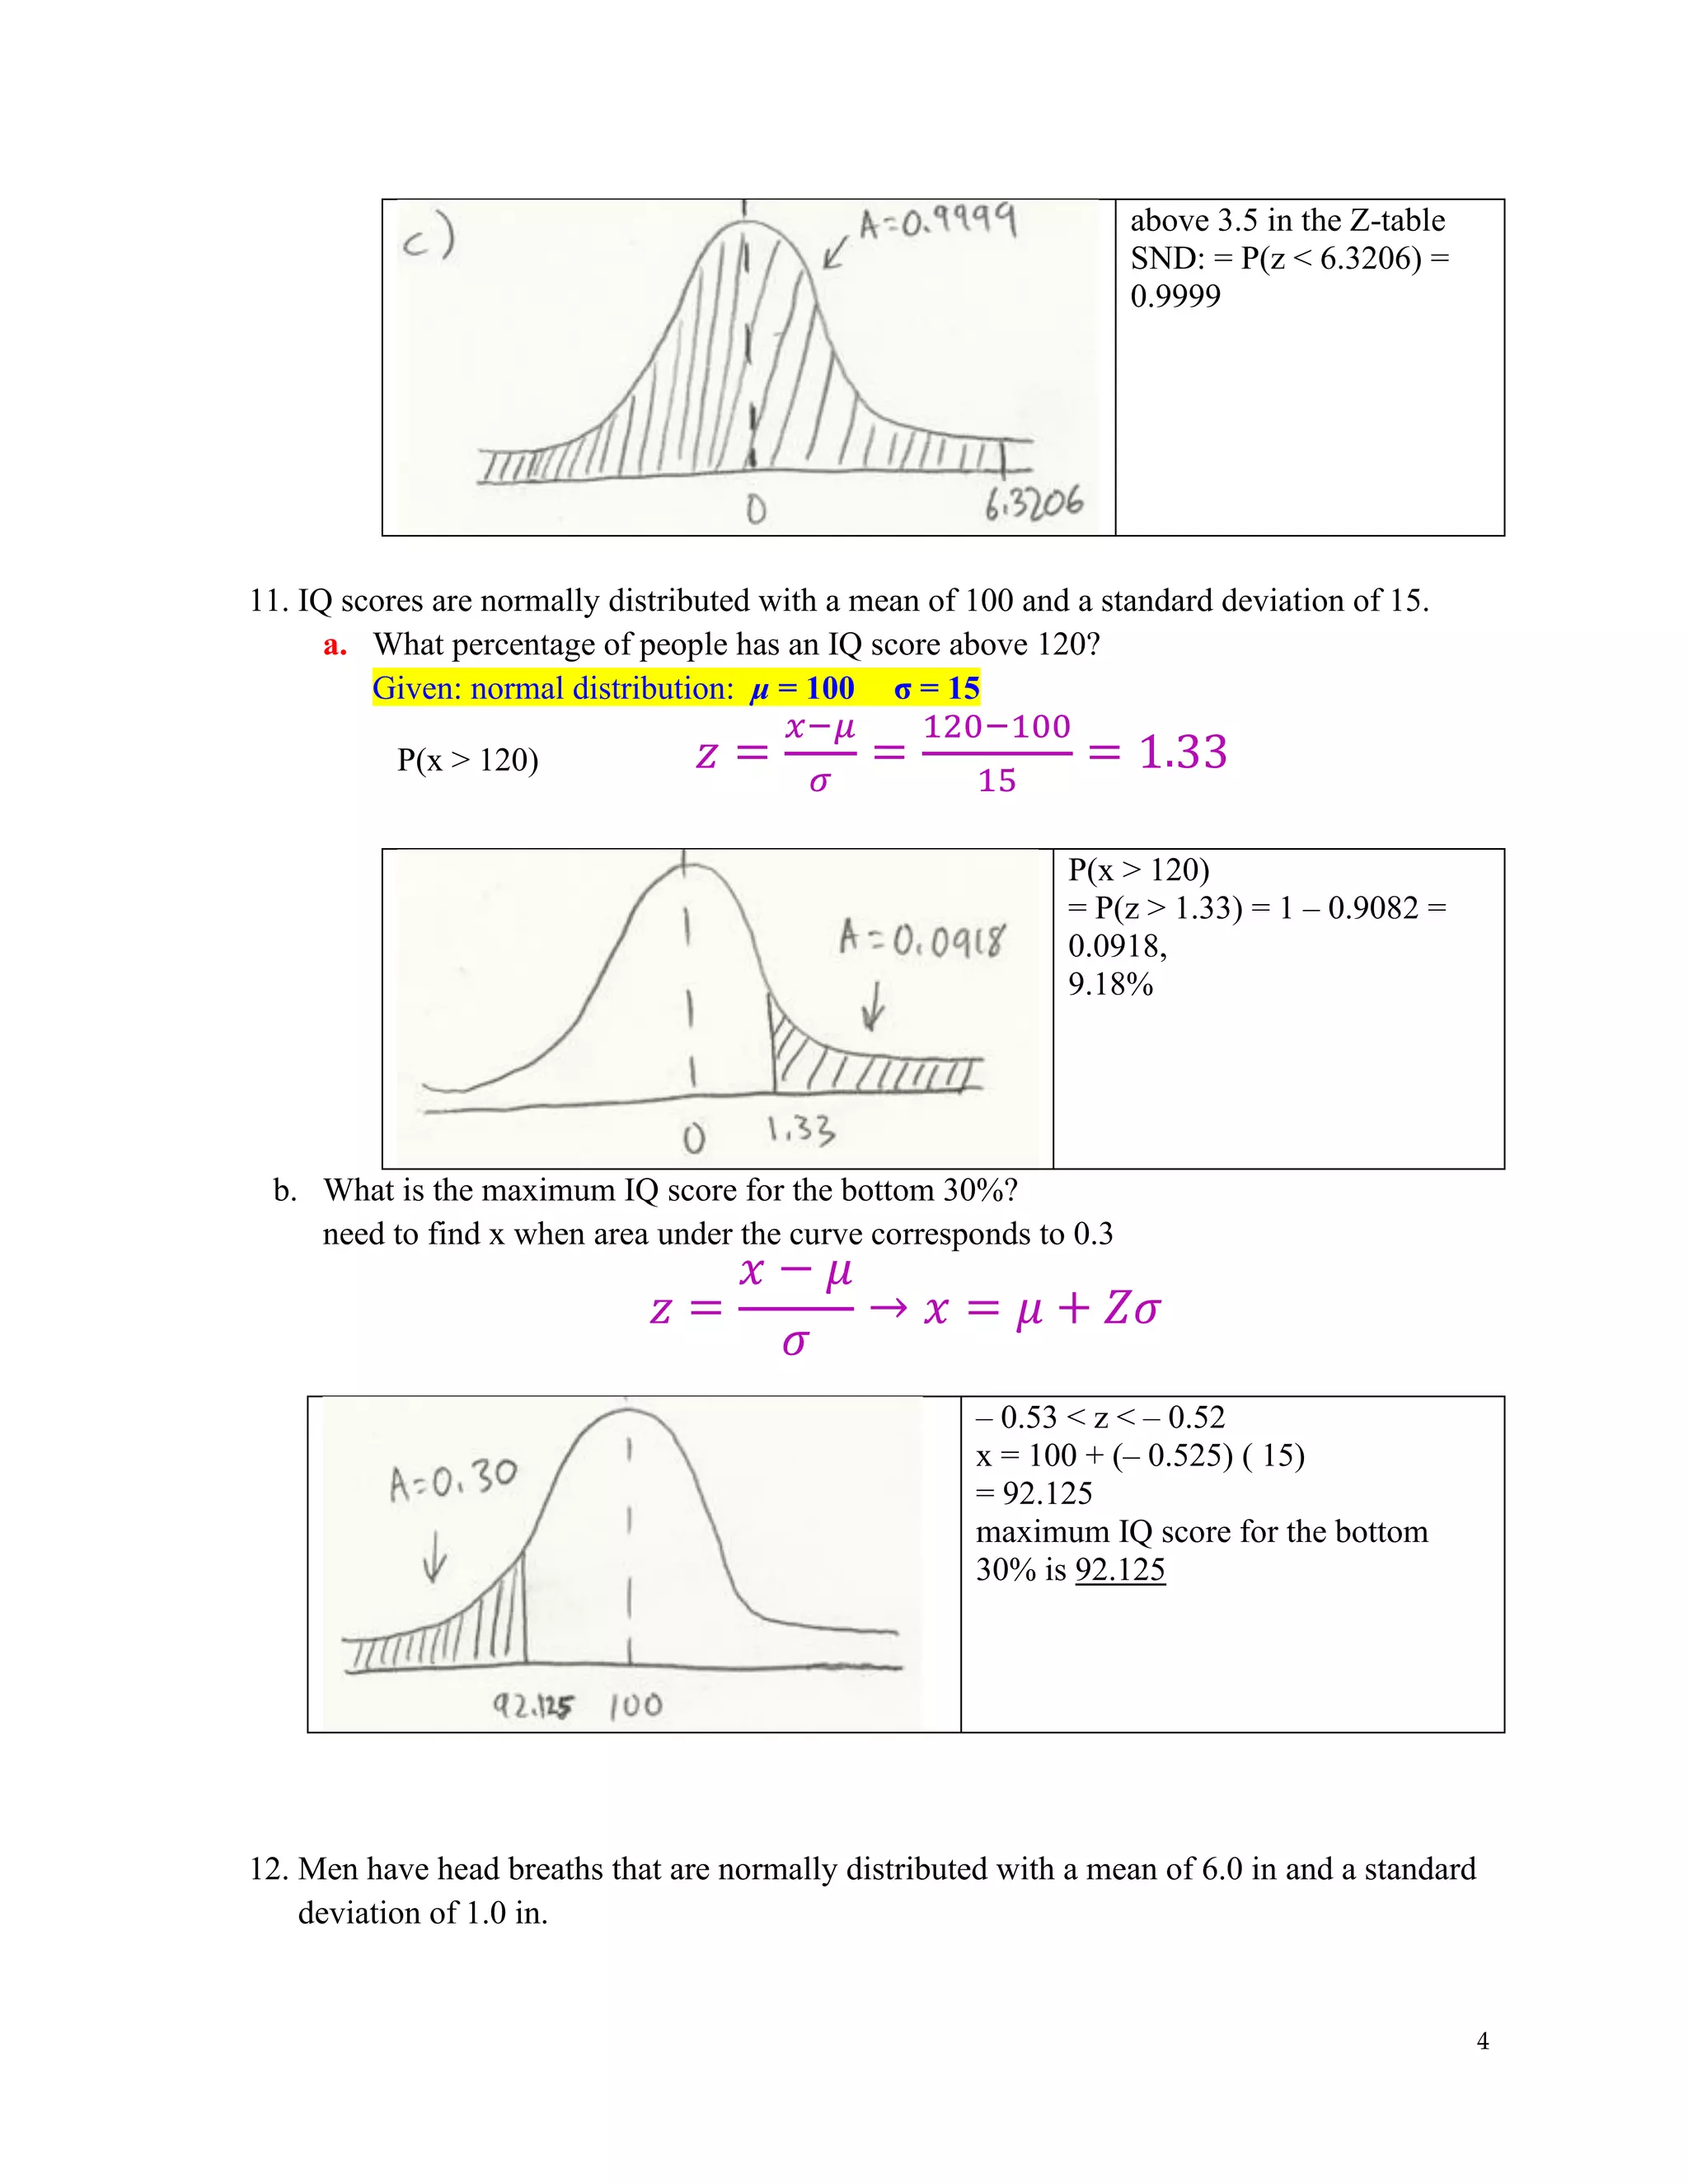
Approximation of binomial to normal distribution with np>5. Example on drinkers acquiring a habit using norm. approximation.
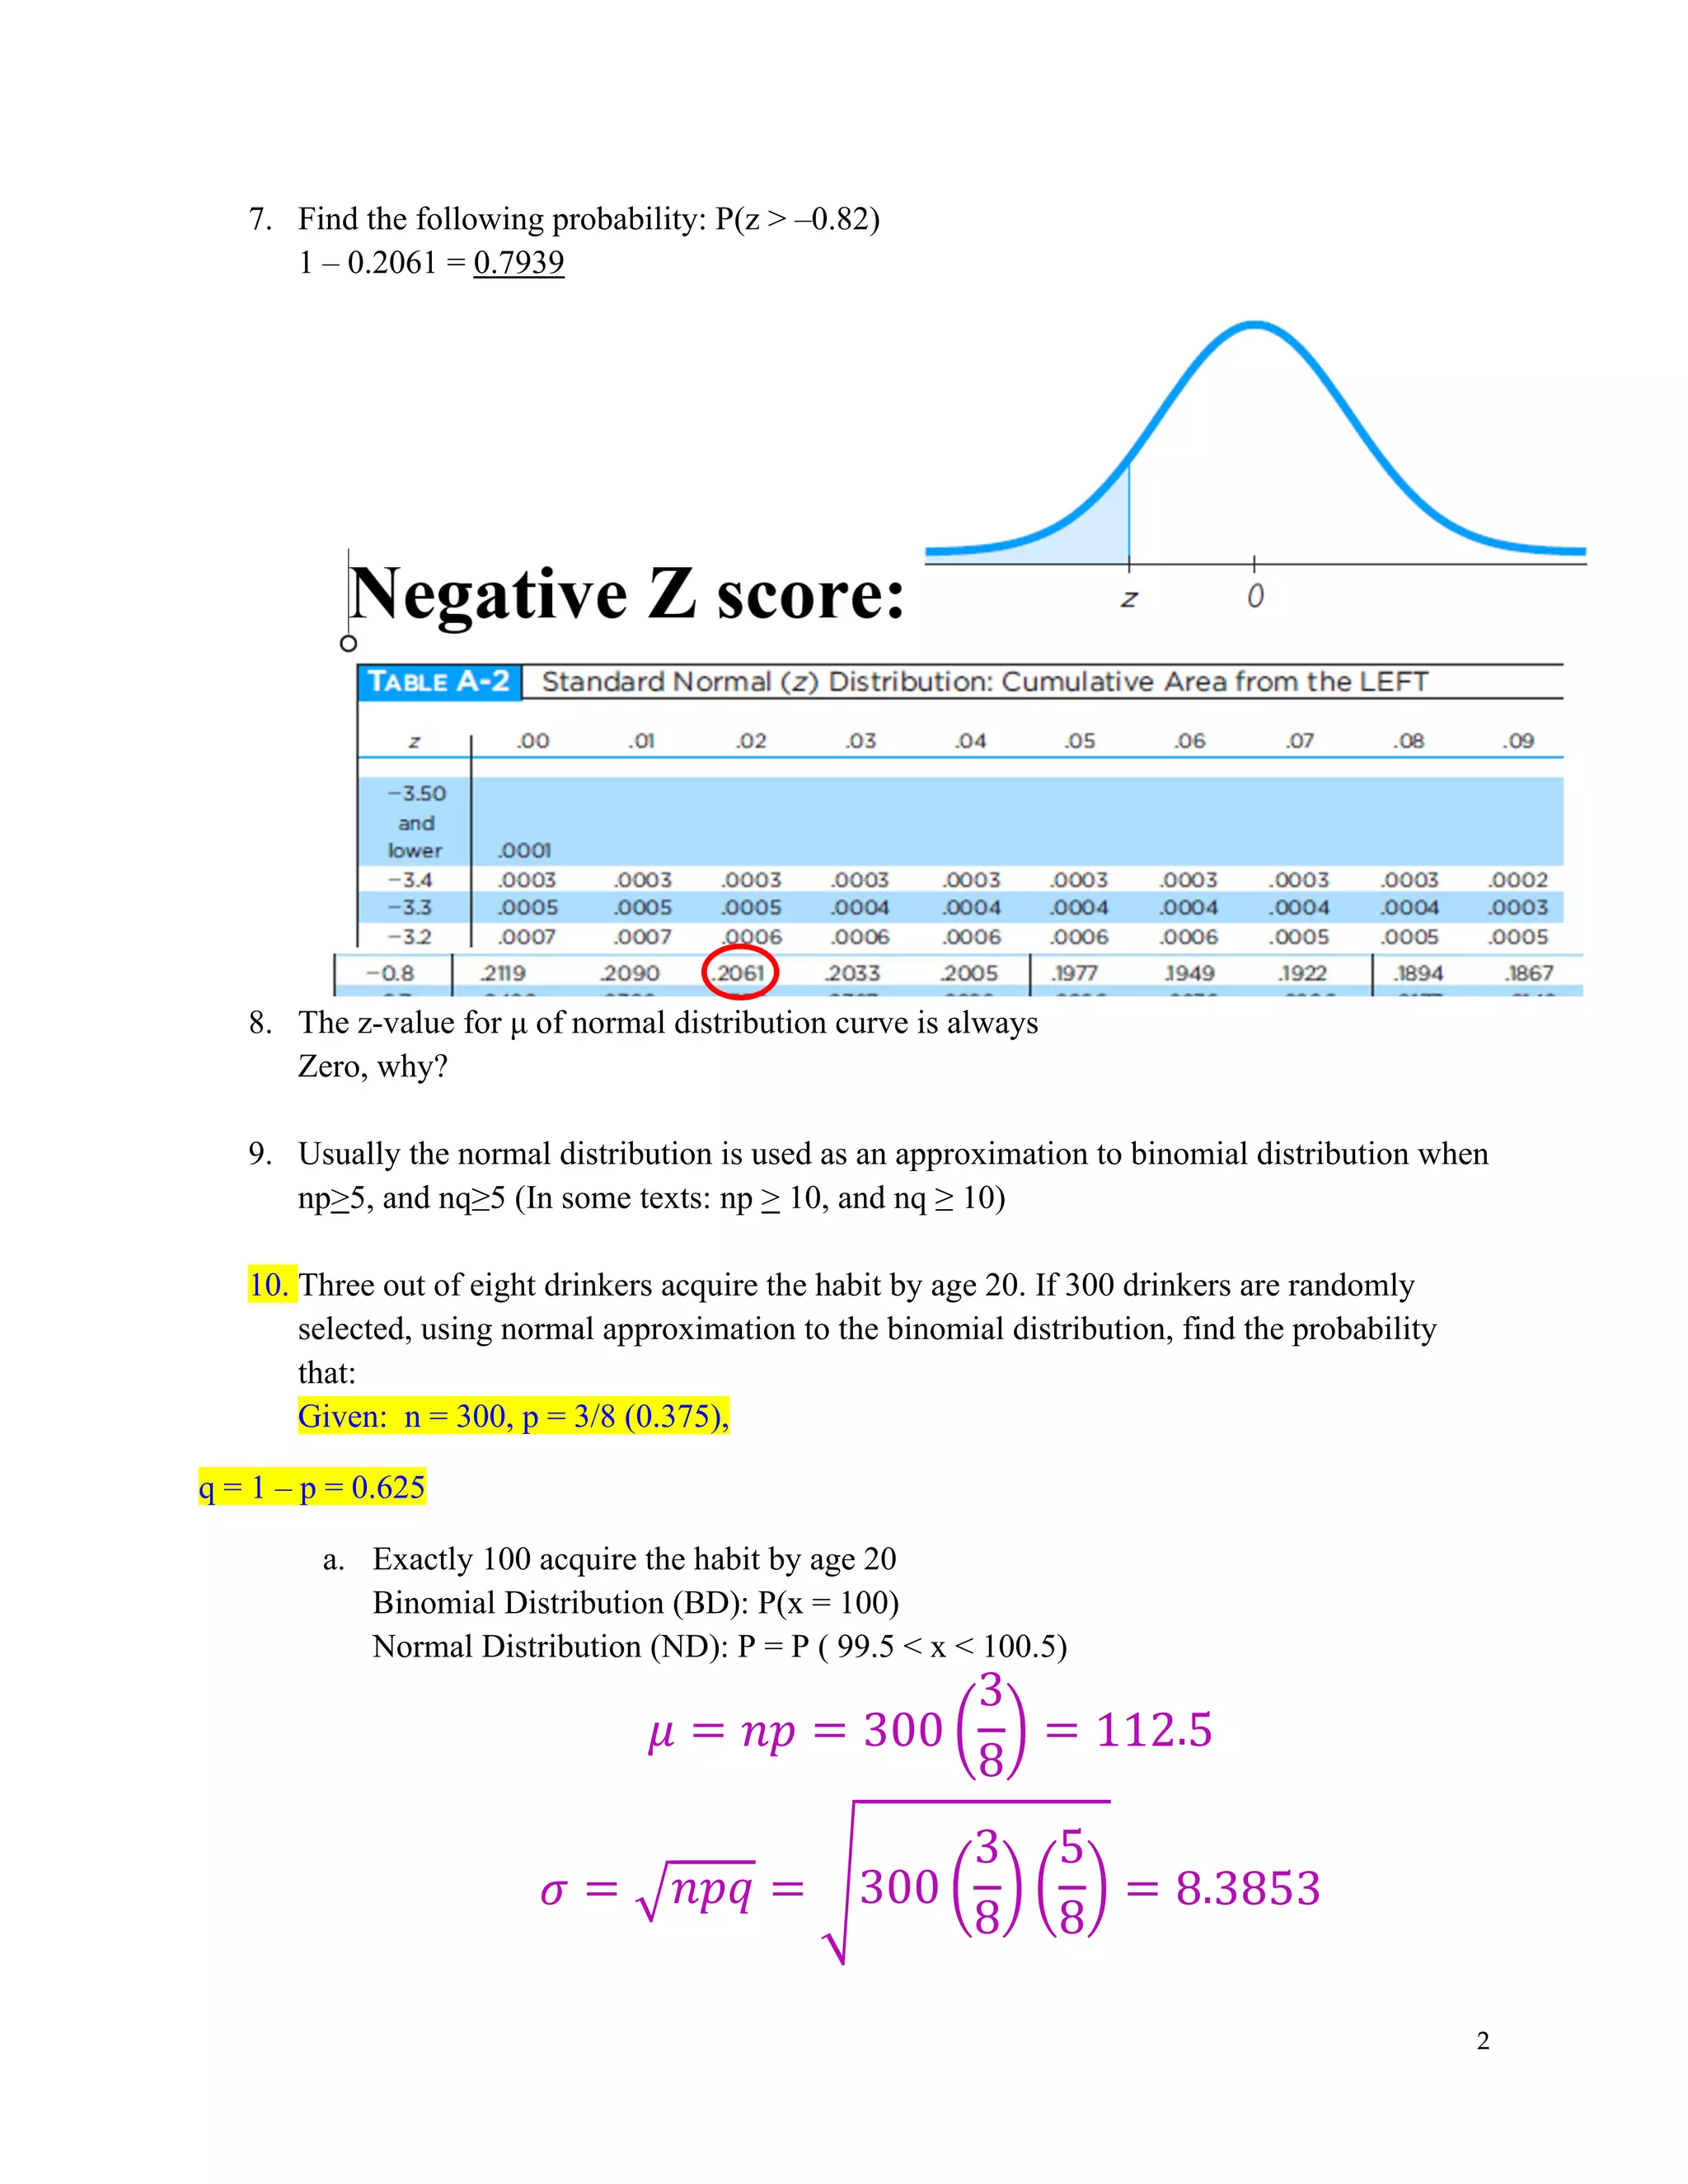
Calculating z-scores for different probabilities and normal distributions, with applications to probabilities for varied cases.
Analysis of IQ scores, finding percentages above a threshold, and determining scores for certain percentiles.
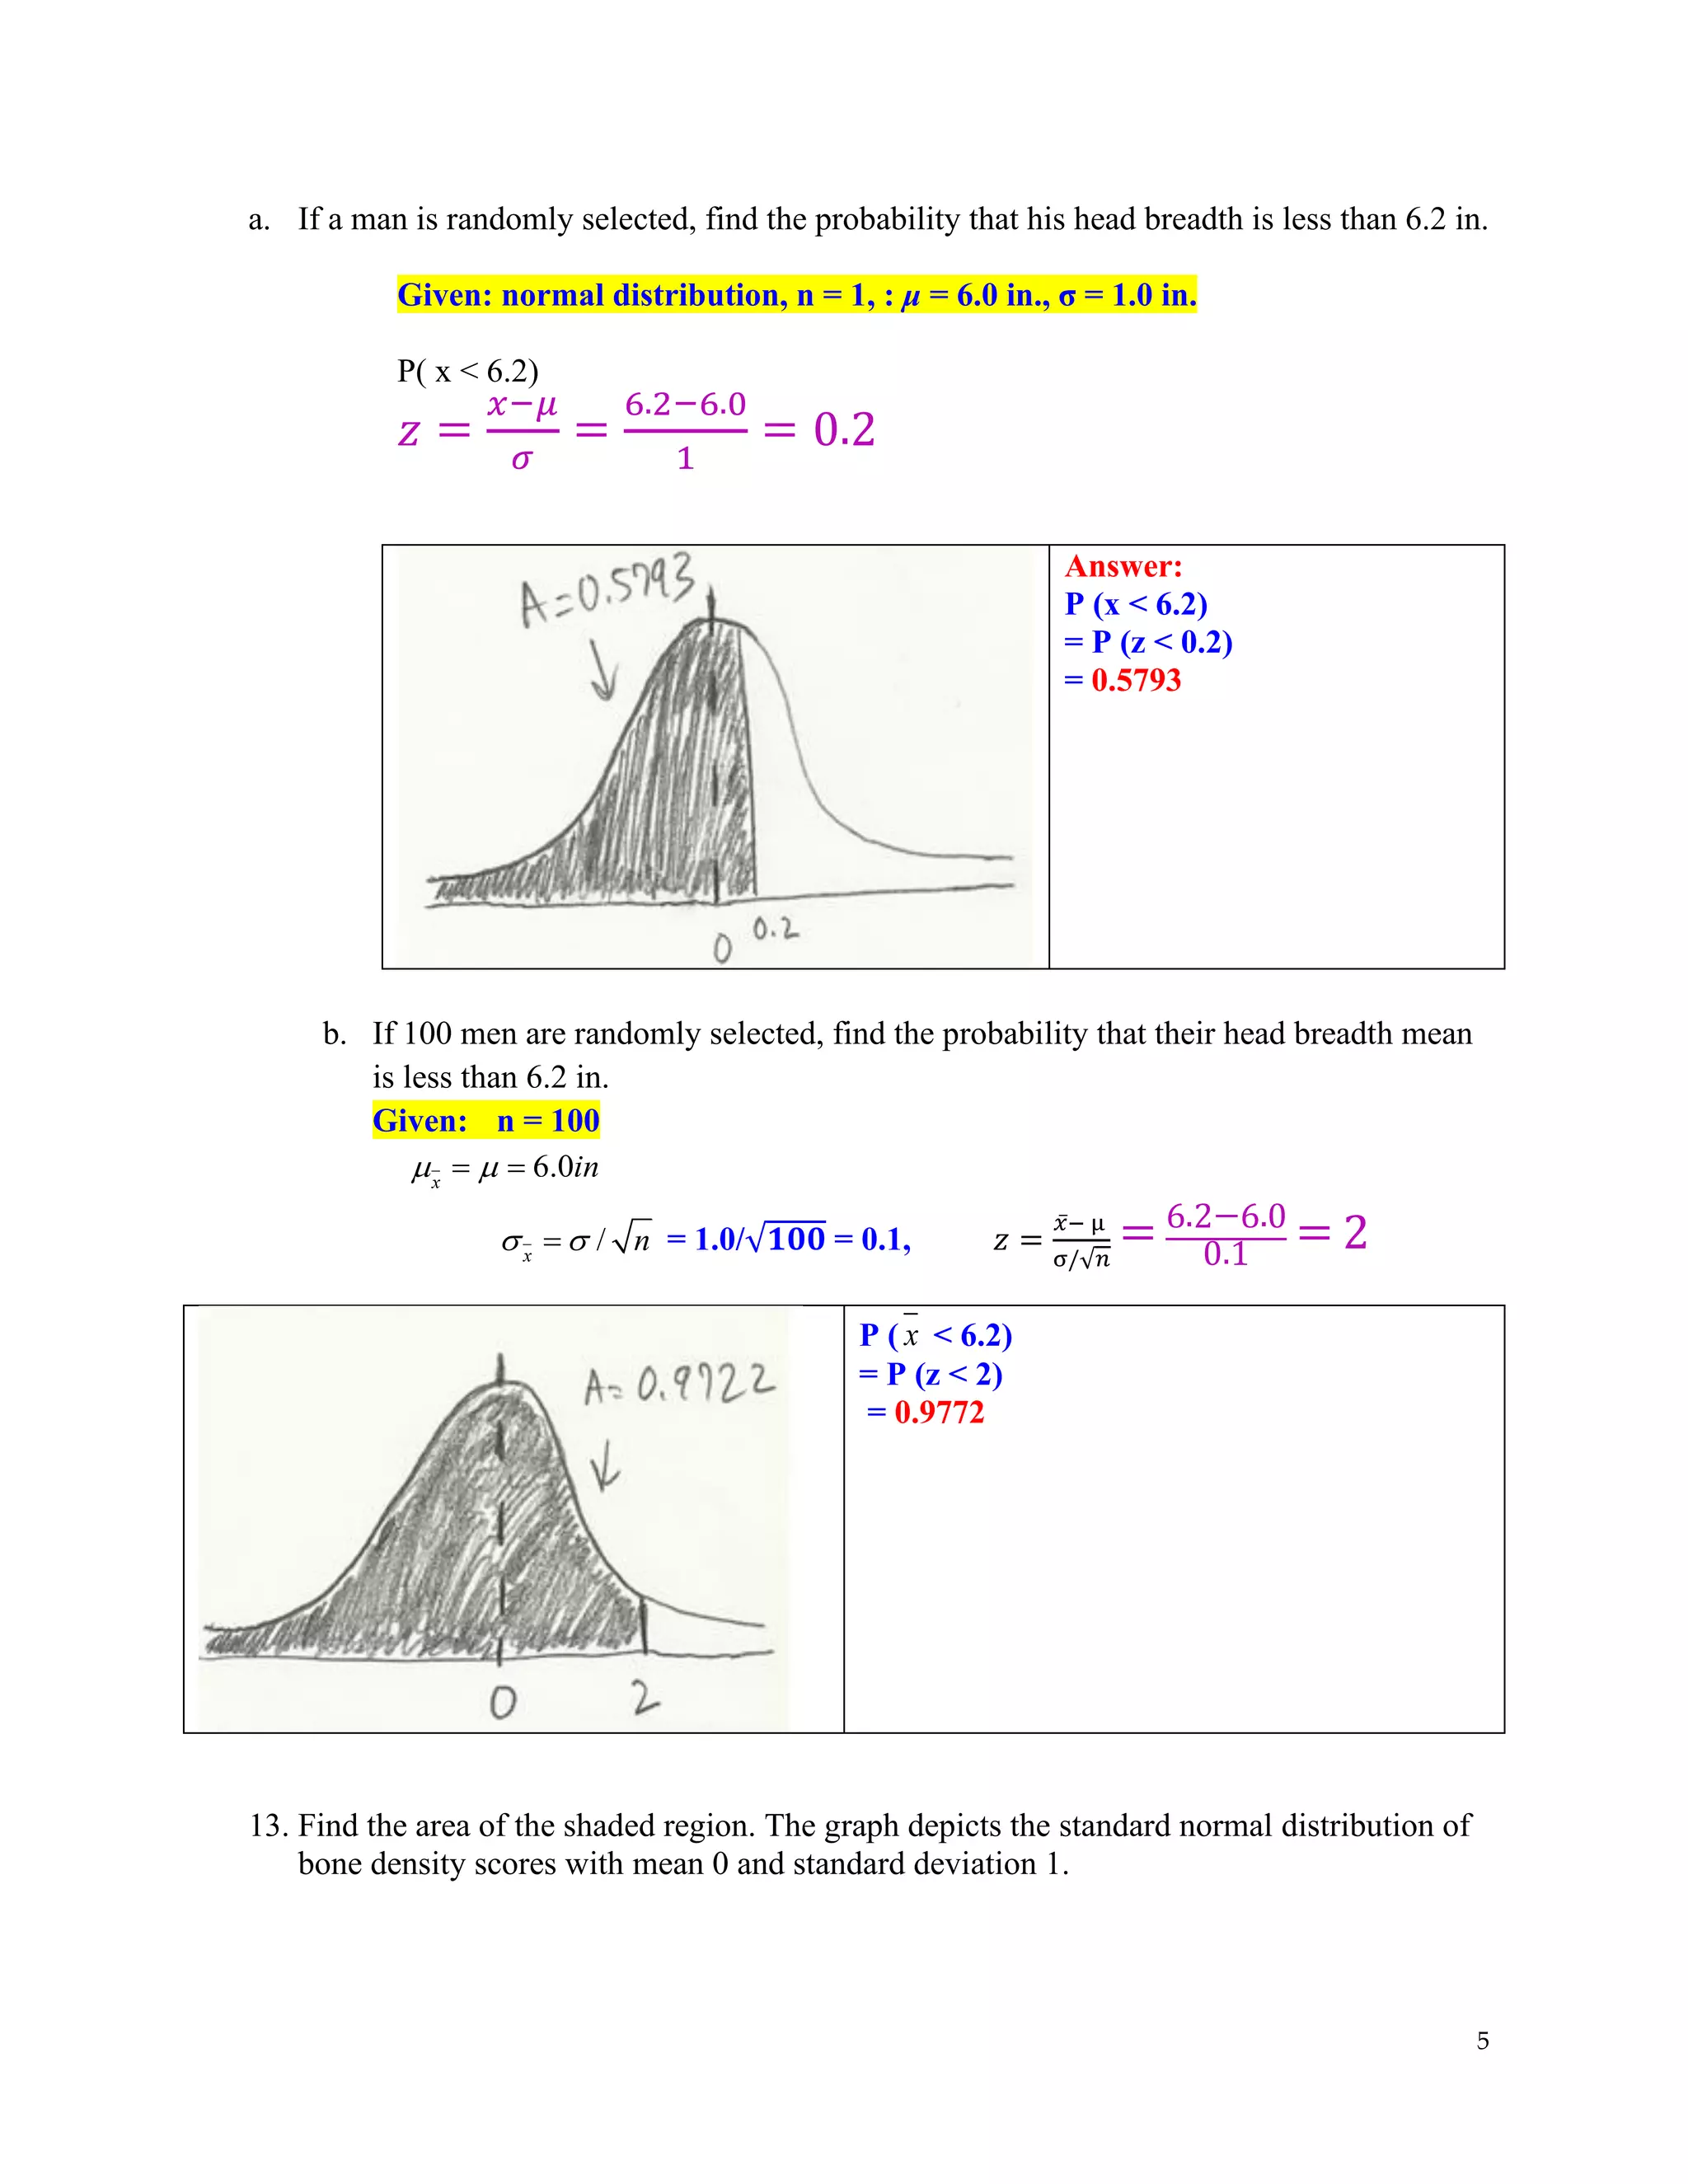
Probabilities related to normally distributed head breadths for individuals and sample mean calculations for random samples.
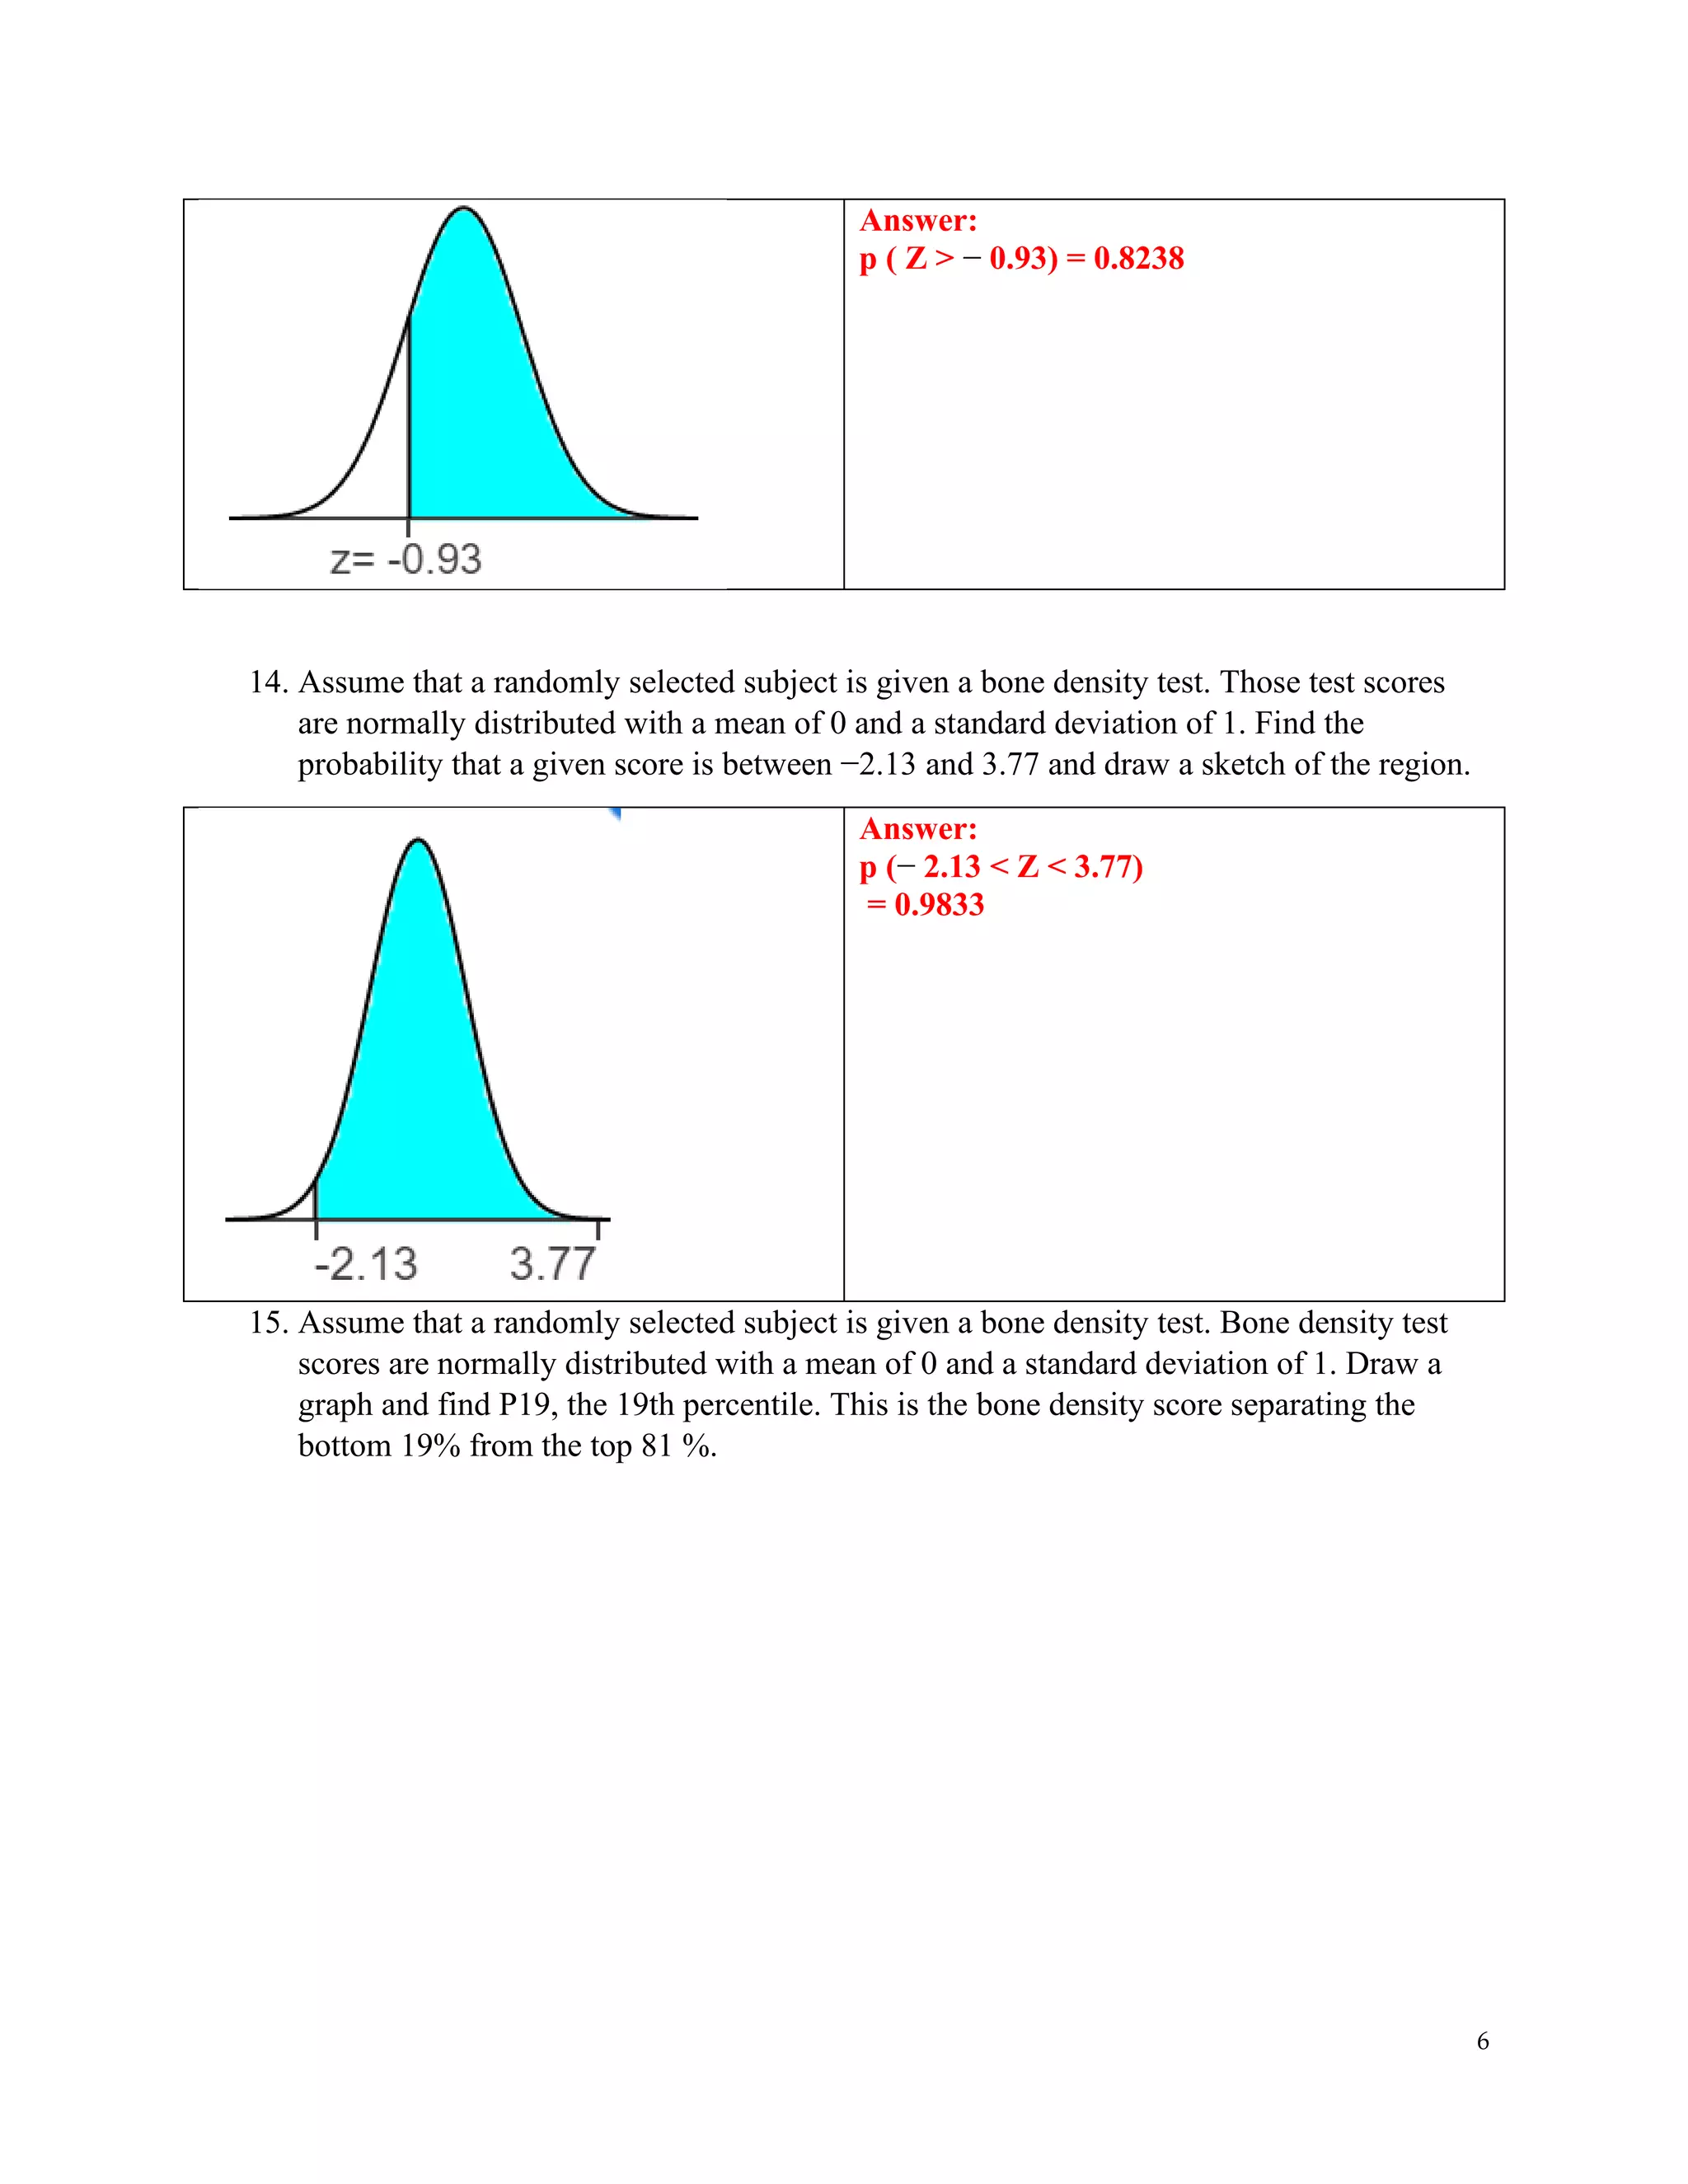
Analysis of bone density scores with z-scores, and calculating probabilities for various ranges of scores.
Constructing sampling distributions and comparing sample means to population means, confirming unbiased estimators.
Understanding the distribution of sample means and implications for normal distributions in age samples.
Calculating probabilities of overloading a boat based on different load limits and average weights of passengers.
Probability calculations for uniformly distributed waiting times at an airport security checkpoint.


