Downloaded 196 times
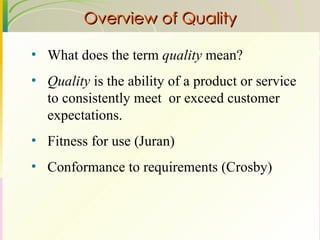
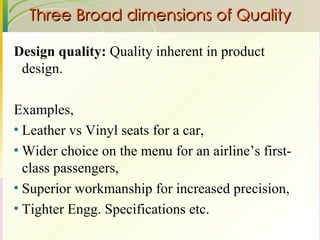
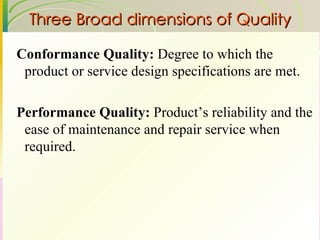
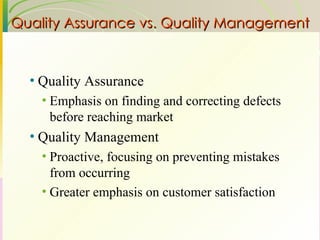
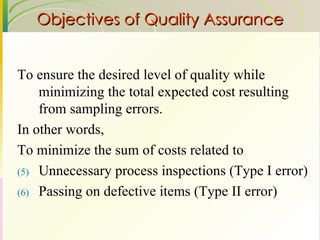
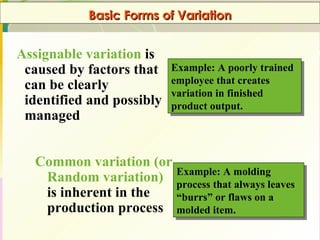
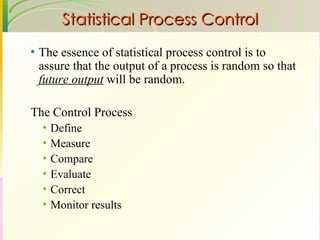
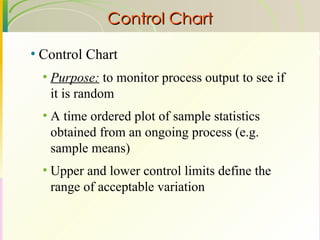
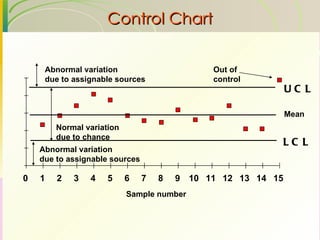
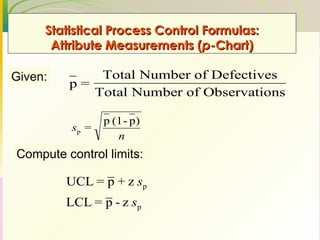
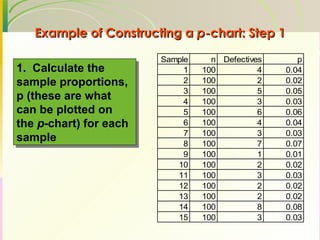
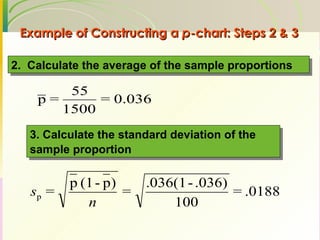
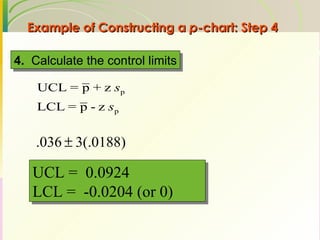
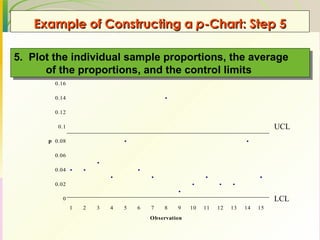
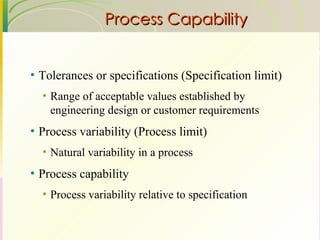
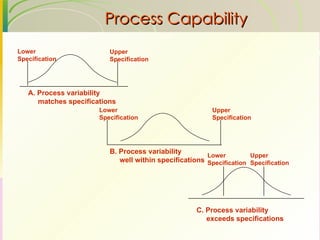
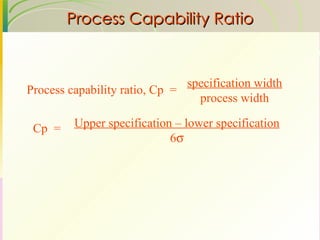

This document discusses quality assurance and statistical process control. It defines quality as meeting or exceeding customer expectations. It outlines three dimensions of quality: design quality, conformance quality, and performance quality. It also discusses objectives of quality assurance such as minimizing costs from inspection errors. Key aspects of statistical process control covered include control charts, process capability, sources of variation, and calculating control limits.


![Control Charts[1]](https://cdn.slidesharecdn.com/ss_thumbnails/controlcharts1-1226081330857138-9-thumbnail.jpg?width=640&height=640&fit=bounds)


![Working and functions_of_rbi[1]](https://cdn.slidesharecdn.com/ss_thumbnails/workingandfunctionsofrbi1-110522002449-phpapp01-thumbnail.jpg?width=640&height=640&fit=bounds)


![Csac10[1].p](https://cdn.slidesharecdn.com/ss_thumbnails/csac101-p-110520054545-phpapp01-thumbnail.jpg?width=640&height=640&fit=bounds)
![Csac08[1].p](https://cdn.slidesharecdn.com/ss_thumbnails/csac081-p-110520054521-phpapp01-thumbnail.jpg?width=640&height=640&fit=bounds)
![Csac05[1].p](https://cdn.slidesharecdn.com/ss_thumbnails/csac051-p-110520054504-phpapp01-thumbnail.jpg?width=640&height=640&fit=bounds)
![Csac14[1].p](https://cdn.slidesharecdn.com/ss_thumbnails/csac141-p-110520054443-phpapp02-thumbnail.jpg?width=640&height=640&fit=bounds)
![Csac06[1].p](https://cdn.slidesharecdn.com/ss_thumbnails/csac061-p-110520054419-phpapp01-thumbnail.jpg?width=640&height=640&fit=bounds)


