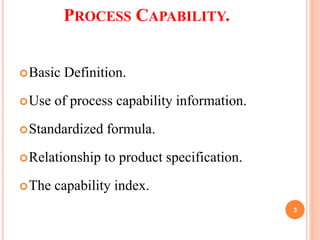
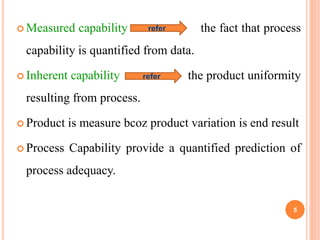
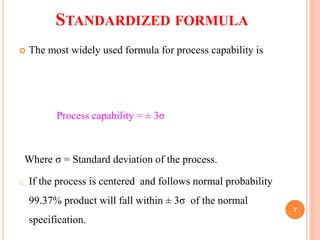
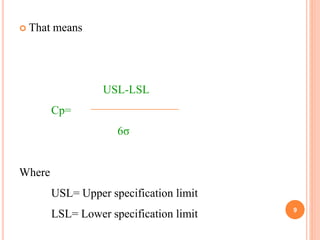
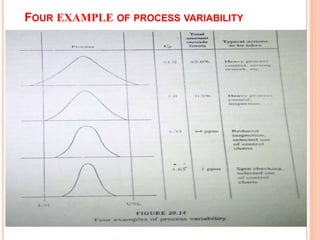
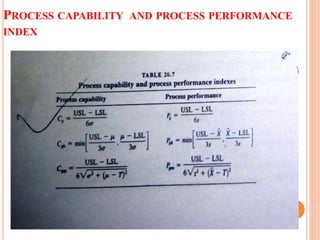
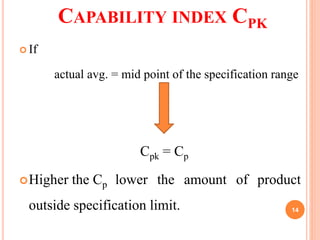
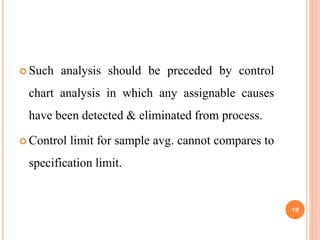
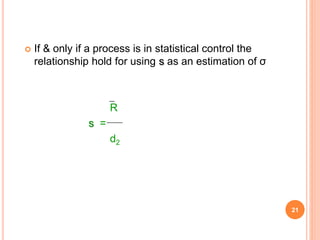
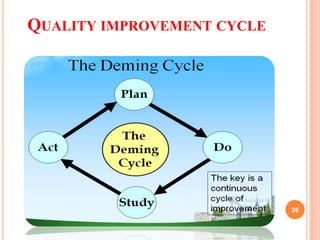
A SEMINAR ON
STATISTICAL PROCESS CONTROL
Prepared by
Sandesh Shah
M.PHARM 2ND SEM
(QAT)
PADM. DR. D. Y. PATIL COLLEGE OF PHARMACY,
AKURDI, PUNE.
CONTENT
 Process Capability.
 Types of Process Capability
 Estimating Inherent capability from a control chart
analysis.
 Assumption of statistical control & its effect on
process capability.
 Quality improvement - Juran’s 10 Steps & cycle
2
PROCESS CAPABILITY.
Basic Definition.
Use of process capability information.
Standardized formula.
Relationship to product specification.
The capability index.
3
BASIC DEFINITIONS
 Process some machine ,tools, methods
& people engaged in production.
 Capability an ability based on tested
performance to achieve measurable result.
 Process capability refers to the performance of the
process when it is operating in control.
4
 Measured capability the fact that process
capability is quantified from data.
 Inherent capability the product uniformity
resulting from process.
 Product is measure bcoz product variation is end result
 Process Capability provide a quantified prediction of
process adequacy.
5
USE OF PROCESS CAPABILITY INFORMATION
 Predicting the extent of variability that process will
exhibit.
 Choose most appropriate process to meet the tolerance.
 Planning the inter-relationship of sequential process.
 Assign the machines to work for which they are best
suited.
 Testing causing of defect during quality improvement
programs. 6
STANDARDIZED FORMULA
 The most widely used formula for process capability is
Process capability = ± 3σ
Where σ = Standard deviation of the process.
o If the process is centered and follows normal probability
99.37% product will fall within ± 3σ of the normal
specification.
7
RELATIONSHIP TO PRODUCT SPECIFICATION
 The major reason for quantifying Process Capability is to compute
the ability of the process to hold the specification.
 Planner try to select process within the 6σ Process Capability well
within the specification width.
 A measure of this relationship is the capability ratio
8
processtheofdeviationstandard
6σ
ionSpecificatLowerionSpecificatUpper




pC
 That means
USL-LSL
Cp=
6σ
Where
USL= Upper specification limit
LSL= Lower specification limit 9
FOUR EXAMPLE OF PROCESS VARIABILITY
10
PROCESS CAPABILITY AND PROCESS PERFORMANCE
INDEX
11
THE CAPABILITY INDEX (CPK)
 Cp index measures potential capability, assuming that
the process avg. is equal to the mid point of the
specification limit and the process is operating in
statistical control ; bcoz the avg. often not at the mid
point it is useful to have capability index that reflects
both variation and the location of the process avg.
 Such index is the capability index (Cpk) .
12
CAPABILITY INDEX CPK
13
populationprocesstheofdeviationstandard
meanprocessxwhere
LimitionSpecificatLowerx
or,
xLimitionSpecificatUpper
ofminimum







 




3
3
pkC
CAPABILITY INDEX CPK
 If
actual avg. = mid point of the specification range
Cpk = Cp
Higher the Cp lower the amount of product
outside specification limit. 14
CAPABILITY INDEX CPK
A capability index can also be calculated
around a target value rather than actual avg.
This index called as Taguchi index (Cpm).
Krishnamoorti & Khatwani (2000) propose
capability index for handling normal and non-
normal characteristic.
15
TYPES OF PROCESS CAPABILITY STUDIES
Study of process potential
An estimation is obtained of what the process can do under
certain condition.
The Cp index estimate potential process capability 16
Study of process performance.
An estimation of capability provides a picture of what the
process is doing over an extended period of time.
The Cpk index estimate performance process capability 17
ESTIMATING INHERENT CAPABILITY FROM A CONTROL
CHART ANALYSIS.
 In process potential study data are collected from
process operating without changes in:
-Material batches.
-Worker
-Tool
-Process setting.
 This short term evaluation uses consecutive
production over one time period
18
 Such analysis should be preceded by control
chart analysis in which any assignable causes
have been detected & eliminated from process.
 Control limit for sample avg. cannot compares to
specification limit.
19
To make comparison
Must convert R to the standard deviation for individual value.
Calculate ± 3σ limits.
Compare to specification limit. 20
 If & only if a process is in statistical control the
relationship hold for using s as an estimation of σ
R
s =
d2
21
ASSUMPTION OF STATISTICAL CONTROL & ITS EFFECT
ON PROCESS CAPABILITY
 There are five key assumption .
1. Process Stability:-
statistical validity requires a state of statistical
control with no drift or oscillation.
2. Normality of the characteristic being measured :-
Normality is needed to draw statistical interference
about the population.
3. Sufficient Data :-
is necessary to minimize the sampling error for the
capability index .
22
ASSUMPTION CONTI….
4. Representativeness of samples:-
must include random sample.
5. Independence of measurements:-
consecutive measurement cannot be
correlated.
 Are not theoretical refinements they are important condition
for applying capability index .
23
JURAN’S 10 STEPS TO QUALITY IMPROVEMENT
 1. Build awareness of both the need for
improvement and the opportunity for improvement
 2. Set goals for improvement
 3. Organize to meet the goals that have been set
 4. Provide training
 5. Implement projects aimed at solving problems
24
JURAN’S 10 STEPS TO QUALITY IMPROVEMENT
 6. Report progress
 7. Give recognition
 8. Communicate the results
 9. Keep score
 10. Maintain momentum by building
improvement into the company’s regular
systems
25
QUALITY IMPROVEMENT CYCLE
26
REFERENCES
1. Jurans quality planning and analysis ,fifth edition
,Tata Mc Graw hill Education PVT. LTD. Pg.no-
689-705.
27
28

Statistical process control

  • 1.
    A SEMINAR ON STATISTICALPROCESS CONTROL Prepared by Sandesh Shah M.PHARM 2ND SEM (QAT) PADM. DR. D. Y. PATIL COLLEGE OF PHARMACY, AKURDI, PUNE.
  • 2.
    CONTENT  Process Capability. Types of Process Capability  Estimating Inherent capability from a control chart analysis.  Assumption of statistical control & its effect on process capability.  Quality improvement - Juran’s 10 Steps & cycle 2
  • 3.
    PROCESS CAPABILITY. Basic Definition. Useof process capability information. Standardized formula. Relationship to product specification. The capability index. 3
  • 4.
    BASIC DEFINITIONS  Processsome machine ,tools, methods & people engaged in production.  Capability an ability based on tested performance to achieve measurable result.  Process capability refers to the performance of the process when it is operating in control. 4
  • 5.
     Measured capabilitythe fact that process capability is quantified from data.  Inherent capability the product uniformity resulting from process.  Product is measure bcoz product variation is end result  Process Capability provide a quantified prediction of process adequacy. 5
  • 6.
    USE OF PROCESSCAPABILITY INFORMATION  Predicting the extent of variability that process will exhibit.  Choose most appropriate process to meet the tolerance.  Planning the inter-relationship of sequential process.  Assign the machines to work for which they are best suited.  Testing causing of defect during quality improvement programs. 6
  • 7.
    STANDARDIZED FORMULA  Themost widely used formula for process capability is Process capability = ± 3σ Where σ = Standard deviation of the process. o If the process is centered and follows normal probability 99.37% product will fall within ± 3σ of the normal specification. 7
  • 8.
    RELATIONSHIP TO PRODUCTSPECIFICATION  The major reason for quantifying Process Capability is to compute the ability of the process to hold the specification.  Planner try to select process within the 6σ Process Capability well within the specification width.  A measure of this relationship is the capability ratio 8 processtheofdeviationstandard 6σ ionSpecificatLowerionSpecificatUpper     pC
  • 9.
     That means USL-LSL Cp= 6σ Where USL=Upper specification limit LSL= Lower specification limit 9
  • 10.
    FOUR EXAMPLE OFPROCESS VARIABILITY 10
  • 11.
    PROCESS CAPABILITY ANDPROCESS PERFORMANCE INDEX 11
  • 12.
    THE CAPABILITY INDEX(CPK)  Cp index measures potential capability, assuming that the process avg. is equal to the mid point of the specification limit and the process is operating in statistical control ; bcoz the avg. often not at the mid point it is useful to have capability index that reflects both variation and the location of the process avg.  Such index is the capability index (Cpk) . 12
  • 13.
  • 14.
    CAPABILITY INDEX CPK If actual avg. = mid point of the specification range Cpk = Cp Higher the Cp lower the amount of product outside specification limit. 14
  • 15.
    CAPABILITY INDEX CPK Acapability index can also be calculated around a target value rather than actual avg. This index called as Taguchi index (Cpm). Krishnamoorti & Khatwani (2000) propose capability index for handling normal and non- normal characteristic. 15
  • 16.
    TYPES OF PROCESSCAPABILITY STUDIES Study of process potential An estimation is obtained of what the process can do under certain condition. The Cp index estimate potential process capability 16
  • 17.
    Study of processperformance. An estimation of capability provides a picture of what the process is doing over an extended period of time. The Cpk index estimate performance process capability 17
  • 18.
    ESTIMATING INHERENT CAPABILITYFROM A CONTROL CHART ANALYSIS.  In process potential study data are collected from process operating without changes in: -Material batches. -Worker -Tool -Process setting.  This short term evaluation uses consecutive production over one time period 18
  • 19.
     Such analysisshould be preceded by control chart analysis in which any assignable causes have been detected & eliminated from process.  Control limit for sample avg. cannot compares to specification limit. 19
  • 20.
    To make comparison Mustconvert R to the standard deviation for individual value. Calculate ± 3σ limits. Compare to specification limit. 20
  • 21.
     If &only if a process is in statistical control the relationship hold for using s as an estimation of σ R s = d2 21
  • 22.
    ASSUMPTION OF STATISTICALCONTROL & ITS EFFECT ON PROCESS CAPABILITY  There are five key assumption . 1. Process Stability:- statistical validity requires a state of statistical control with no drift or oscillation. 2. Normality of the characteristic being measured :- Normality is needed to draw statistical interference about the population. 3. Sufficient Data :- is necessary to minimize the sampling error for the capability index . 22
  • 23.
    ASSUMPTION CONTI…. 4. Representativenessof samples:- must include random sample. 5. Independence of measurements:- consecutive measurement cannot be correlated.  Are not theoretical refinements they are important condition for applying capability index . 23
  • 24.
    JURAN’S 10 STEPSTO QUALITY IMPROVEMENT  1. Build awareness of both the need for improvement and the opportunity for improvement  2. Set goals for improvement  3. Organize to meet the goals that have been set  4. Provide training  5. Implement projects aimed at solving problems 24
  • 25.
    JURAN’S 10 STEPSTO QUALITY IMPROVEMENT  6. Report progress  7. Give recognition  8. Communicate the results  9. Keep score  10. Maintain momentum by building improvement into the company’s regular systems 25
  • 26.
  • 27.
    REFERENCES 1. Jurans qualityplanning and analysis ,fifth edition ,Tata Mc Graw hill Education PVT. LTD. Pg.no- 689-705. 27
  • 28.