Downloaded 468 times


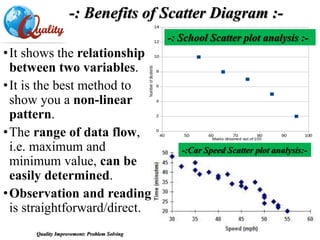
![Definitions :-
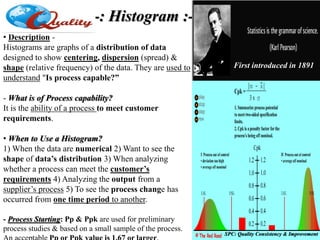
- Process Capability (Cp):
Cp is the capability, if the process was
perfectly centered between the specification
limits. A simple and straightforward
indicator of process capability.
- Process Capability Index (Cpk): Cpk is the
capability index, if the mean is centered
between the specification limits or not.
The ‘k’ stands for ‘Centralizing Factor.’
Example: “If you hunt or shoot targets with
arrow or gun try this analogy. If your shots are
falling in the same spot forming a good group
this is a high Cp, and when the sighting is
adjusted so this tight group of shots is landing
on the bulls-eye, you now have a high Cpk.”
“You must have a Cpk of 1.33 [4 sigma] or
higher to satisfy most customers.”
-: Histogram :-](https://image.slidesharecdn.com/spctraining-191026025837/85/Spc-training-29-320.jpg)

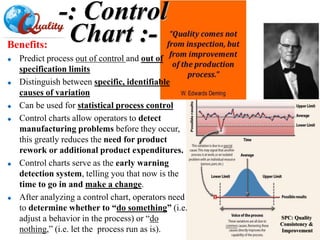

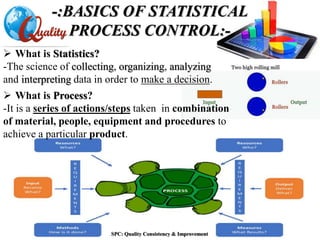
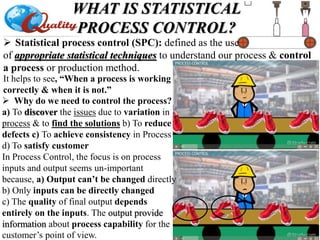
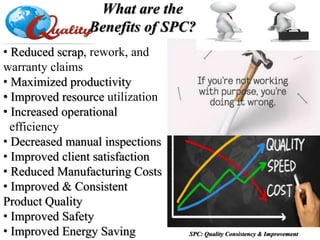
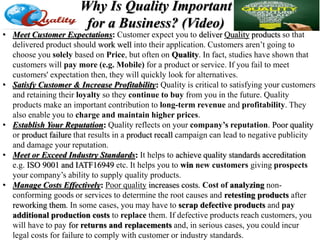
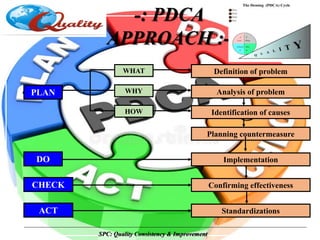
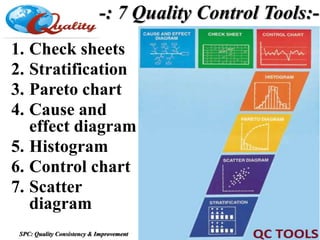
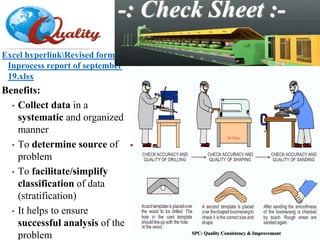
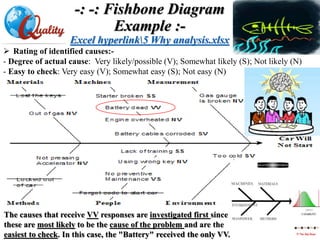
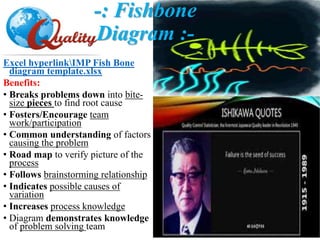
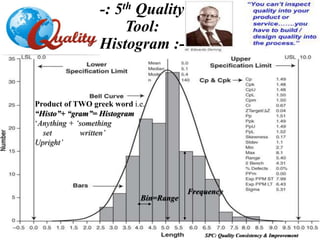
The document outlines a training program on Statistical Process Control (SPC) led by Mr. Prashant Kshirsagar, covering the history, basics, and benefits of SPC in quality improvement. It details various quality control tools, including check sheets, stratification, Pareto charts, and fishbone diagrams, aimed at enhancing process understanding and problem-solving. The training emphasizes the importance of maintaining product quality as a competitive advantage for businesses and lays out structured approaches like PDCA (Plan-Do-Check-Act) for effective quality management.


