Downloaded 769 times


![Summarizing SPC Charts Determining if the long term process average is rising, falling, or remaining the same. Identifying common causes of variation in our processes. Common cause refers to that fact that the processes we use contain sources of variation. We should seek to reduce or limit common causes of variation [i.e. improve the process capability]. Calling attention to data points which falls beyond the statistically determined control limits. Such points generally represent special causes of variation. Sometimes these data points can be attributed to individuals. By changing the behavior of some individuals we can improve results.](https://image.slidesharecdn.com/introduction-to-spc-1194278964343460-1/85/Introduction-To-SPC-15-320.jpg)


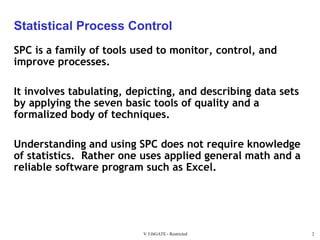
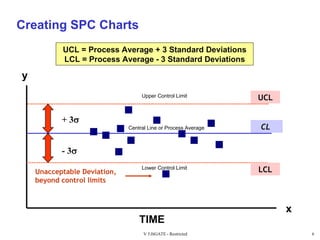
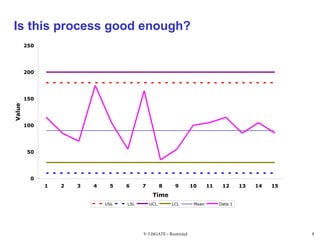
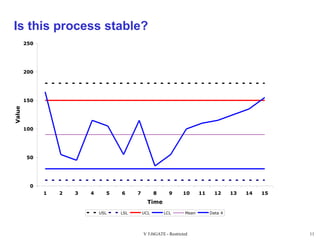
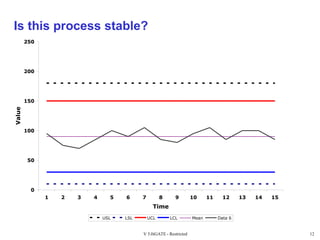
Statistical process control (SPC) uses tools like control charts to monitor processes and identify sources of variation. Control charts graphically display process data over time relative to control limits, showing whether the process average and variation are stable and capable of meeting specifications. SPC helps determine if a process is stable and capable over time by identifying trends, cycles, or data points outside control limits that indicate special causes of variation requiring process improvement.