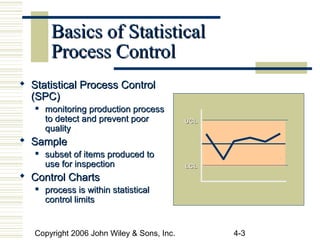
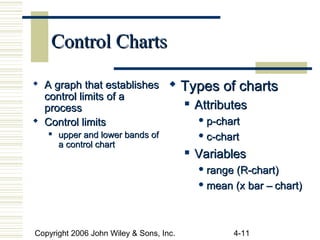
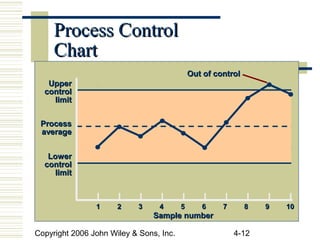
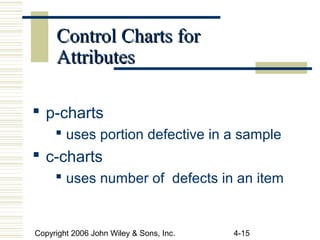
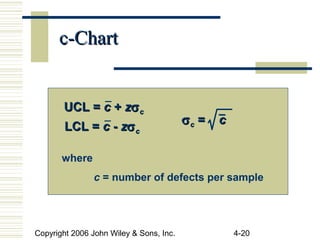
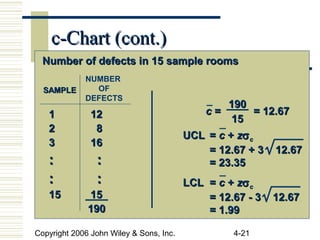
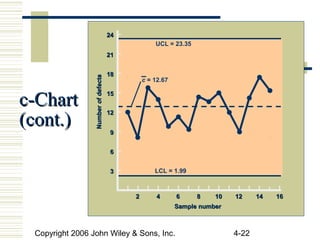
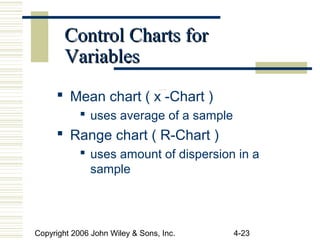
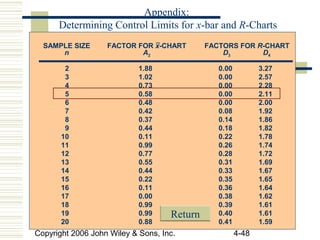
This document provides an overview of statistical process control (SPC) techniques. It discusses the basics of SPC and how it is used to monitor production processes to detect and prevent poor quality. Different types of control charts are introduced for attributes (p-charts and c-charts) and variables (x-bar charts and R-charts). Examples of each type of control chart are provided and explained. The document also discusses how SPC can be applied to service industries and where control charts are most useful.
Monitoring External Quality Assessment / Proficiency Testing Performance - Investigating the source of the problem.
In order to identify the source of the problem it is useful to be aware of the most common causes of poor EQA performance. Errors can occur at any
stage of the testing process however EQA is most concerned with detecting analytical errors i.e. errors that occur during the analysis of the sample.
Most analytical errors can be easily divided into three main areas; clerical errors, systematic errors and random errors. Systematic errors result in
inaccurate results that consistently show a positive or negative bias. Random errors on the other hand affect precision and result in fluctuations in
either direction.
Process Validation Master Planning DMAIC FusionGENEO
Process validation is a risk management verification activity for medical device and pharma companies. DMAIC is a well established methodology for improving process reliability, improving businesses and solving problems. This presentation discussed a logical fusion of these approaches. It includes a description of the validation life cycle. The business case for good validation is illustrated graphically. Contact us at ARVExcellence.com if you would like a copy.
ARV Excellence is a training and consulting firm based in Galway, Ireland with specialities in medical devices, and drug device combination product processes and process related problem solving
This presentation give you a brief knowledge of, how statistical process control applied in our daily lives, how it works and some of its important formulas,
Statistical process control (SPC) is a method of quality control which uses statistical methods. SPC is applied in order to monitor and control a process. Monitoring and controlling the process ensures that it operates at its full potential. At its full potential, the process can make as much conforming product as possible with a minimum (if not an elimination) of waste (rework or scrap). SPC can be applied to any process where the "conforming product" (product meeting specifications) output can be measured. Key tools used in SPC include control charts; a focus on continuous improvement; and the design of experiments. An example of a process where SPC is applied is manufacturing lines.
Management Of Business Operation Components PowerPoint Presentation SlidesSlideTeam
Management Of Business Operation Components PowerPoint Presentation Slides is specially-designed for astute business professionals. Use these components of operations management PowerPoint presentation to showcase various categories of infrastructure services as per your project. Elaborate on the global market size for many consecutive years using a bar graph. Represent the key areas of infrastructure investment, key drivers, and technological trends using our PPT slideshow. The key aspects of operations management PowerPoint theme is ideal to demonstrate the asset management process, lifecycle, framework, and condition assessment. Elucidate the deterministic, stochastic, and AI deterioration models to ascertain funding requirements. Take advantage of the state-of-the-art data visualizations to explain infrastructure optimization, and asset management decision journey. Walk the audience through the value-driven decision-making methodology. Employ our PPT layout to represent business infrastructure performance and cost functions. Illustrate critical infrastructure dependencies and interdependencies assessment framework. So download now to outline the key components like the lifecycle of contract management, and showcase the workflow management process. Our Management Of Business Operation Components PowerPoint Presentation Slides are explicit and effective. They combine clarity and concise expression. https://bit.ly/2L3Sc1h
Ethnobotany and Ethnopharmacology:
Ethnobotany in herbal drug evaluation,
Impact of Ethnobotany in traditional medicine,
New development in herbals,
Bio-prospecting tools for drug discovery,
Role of Ethnopharmacology in drug evaluation,
Reverse Pharmacology.
Students, digital devices and success - Andreas Schleicher - 27 May 2024..pptxEduSkills OECD
Andreas Schleicher presents at the OECD webinar ‘Digital devices in schools: detrimental distraction or secret to success?’ on 27 May 2024. The presentation was based on findings from PISA 2022 results and the webinar helped launch the PISA in Focus ‘Managing screen time: How to protect and equip students against distraction’ https://www.oecd-ilibrary.org/education/managing-screen-time_7c225af4-en and the OECD Education Policy Perspective ‘Students, digital devices and success’ can be found here - https://oe.cd/il/5yV
How to Make a Field invisible in Odoo 17Celine George
It is possible to hide or invisible some fields in odoo. Commonly using “invisible” attribute in the field definition to invisible the fields. This slide will show how to make a field invisible in odoo 17.
This is a presentation by Dada Robert in a Your Skill Boost masterclass organised by the Excellence Foundation for South Sudan (EFSS) on Saturday, the 25th and Sunday, the 26th of May 2024.
He discussed the concept of quality improvement, emphasizing its applicability to various aspects of life, including personal, project, and program improvements. He defined quality as doing the right thing at the right time in the right way to achieve the best possible results and discussed the concept of the "gap" between what we know and what we do, and how this gap represents the areas we need to improve. He explained the scientific approach to quality improvement, which involves systematic performance analysis, testing and learning, and implementing change ideas. He also highlighted the importance of client focus and a team approach to quality improvement.
Operation “Blue Star” is the only event in the history of Independent India where the state went into war with its own people. Even after about 40 years it is not clear if it was culmination of states anger over people of the region, a political game of power or start of dictatorial chapter in the democratic setup.
The people of Punjab felt alienated from main stream due to denial of their just demands during a long democratic struggle since independence. As it happen all over the word, it led to militant struggle with great loss of lives of military, police and civilian personnel. Killing of Indira Gandhi and massacre of innocent Sikhs in Delhi and other India cities was also associated with this movement.
Palestine last event orientationfvgnh .pptxRaedMohamed3
An EFL lesson about the current events in Palestine. It is intended to be for intermediate students who wish to increase their listening skills through a short lesson in power point.
1. Copyright 2006 John Wiley & Sons, Inc.Copyright 2006 John Wiley & Sons, Inc.
Beni AsllaniBeni Asllani
University of Tennessee at ChattanoogaUniversity of Tennessee at Chattanooga
Statistical Process ControlStatistical Process Control
Operations Management - 5th
EditionOperations Management - 5th
Edition
Chapter 4Chapter 4
Roberta Russell & Bernard W. Taylor, IIIRoberta Russell & Bernard W. Taylor, III
2. Copyright 2006 John Wiley & Sons, Inc. 4-2
Lecture OutlineLecture Outline
Basics of Statistical Process ControlBasics of Statistical Process Control
Control ChartsControl Charts
Control Charts for AttributesControl Charts for Attributes
Control Charts for VariablesControl Charts for Variables
Control Chart PatternsControl Chart Patterns
SPC with ExcelSPC with Excel
Process CapabilityProcess Capability
3. Copyright 2006 John Wiley & Sons, Inc. 4-3
Basics of StatisticalBasics of Statistical
Process ControlProcess Control
Statistical Process ControlStatistical Process Control
(SPC)(SPC)
monitoring production processmonitoring production process
to detect and prevent poorto detect and prevent poor
qualityquality
SampleSample
subset of items produced tosubset of items produced to
use for inspectionuse for inspection
Control ChartsControl Charts
process is within statisticalprocess is within statistical
control limitscontrol limits
UCLUCL
LCLLCL
4. Copyright 2006 John Wiley & Sons, Inc. 4-4
VariabilityVariability
RandomRandom
common causescommon causes
inherent in a processinherent in a process
can be eliminatedcan be eliminated
only throughonly through
improvements in theimprovements in the
systemsystem
Non-RandomNon-Random
special causesspecial causes
due to identifiabledue to identifiable
factorsfactors
can be modifiedcan be modified
through operator orthrough operator or
management actionmanagement action
5. Copyright 2006 John Wiley & Sons, Inc. 4-5
SPC in TQMSPC in TQM
SPCSPC
tool for identifying problems andtool for identifying problems and
make improvementsmake improvements
contributes to the TQM goal ofcontributes to the TQM goal of
continuous improvementscontinuous improvements
6. Copyright 2006 John Wiley & Sons, Inc. 4-6
Quality MeasuresQuality Measures
AttributeAttribute
a product characteristic that can bea product characteristic that can be
evaluated with a discrete responseevaluated with a discrete response
good – bad; yes - nogood – bad; yes - no
VariableVariable
a product characteristic that is continuousa product characteristic that is continuous
and can be measuredand can be measured
weight - lengthweight - length
7. Copyright 2006 John Wiley & Sons, Inc. 4-7
Nature of defect is different in servicesNature of defect is different in services
Service defect is a failure to meetService defect is a failure to meet
customer requirementscustomer requirements
Monitor times, customer satisfactionMonitor times, customer satisfaction
Applying SPC toApplying SPC to
ServiceService
8. Copyright 2006 John Wiley & Sons, Inc. 4-8
Applying SPC toApplying SPC to
Service (cont.)Service (cont.)
HospitalsHospitals
timeliness and quickness of care, staff responses to requests,timeliness and quickness of care, staff responses to requests,
accuracy of lab tests, cleanliness, courtesy, accuracy ofaccuracy of lab tests, cleanliness, courtesy, accuracy of
paperwork, speed of admittance and checkoutspaperwork, speed of admittance and checkouts
Grocery StoresGrocery Stores
waiting time to check out, frequency of out-of-stock items,waiting time to check out, frequency of out-of-stock items,
quality of food items, cleanliness, customer complaints,quality of food items, cleanliness, customer complaints,
checkout register errorscheckout register errors
AirlinesAirlines
flight delays, lost luggage and luggage handling, waiting timeflight delays, lost luggage and luggage handling, waiting time
at ticket counters and check-in, agent and flight attendantat ticket counters and check-in, agent and flight attendant
courtesy, accurate flight information, passenger cabincourtesy, accurate flight information, passenger cabin
cleanliness and maintenancecleanliness and maintenance
9. Copyright 2006 John Wiley & Sons, Inc. 4-9
Applying SPC toApplying SPC to
Service (cont.)Service (cont.)
Fast-Food RestaurantsFast-Food Restaurants
waiting time for service, customer complaints,waiting time for service, customer complaints,
cleanliness, food quality, order accuracy, employeecleanliness, food quality, order accuracy, employee
courtesycourtesy
Catalogue-Order CompaniesCatalogue-Order Companies
order accuracy, operator knowledge and courtesy,order accuracy, operator knowledge and courtesy,
packaging, delivery time, phone order waiting timepackaging, delivery time, phone order waiting time
Insurance CompaniesInsurance Companies
billing accuracy, timeliness of claims processing,billing accuracy, timeliness of claims processing,
agent availability and response timeagent availability and response time
10. Copyright 2006 John Wiley & Sons, Inc. 4-10
Where to Use Control ChartsWhere to Use Control Charts
Process has a tendency to go out of controlProcess has a tendency to go out of control
Process is particularly harmful and costly if itProcess is particularly harmful and costly if it
goes out of controlgoes out of control
ExamplesExamples
at the beginning of a process because it is a waste ofat the beginning of a process because it is a waste of
time and money to begin production process with badtime and money to begin production process with bad
suppliessupplies
before a costly or irreversible point, after which productbefore a costly or irreversible point, after which product
is difficult to rework or correctis difficult to rework or correct
before and after assembly or painting operations thatbefore and after assembly or painting operations that
might cover defectsmight cover defects
before the outgoing final product or service is deliveredbefore the outgoing final product or service is delivered
11. Copyright 2006 John Wiley & Sons, Inc. 4-11
Control ChartsControl Charts
A graph that establishesA graph that establishes
control limits of acontrol limits of a
processprocess
Control limitsControl limits
upper and lower bands ofupper and lower bands of
a control charta control chart
Types of chartsTypes of charts
AttributesAttributes
p-chartp-chart
c-chartc-chart
VariablesVariables
range (R-chart)range (R-chart)
mean (x bar – chart)mean (x bar – chart)
12. Copyright 2006 John Wiley & Sons, Inc. 4-12
Process ControlProcess Control
ChartChart
11 22 33 44 55 66 77 88 99 1010
Sample numberSample number
UpperUpper
controlcontrol
limitlimit
ProcessProcess
averageaverage
LowerLower
controlcontrol
limitlimit
Out of controlOut of control
13. Copyright 2006 John Wiley & Sons, Inc. 4-13
Normal DistributionNormal Distribution
µµ=0=0 11σσ 22σσ 33σσ-1-1σσ-2-2σσ-3-3σσ
95%
99.74%
14. Copyright 2006 John Wiley & Sons, Inc. 4-14
A Process Is inA Process Is in
Control If …Control If …
1. … no sample points outside limits
2. … most points near process average
3. … about equal number of points above
and below centerline
4. … points appear randomly distributed
15. Copyright 2006 John Wiley & Sons, Inc. 4-15
Control Charts forControl Charts for
AttributesAttributes
p-charts
uses portion defective in a sample
c-charts
uses number of defects in an item
16. Copyright 2006 John Wiley & Sons, Inc. 4-16
p-Chartp-Chart
UCL = p + zσp
LCL = p - zσp
z = number of standard
deviations from process average
p = sample proportion
defective; an estimate of process average
σp = standard deviation of sample
proportion
σσpp ==
pp(1 -(1 - pp))
nn
17. Copyright 2006 John Wiley & Sons, Inc. 4-17
p-Chart Examplep-Chart Example
20 samples of 100 pairs of jeans20 samples of 100 pairs of jeans
NUMBER OFNUMBER OF PROPORTIONPROPORTION
SAMPLESAMPLE DEFECTIVESDEFECTIVES DEFECTIVEDEFECTIVE
11 66 .06.06
22 00 .00.00
33 44 .04.04
:: :: ::
:: :: ::
2020 1818 .18.18
200200
18. Copyright 2006 John Wiley & Sons, Inc. 4-18
p-Chart Example (cont.)p-Chart Example (cont.)
UCL = p + z = 0.10 + 3
p(1 - p)
n
0.10(1 - 0.10)
100
UCL = 0.190
LCL = 0.010
LCL = p - z = 0.10 - 3
p(1 - p)
n
0.10(1 - 0.10)
100
= 200 / 20(100) = 0.10
total defectives
total sample observations
p =
20. Copyright 2006 John Wiley & Sons, Inc. 4-20
c-Chartc-Chart
UCL =UCL = cc ++ zzσσcc
LCL =LCL = cc -- zzσσcc
where
c = number of defects per sample
σσcc == cc
21. Copyright 2006 John Wiley & Sons, Inc. 4-21
c-Chart (cont.)c-Chart (cont.)
Number of defects in 15 sample roomsNumber of defects in 15 sample rooms
1 121 12
2 82 8
3 163 16
: :: :
: :: :
15 1515 15
190190
SAMPLESAMPLE
cc = = 12.67= = 12.67
190190
1515
UCLUCL == cc ++ zzσσcc
= 12.67 + 3 12.67= 12.67 + 3 12.67
= 23.35= 23.35
LCLLCL == cc ++ zzσσcc
= 12.67 - 3 12.67= 12.67 - 3 12.67
= 1.99= 1.99
NUMBER
OF
DEFECTS
22. Copyright 2006 John Wiley & Sons, Inc. 4-22
33
66
99
1212
1515
1818
2121
2424
NumberofdefectsNumberofdefects
Sample numberSample number
22 44 66 88 1010 1212 1414 1616
UCL = 23.35
LCL = 1.99
c = 12.67
c-Chartc-Chart
(cont.)(cont.)
23. Copyright 2006 John Wiley & Sons, Inc. 4-23
Control Charts forControl Charts for
VariablesVariables
Mean chart ( x -Chart )
uses average of a sample
Range chart ( R-Chart )
uses amount of dispersion in a
sample
24. Copyright 2006 John Wiley & Sons, Inc. 4-24
x-bar Chartx-bar Chart
xx ==
xx11 ++ xx22 + ...+ ... xxkk
kk
==
UCL =UCL = xx ++ AA22RR LCL =LCL = xx -- AA22RR== ==
wherewhere
xx = average of sample means= average of sample means
==
28. Copyright 2006 John Wiley & Sons, Inc. 4-28
R- ChartR- Chart
UCL =UCL = DD44RR LCL =LCL = DD33RR
RR ==
∑RR
kk
wherewhere
RR = range of each sample= range of each sample
kk = number of samples= number of samples
30. Copyright 2006 John Wiley & Sons, Inc. 4-30
R-Chart Example (cont.)R-Chart Example (cont.)
Example 15.3Example 15.3
∑R
k
R = = = 0.115
1.15
10
UCL = D4R = 2.11(0.115) = 0.243
LCL = D3R = 0(0.115) = 0
Retrieve Factor Values DRetrieve Factor Values D33 and Dand D44
31. Copyright 2006 John Wiley & Sons, Inc. 4-31
R-Chart Example (cont.)R-Chart Example (cont.)
UCL = 0.243
LCL = 0
Range
Sample number
R = 0.115
|
1
|
2
|
3
|
4
|
5
|
6
|
7
|
8
|
9
|
10
0.28 –
0.24 –
0.20 –
0.16 –
0.12 –
0.08 –
0.04 –
0 –
32. Copyright 2006 John Wiley & Sons, Inc. 4-32
Using x- bar and R-ChartsUsing x- bar and R-Charts
TogetherTogether
Process average and process variability must be
in control.
It is possible for samples to have very narrow
ranges, but their averages is beyond control
limits.
It is possible for sample averages to be in
control, but ranges might be very large.
33. Copyright 2006 John Wiley & Sons, Inc. 4-33
Control Chart PatternsControl Chart Patterns
UCLUCL
LCLLCL
Sample observationsSample observations
consistently above theconsistently above the
center linecenter line
LCLLCL
UCLUCL
Sample observationsSample observations
consistently below theconsistently below the
center linecenter line
35. Copyright 2006 John Wiley & Sons, Inc. 4-35
Zones for Pattern TestsZones for Pattern Tests
UCL
LCL
Zone A
Zone B
Zone C
Zone C
Zone B
Zone A
Process
average
3 sigma = x + A2R
=
3 sigma = x - A2R
=
2 sigma = x + (A2R)
= 2
3
2 sigma = x - (A2R)
= 2
3
1 sigma = x + (A2R)
= 1
3
1 sigma = x - (A2R)
= 1
3
x
=
Sample number
|
1
|
2
|
3
|
4
|
5
|
6
|
7
|
8
|
9
|
10
|
11
|
12
|
13
36. Copyright 2006 John Wiley & Sons, Inc. 4-36
Control Chart PatternsControl Chart Patterns
8 consecutive points on one side of the center line
8 consecutive points up or down across zones
14 points alternating up or down
2 out of 3 consecutive points in zone A but still
inside the control limits
4 out of 5 consecutive points in zone A or B
37. Copyright 2006 John Wiley & Sons, Inc. 4-37
Performing a Pattern TestPerforming a Pattern Test
11 4.984.98 BB —— BB
22 5.005.00 BB UU CC
33 4.954.95 BB DD AA
44 4.964.96 BB DD AA
55 4.994.99 BB UU CC
66 5.015.01 —— UU CC
77 5.025.02 AA UU CC
88 5.055.05 AA UU BB
99 5.085.08 AA UU AA
1010 5.035.03 AA DD BB
SAMPLESAMPLE xx ABOVE/BELOWABOVE/BELOW UP/DOWNUP/DOWN ZONEZONE
38. Copyright 2006 John Wiley & Sons, Inc. 4-38
Sample SizeSample Size
Attribute charts require larger sample
sizes
50 to 100 parts in a sample
Variable charts require smaller samples
2 to 10 parts in a sample
39. Copyright 2006 John Wiley & Sons, Inc. 4-39
SPC with ExcelSPC with Excel
UCL=0.19
LCL=0.01
40. Copyright 2006 John Wiley & Sons, Inc. 4-40
SPC with Excel:SPC with Excel:
FormulasFormulas
41. Copyright 2006 John Wiley & Sons, Inc. 4-41
Process CapabilityProcess Capability
TolerancesTolerances
design specifications reflecting productdesign specifications reflecting product
requirementsrequirements
Process capabilityProcess capability
range of natural variability in a process whatrange of natural variability in a process what
we measure with control chartswe measure with control charts
42. Copyright 2006 John Wiley & Sons, Inc. 4-42
Process CapabilityProcess Capability
(b) Design specifications(b) Design specifications
and natural variation theand natural variation the
same; process is capablesame; process is capable
of meeting specificationsof meeting specifications
most of the time.most of the time.
DesignDesign
SpecificationsSpecifications
ProcessProcess
(a) Natural variation(a) Natural variation
exceeds designexceeds design
specifications; processspecifications; process
is not capable ofis not capable of
meeting specificationsmeeting specifications
all the time.all the time.
DesignDesign
SpecificationsSpecifications
ProcessProcess
43. Copyright 2006 John Wiley & Sons, Inc. 4-43
Process Capability (cont.)Process Capability (cont.)
(c) Design specifications(c) Design specifications
greater than naturalgreater than natural
variation; process isvariation; process is
capable of alwayscapable of always
conforming toconforming to
specifications.specifications.
DesignDesign
SpecificationsSpecifications
ProcessProcess
(d) Specifications greater(d) Specifications greater
than natural variation, butthan natural variation, but
process off center;process off center;
capable but some outputcapable but some output
will not meet upperwill not meet upper
specification.specification.
DesignDesign
SpecificationsSpecifications
ProcessProcess
44. Copyright 2006 John Wiley & Sons, Inc. 4-44
Process Capability MeasuresProcess Capability Measures
Process Capability Ratio
Cp =
=
tolerance range
process range
upper specification limit -
lower specification limit
6σ
45. Copyright 2006 John Wiley & Sons, Inc. 4-45
Computing CComputing Cpp
Net weight specification = 9.0 oz ± 0.5 oz
Process mean = 8.80 oz
Process standard deviation = 0.12 oz
Cp =
= = 1.39
upper specification limit -
lower specification limit
6σ
9.5 - 8.5
6(0.12)
46. Copyright 2006 John Wiley & Sons, Inc. 4-46
Process Capability MeasuresProcess Capability Measures
Process Capability IndexProcess Capability Index
CCpkpk = minimum= minimum
xx - lower specification limit- lower specification limit
33σσ
==
upper specification limit -upper specification limit - xx
33σσ
==
,,
47. Copyright 2006 John Wiley & Sons, Inc. 4-47
Computing CComputing Cpkpk
Net weight specification = 9.0 oz ± 0.5 oz
Process mean = 8.80 oz
Process standard deviation = 0.12 oz
Cpk = minimum
= minimum , = 0.83
x - lower specification limit
3σ
=
upper specification limit - x
3σ
=
,
8.80 - 8.50
3(0.12)
9.50 - 8.80
3(0.12)
49. Copyright 2006 John Wiley & Sons, Inc. 4-49
Copyright 2006 John Wiley & Sons, Inc.Copyright 2006 John Wiley & Sons, Inc.
All rights reserved. Reproduction or translation of this work beyond thatAll rights reserved. Reproduction or translation of this work beyond that
permitted in section 117 of the 1976 United States Copyright Act withoutpermitted in section 117 of the 1976 United States Copyright Act without
express permission of the copyright owner is unlawful. Request for furtherexpress permission of the copyright owner is unlawful. Request for further
information should be addressed to the Permission Department, John Wiley &information should be addressed to the Permission Department, John Wiley &
Sons, Inc. The purchaser may make back-up copies for his/her own use only andSons, Inc. The purchaser may make back-up copies for his/her own use only and
not for distribution or resale. The Publisher assumes no responsibility fornot for distribution or resale. The Publisher assumes no responsibility for
errors, omissions, or damages caused by the use of these programs or from theerrors, omissions, or damages caused by the use of these programs or from the
use of the information herein.use of the information herein.