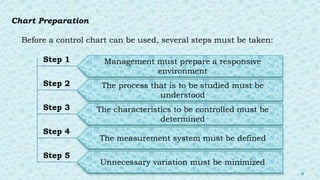
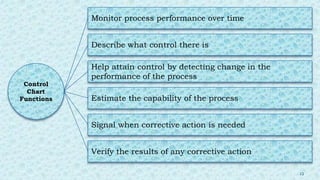
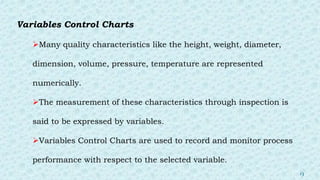
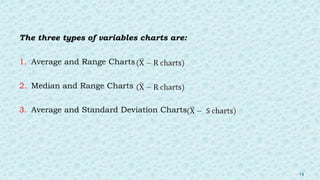
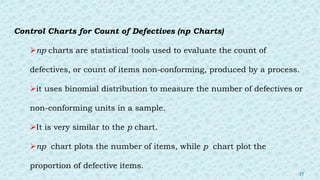
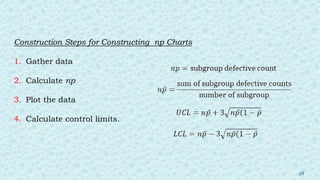
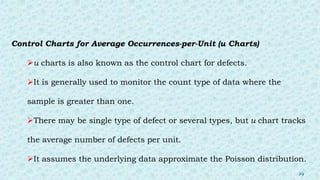
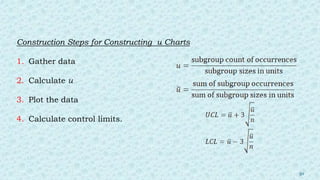
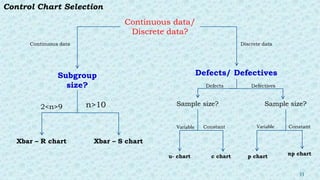
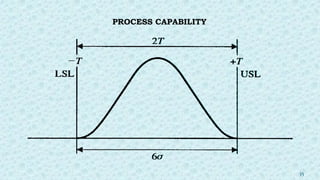
STATISTICAL PROCESS CONTROL
Presented by
Mr. R. ARUN KUMAR, B.Pharm.,
M.Pharm (PQA) - I Year,
Department of Pharmacy,
Annamalai University.
Submitted to
Dr. K. DEVI, M.Pharm., Ph.D.,
Assistant Professor,
Department of Pharmacy,
Annamalai University.
MQA102T – QUALITY MANAGEMENT SYSTEMS
Statistical Process Control (SPC)
DEFINITION:
 Statistical Process Control is a statistical method to measure,
monitor and control a process.
It is a scientific visual method to monitor, control and improve the
process by eliminating special cause variation in a process.
It evaluates people, materials, methods, machines, and processes by
stressing prevention rather than detection.
2
3
It is a fast feedback system.
The SPC concepts are include in the management philosophy by
Dr.W.E. Deming just before World War II.
Though SPC effectively used in western industries since 1980, it
was started during twenties in America.
SPC became famous after Japanese industries implement the
concepts and complete with western industries.
The Terms,
Statistics – It is a science which deals with a collection,
summarization, analysis and drawing information from data.
Process – It converts input resources into the desired output.
Control – System, policies and procedures in place the overall
output meets the requirement.
4
SPC
Benefits
5
Importance
of
SPC
Visibility into quality data prevents over-tampering
Control charts provide operational insight for critical
stakeholders
Data accessibility and visibility levels the playing field
Real – time SPC helps reduce the margin of error
6
7
Minitab
QDM SPC
Platform
SQCpack
GainSeeker
Suite
Statgraphics
Dot
Compliance
QMS
Predator
Software
IntraStage
WATS
SPC for
Excel
SPC software:
CONTROL CHARTS:
The control chart was invented by Walter A Shewhart in 1924.
A chart that shows plotted values, a central line, and one or two
control limits and is used to monitor a process over time.
− most important tools of SPC
− simple
− verifying the results of any improvement actions taken
8
− powerful tools for checking the stability of a process over
time
The power of the control chart is in its ability to separate these
assignable causes of quality variation from inherent, unavoidable
causes.
The two categories of control charts:
1. Variables Control Charts
2. Attribute Control Charts
9
10
CONTROL CHART
Chart Preparation
Before a control chart can be used, several steps must be taken:
Management must prepare a responsive
environment
The process that is to be studied must be
understood
Unnecessary variation must be minimized
The characteristics to be controlled must be
determined
The measurement system must be defined
Step 1
Step 2
Step 3
Step 4
Step 5
11
Control
Chart
Functions
Monitor process performance over time
Describe what control there is
Verify the results of any corrective action
Signal when corrective action is needed
Estimate the capability of the process
Help attain control by detecting change in the
performance of the process
12
Variables Control Charts
Many quality characteristics like the height, weight, diameter,
dimension, volume, pressure, temperature are represented
numerically.
The measurement of these characteristics through inspection is
said to be expressed by variables.
Variables Control Charts are used to record and monitor process
performance with respect to the selected variable.
13
14
The three types of variables charts are:
1. Average and Range Charts
2. Median and Range Charts
3. Average and Standard Deviation Charts
Average-Range Charts
It is one of the most powerful and sensitive SPC tools.
It can be applied to any continuous variable like weight, size, cycle
time and error rate.
Subgroup size is 2 -10.
These charts are widely used control chart for variable data to
examine the process stability in many industries.
15
Steps used in preparing :
1. Properly label the chart.
2. Collect and record data.
3. Select scales.
4. Plot data.
5. Develop chart
Establish centerline
Calculate control limits
16
6. Develop chart:
Establish centerline
Calculate control limits
7. Draw lines on control chart.
8. Interpret chart.
17
Median-Range Charts
Median and Range control charts is very similar to those for
Average-Range charts.
Steps used to develop :
1. Label chart.
2. Collect data, establish scales and plot all data.
3. Develop R chart
18
4. Develop chart
5. Draw centerlines and control limits.
6. Interpret chart.
19
Average-Standard Deviation Charts
The same approach is taken in developing Average and
Standard Deviation Charts as for .
are used for sample sizes greater than 10.
The is used primarily in laboratories and in
research and development work.
20
Steps used to develop :
1. Label chart.
2. Collect data. Calculate and S for each sample.
3. Establish scales and plot data.
4. Calculate and to develop the centerlines.
5. Draw the centerlines on the chart as solid lines.
21
6. Calculate the control limits
7. Draw the control limits on the chart as dashed lines.
8. Interpret the chart.
22
Attribute control charts
Many quality characteristics can be observed only as attributes,
which cannot be listed and plotted on a numerical chart.
`Many quality characteristics like colour, taste, appearance, etc.,
Attributes generally fall into two classes: either good or bad, go or no-
go, conforming or nonconforming.
Unlike variable charts, only one chart is plotted for attributes.
23
Types of Attribute Control Charts
 p charts - for identifying the very minimal defective products.
 np charts – for controls the number of defects.
 c charts - for finding the number of nonconformities.
 u charts - for identifies the number of nonconformities per unit.
24
Control Charts for Proportion Defective (p Charts)
p charts are statistical tools used to evaluate the proportion
defective, or proportion non-conforming, produced by a process.
p charts uses binomial distribution to measure the proportion of
defectives or non conforming units in a sample.
25
Construction Steps for Constructing p Charts
1. Gather data
2. Calculate p
3. Plot the data
4. Calculate control limits.
26
Control Charts for Count of Defectives (np Charts)
np charts are statistical tools used to evaluate the count of
defectives, or count of items non-conforming, produced by a process.
it uses binomial distribution to measure the number of defectives or
non-conforming units in a sample.
It is very similar to the p chart.
np chart plots the number of items, while p chart plot the
proportion of defective items.
27
Construction Steps for Constructing np Charts
1. Gather data
2. Calculate np
3. Plot the data
4. Calculate control limits.
28
Control Charts for Average Occurrences-per-Unit (u Charts)
u charts is also known as the control chart for defects.
It is generally used to monitor the count type of data where the
sample is greater than one.
There may be single type of defect or several types, but u chart tracks
the average number of defects per unit.
It assumes the underlying data approximate the Poisson distribution.
29
Construction Steps for Constructing u Charts
1. Gather data
2. Calculate u
3. Plot the data
4. Calculate control limits.
30
Control Charts for Counts of Occurrences-per-Unit (c Charts)
c charts is also known as the control chart for defects (counting of
the number of defects).
It is generally used to monitor the number of defects in constant
size units.
There may be single type of defect or several types, but c chart
tracks the average number of defects in each unit.
It assumes the underlying data approximate the Poisson
distribution.
31
Construction Steps for Constructing c Charts
1. Gather data
2. Calculate c
3. Plot the data
4. Calculate control limits.
32
33
Continuous data/
Discrete data?
Defects/ Defectives
Subgroup
size?
Xbar – S chart
Xbar – R chart
Sample size? Sample size?
u- chart c chart p chart
np chart
Continuous data Discrete data
2<n>9 n>10
Defects Defectives
Variable Variable
Constant Constant
Control Chart Selection
PROCESS CAPABILITY
A planning tool assure process performance
The ability to forecast that a process will be capable of turning out
outputs conforming to quality requirements in measurable terms is
called process capability.
Process is what transforms an input or a set of outputs into output
by using a combination of resources including time.
Capability is used in the sense of tested ability to perform thereby
achieving results that can be measured. 34
35
PROCESS CAPABILITY
Cp index
It is a fundamental indication of process capability.
Most companies require that the process Cp = 1.33 or greater.
In order to manufacture within a specification, the difference
between the USL and the LSL must be less than the total process
variation.
36
So a comparison of 6σ with (USL – LSL) or 2T gives an obvious
process capability index, known as the Cp of the process:
Value of Cp below 1 means that the process variation is greater than
the specified tolerance band so the process is incapable.
For increasing values of Cp the process becomes increasingly
capable.
37
Cpk index
There are two Cpk values, Cpku and Cpkl .
The overall process Cpk is the lower value of Cpku and Cpkl.
A Cpk of 1 or less means that the process variation and its
centring is such that at least one of the tolerance limits will be
exceeded and the process is incapable.
38
As in the case of Cp, increasing values of Cpk correspond to
increasing capability.
A comparison of the Cp and the Cpk will show zero difference if
the process is centred on the target value.
The Cpk can be used when there is only one specification limit,
upper or lower – a one-sided specification.
39
40
REFERENCES:
1. Statistical Process Control - Fifth Edition by John S. Oakland
2. The Handbook for Quality Management - A Complete Guide to
Operational Excellence - Second Edition by Thomas Pyzdek and Paul
Keller
3. Statistical Process Control – AIDT ISO 9001:2001
4. Total Quality Management by Dr. N. Ramachandran, Prof. C. Vimala,
Prof.V.R. Vivekanandan and D.Umamaheshwari
41
Thank You

Statistical Process Control (SPC) - QMS.pptx

  • 1.
    STATISTICAL PROCESS CONTROL Presentedby Mr. R. ARUN KUMAR, B.Pharm., M.Pharm (PQA) - I Year, Department of Pharmacy, Annamalai University. Submitted to Dr. K. DEVI, M.Pharm., Ph.D., Assistant Professor, Department of Pharmacy, Annamalai University. MQA102T – QUALITY MANAGEMENT SYSTEMS
  • 2.
    Statistical Process Control(SPC) DEFINITION:  Statistical Process Control is a statistical method to measure, monitor and control a process. It is a scientific visual method to monitor, control and improve the process by eliminating special cause variation in a process. It evaluates people, materials, methods, machines, and processes by stressing prevention rather than detection. 2
  • 3.
    3 It is afast feedback system. The SPC concepts are include in the management philosophy by Dr.W.E. Deming just before World War II. Though SPC effectively used in western industries since 1980, it was started during twenties in America. SPC became famous after Japanese industries implement the concepts and complete with western industries.
  • 4.
    The Terms, Statistics –It is a science which deals with a collection, summarization, analysis and drawing information from data. Process – It converts input resources into the desired output. Control – System, policies and procedures in place the overall output meets the requirement. 4
  • 5.
  • 6.
    Importance of SPC Visibility into qualitydata prevents over-tampering Control charts provide operational insight for critical stakeholders Data accessibility and visibility levels the playing field Real – time SPC helps reduce the margin of error 6
  • 7.
  • 8.
    CONTROL CHARTS: The controlchart was invented by Walter A Shewhart in 1924. A chart that shows plotted values, a central line, and one or two control limits and is used to monitor a process over time. − most important tools of SPC − simple − verifying the results of any improvement actions taken 8
  • 9.
    − powerful toolsfor checking the stability of a process over time The power of the control chart is in its ability to separate these assignable causes of quality variation from inherent, unavoidable causes. The two categories of control charts: 1. Variables Control Charts 2. Attribute Control Charts 9
  • 10.
  • 11.
    Chart Preparation Before acontrol chart can be used, several steps must be taken: Management must prepare a responsive environment The process that is to be studied must be understood Unnecessary variation must be minimized The characteristics to be controlled must be determined The measurement system must be defined Step 1 Step 2 Step 3 Step 4 Step 5 11
  • 12.
    Control Chart Functions Monitor process performanceover time Describe what control there is Verify the results of any corrective action Signal when corrective action is needed Estimate the capability of the process Help attain control by detecting change in the performance of the process 12
  • 13.
    Variables Control Charts Manyquality characteristics like the height, weight, diameter, dimension, volume, pressure, temperature are represented numerically. The measurement of these characteristics through inspection is said to be expressed by variables. Variables Control Charts are used to record and monitor process performance with respect to the selected variable. 13
  • 14.
    14 The three typesof variables charts are: 1. Average and Range Charts 2. Median and Range Charts 3. Average and Standard Deviation Charts
  • 15.
    Average-Range Charts It isone of the most powerful and sensitive SPC tools. It can be applied to any continuous variable like weight, size, cycle time and error rate. Subgroup size is 2 -10. These charts are widely used control chart for variable data to examine the process stability in many industries. 15
  • 16.
    Steps used inpreparing : 1. Properly label the chart. 2. Collect and record data. 3. Select scales. 4. Plot data. 5. Develop chart Establish centerline Calculate control limits 16
  • 17.
    6. Develop chart: Establishcenterline Calculate control limits 7. Draw lines on control chart. 8. Interpret chart. 17
  • 18.
    Median-Range Charts Median andRange control charts is very similar to those for Average-Range charts. Steps used to develop : 1. Label chart. 2. Collect data, establish scales and plot all data. 3. Develop R chart 18
  • 19.
    4. Develop chart 5.Draw centerlines and control limits. 6. Interpret chart. 19
  • 20.
    Average-Standard Deviation Charts Thesame approach is taken in developing Average and Standard Deviation Charts as for . are used for sample sizes greater than 10. The is used primarily in laboratories and in research and development work. 20
  • 21.
    Steps used todevelop : 1. Label chart. 2. Collect data. Calculate and S for each sample. 3. Establish scales and plot data. 4. Calculate and to develop the centerlines. 5. Draw the centerlines on the chart as solid lines. 21
  • 22.
    6. Calculate thecontrol limits 7. Draw the control limits on the chart as dashed lines. 8. Interpret the chart. 22
  • 23.
    Attribute control charts Manyquality characteristics can be observed only as attributes, which cannot be listed and plotted on a numerical chart. `Many quality characteristics like colour, taste, appearance, etc., Attributes generally fall into two classes: either good or bad, go or no- go, conforming or nonconforming. Unlike variable charts, only one chart is plotted for attributes. 23
  • 24.
    Types of AttributeControl Charts  p charts - for identifying the very minimal defective products.  np charts – for controls the number of defects.  c charts - for finding the number of nonconformities.  u charts - for identifies the number of nonconformities per unit. 24
  • 25.
    Control Charts forProportion Defective (p Charts) p charts are statistical tools used to evaluate the proportion defective, or proportion non-conforming, produced by a process. p charts uses binomial distribution to measure the proportion of defectives or non conforming units in a sample. 25
  • 26.
    Construction Steps forConstructing p Charts 1. Gather data 2. Calculate p 3. Plot the data 4. Calculate control limits. 26
  • 27.
    Control Charts forCount of Defectives (np Charts) np charts are statistical tools used to evaluate the count of defectives, or count of items non-conforming, produced by a process. it uses binomial distribution to measure the number of defectives or non-conforming units in a sample. It is very similar to the p chart. np chart plots the number of items, while p chart plot the proportion of defective items. 27
  • 28.
    Construction Steps forConstructing np Charts 1. Gather data 2. Calculate np 3. Plot the data 4. Calculate control limits. 28
  • 29.
    Control Charts forAverage Occurrences-per-Unit (u Charts) u charts is also known as the control chart for defects. It is generally used to monitor the count type of data where the sample is greater than one. There may be single type of defect or several types, but u chart tracks the average number of defects per unit. It assumes the underlying data approximate the Poisson distribution. 29
  • 30.
    Construction Steps forConstructing u Charts 1. Gather data 2. Calculate u 3. Plot the data 4. Calculate control limits. 30
  • 31.
    Control Charts forCounts of Occurrences-per-Unit (c Charts) c charts is also known as the control chart for defects (counting of the number of defects). It is generally used to monitor the number of defects in constant size units. There may be single type of defect or several types, but c chart tracks the average number of defects in each unit. It assumes the underlying data approximate the Poisson distribution. 31
  • 32.
    Construction Steps forConstructing c Charts 1. Gather data 2. Calculate c 3. Plot the data 4. Calculate control limits. 32
  • 33.
    33 Continuous data/ Discrete data? Defects/Defectives Subgroup size? Xbar – S chart Xbar – R chart Sample size? Sample size? u- chart c chart p chart np chart Continuous data Discrete data 2<n>9 n>10 Defects Defectives Variable Variable Constant Constant Control Chart Selection
  • 34.
    PROCESS CAPABILITY A planningtool assure process performance The ability to forecast that a process will be capable of turning out outputs conforming to quality requirements in measurable terms is called process capability. Process is what transforms an input or a set of outputs into output by using a combination of resources including time. Capability is used in the sense of tested ability to perform thereby achieving results that can be measured. 34
  • 35.
  • 36.
    Cp index It isa fundamental indication of process capability. Most companies require that the process Cp = 1.33 or greater. In order to manufacture within a specification, the difference between the USL and the LSL must be less than the total process variation. 36
  • 37.
    So a comparisonof 6σ with (USL – LSL) or 2T gives an obvious process capability index, known as the Cp of the process: Value of Cp below 1 means that the process variation is greater than the specified tolerance band so the process is incapable. For increasing values of Cp the process becomes increasingly capable. 37
  • 38.
    Cpk index There aretwo Cpk values, Cpku and Cpkl . The overall process Cpk is the lower value of Cpku and Cpkl. A Cpk of 1 or less means that the process variation and its centring is such that at least one of the tolerance limits will be exceeded and the process is incapable. 38
  • 39.
    As in thecase of Cp, increasing values of Cpk correspond to increasing capability. A comparison of the Cp and the Cpk will show zero difference if the process is centred on the target value. The Cpk can be used when there is only one specification limit, upper or lower – a one-sided specification. 39
  • 40.
    40 REFERENCES: 1. Statistical ProcessControl - Fifth Edition by John S. Oakland 2. The Handbook for Quality Management - A Complete Guide to Operational Excellence - Second Edition by Thomas Pyzdek and Paul Keller 3. Statistical Process Control – AIDT ISO 9001:2001 4. Total Quality Management by Dr. N. Ramachandran, Prof. C. Vimala, Prof.V.R. Vivekanandan and D.Umamaheshwari
  • 41.