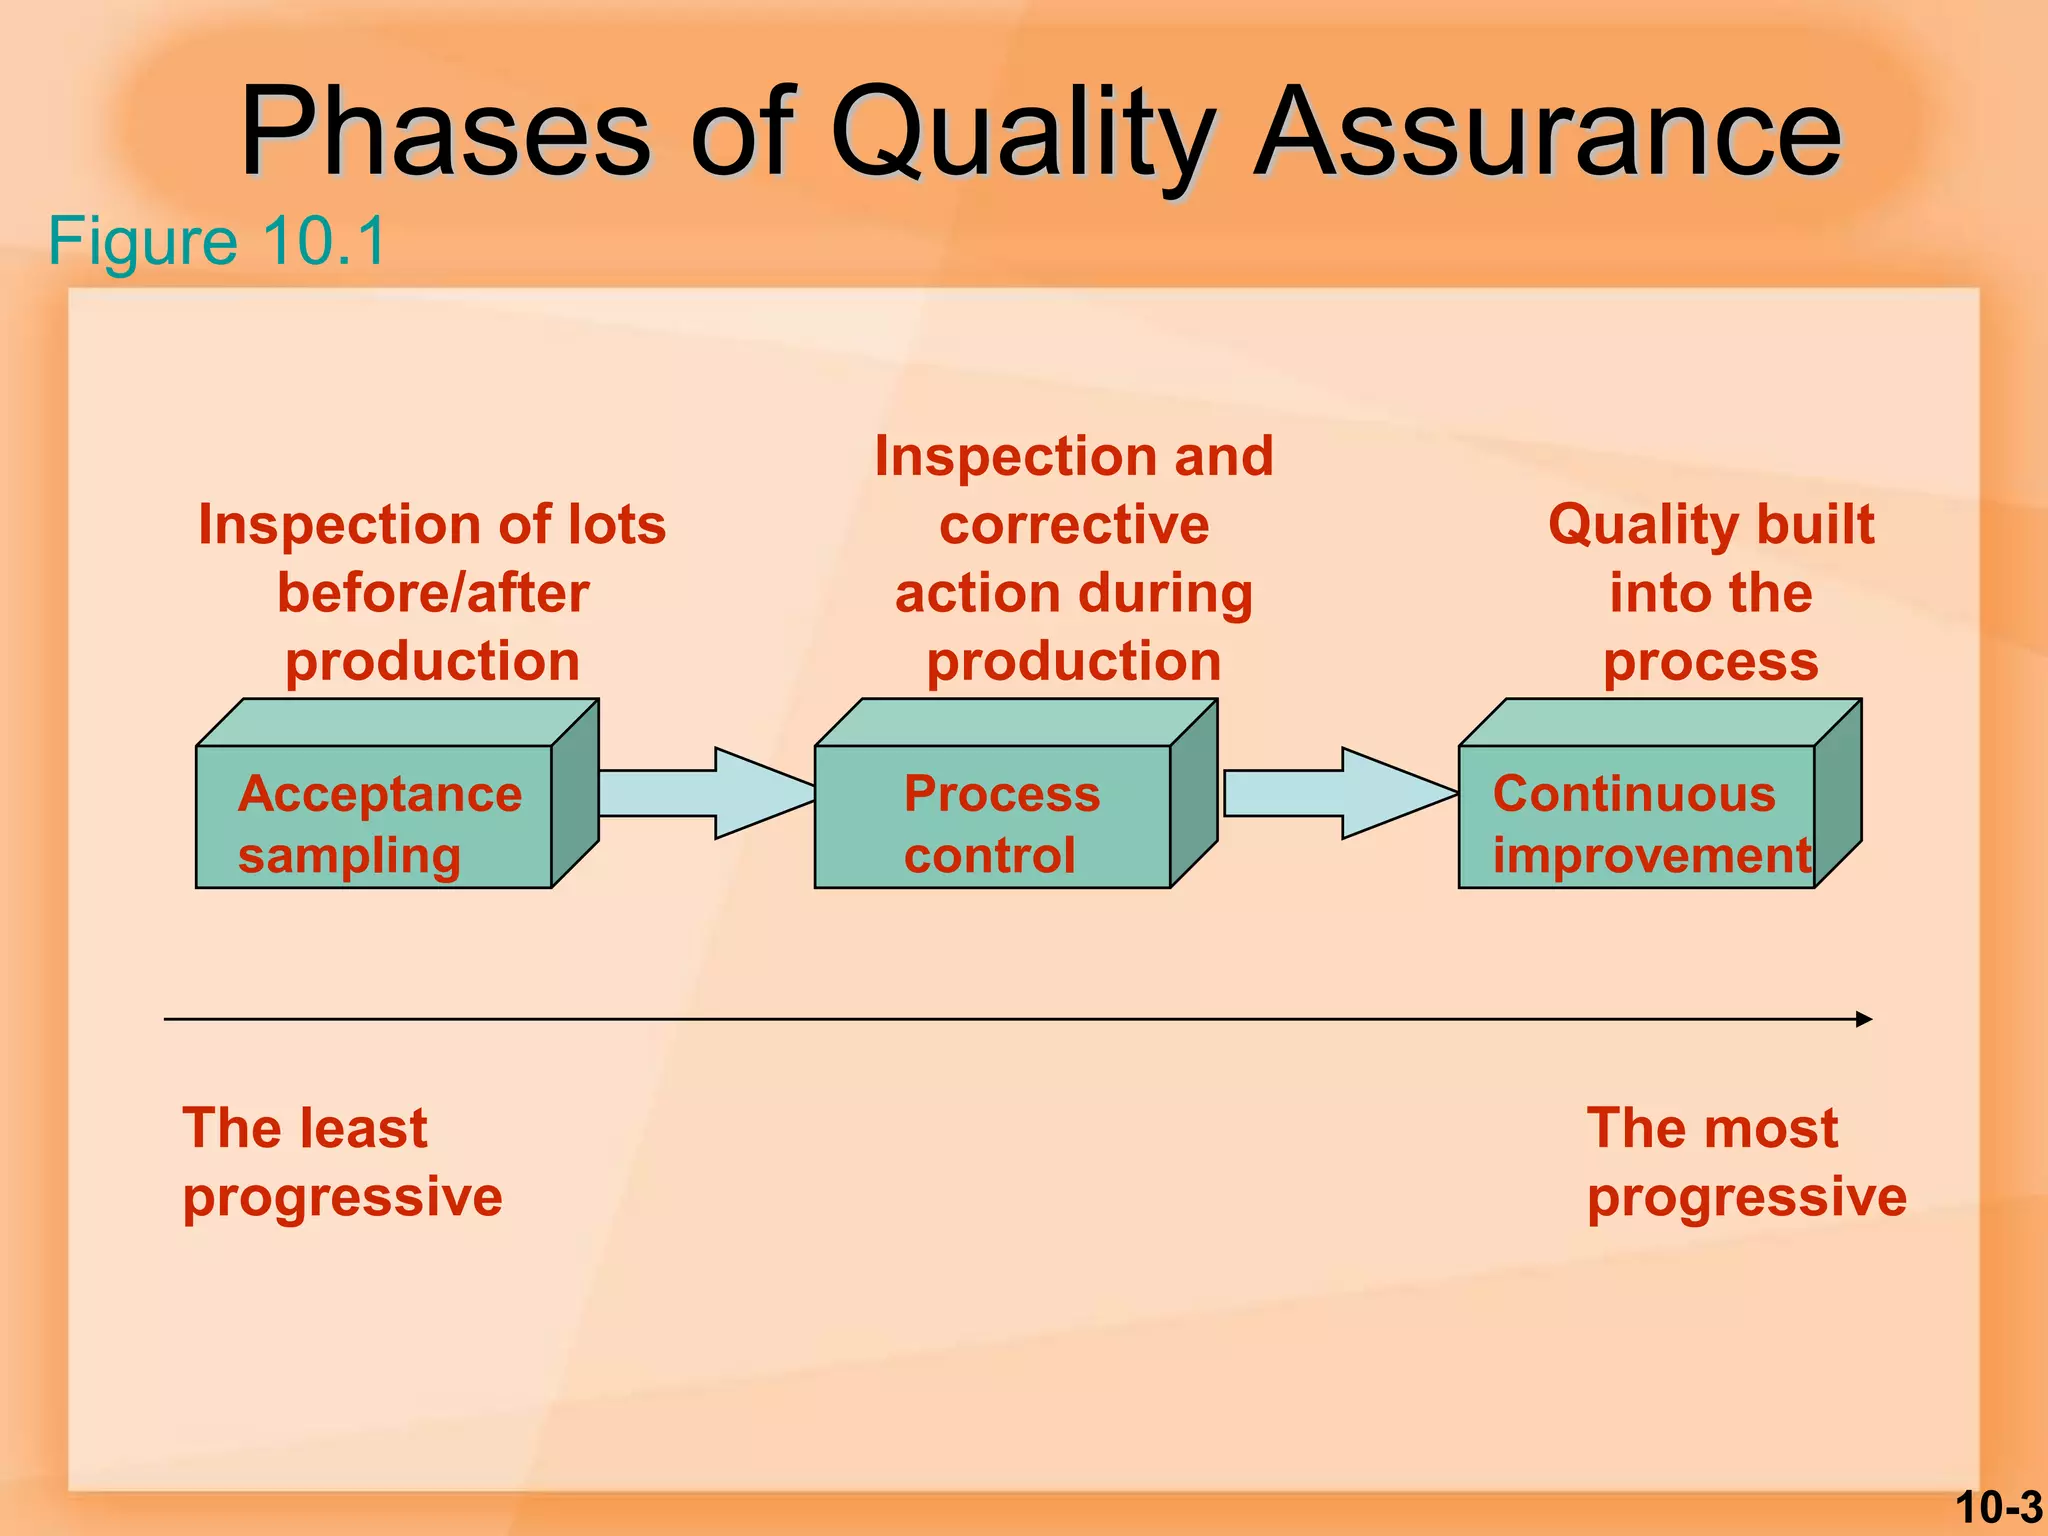
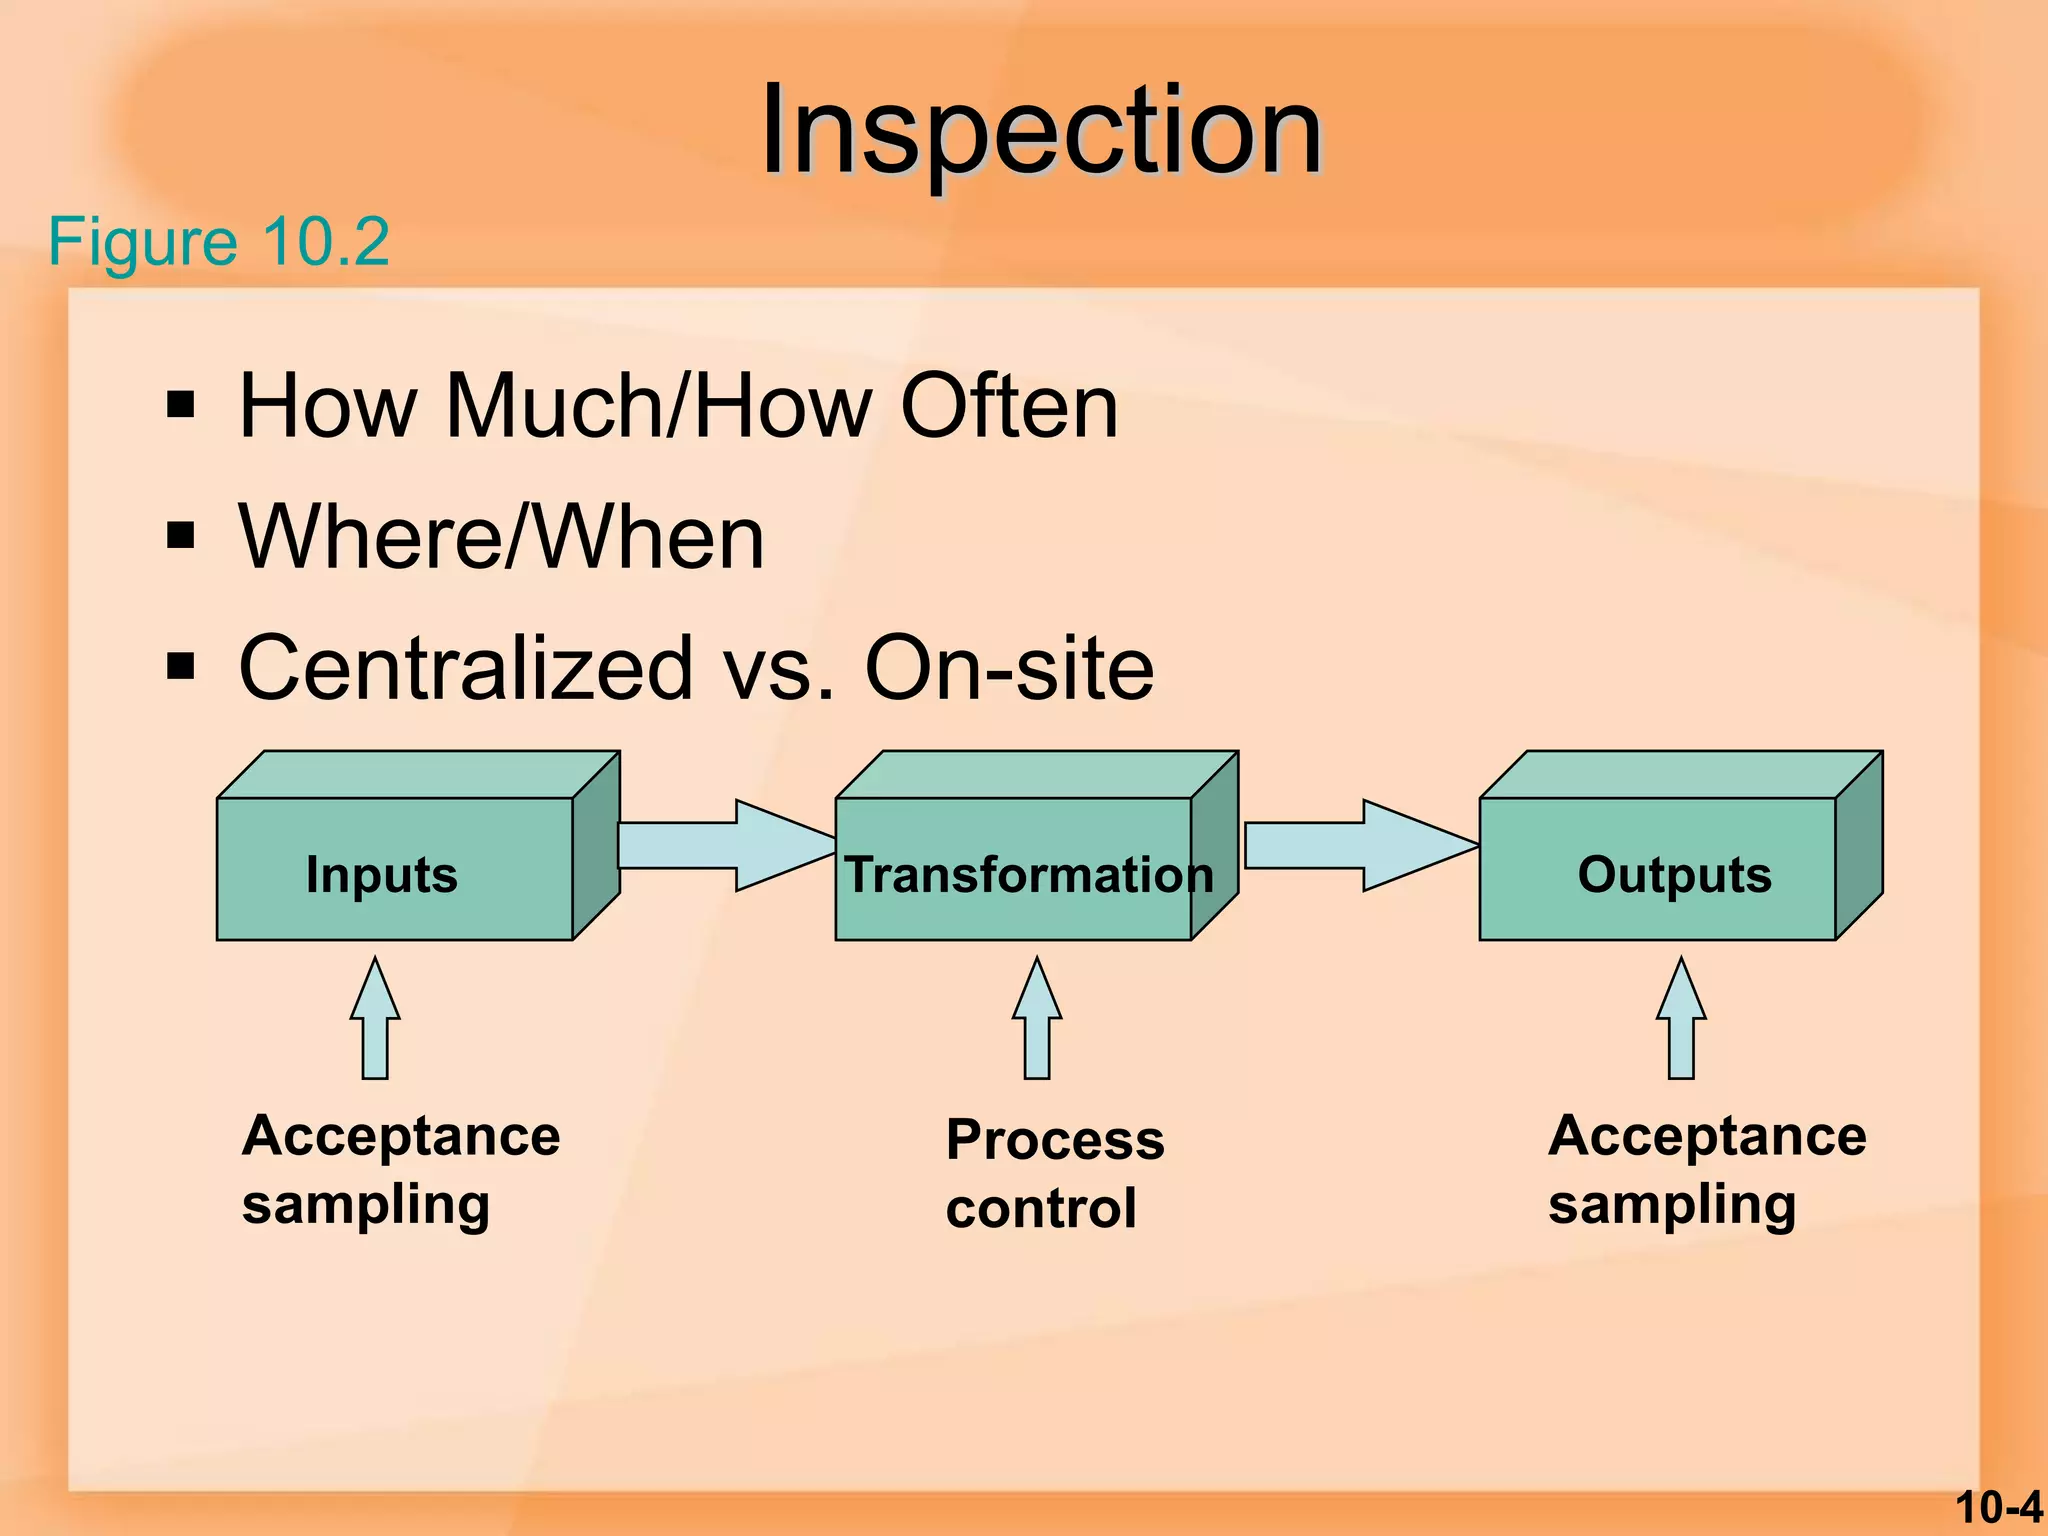
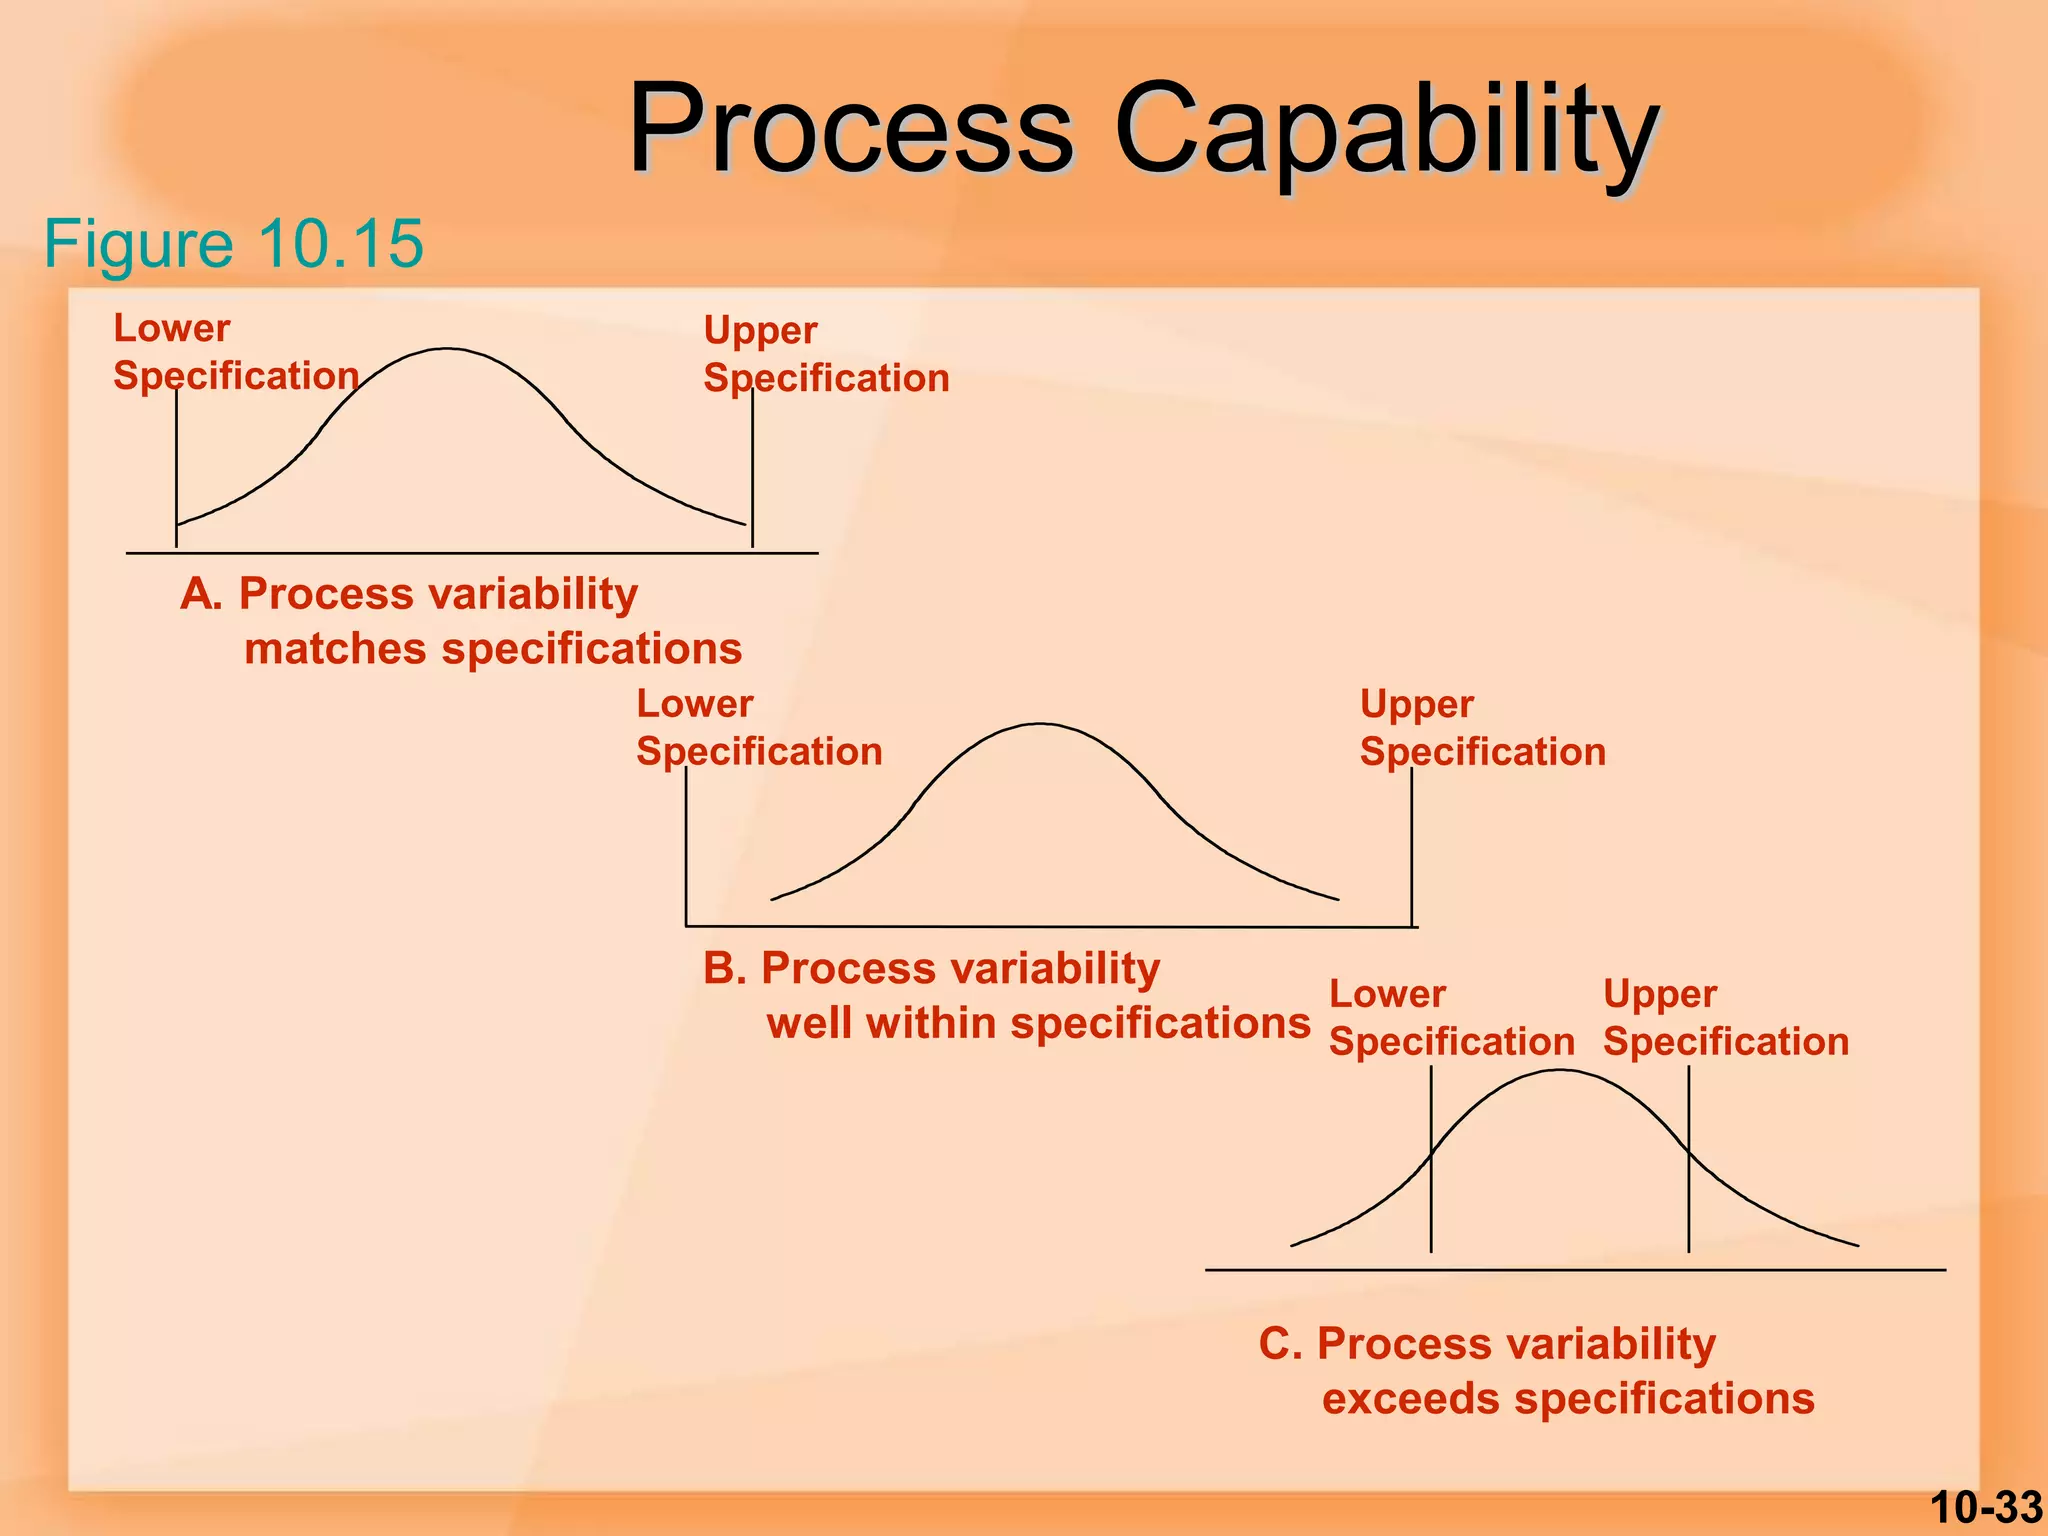
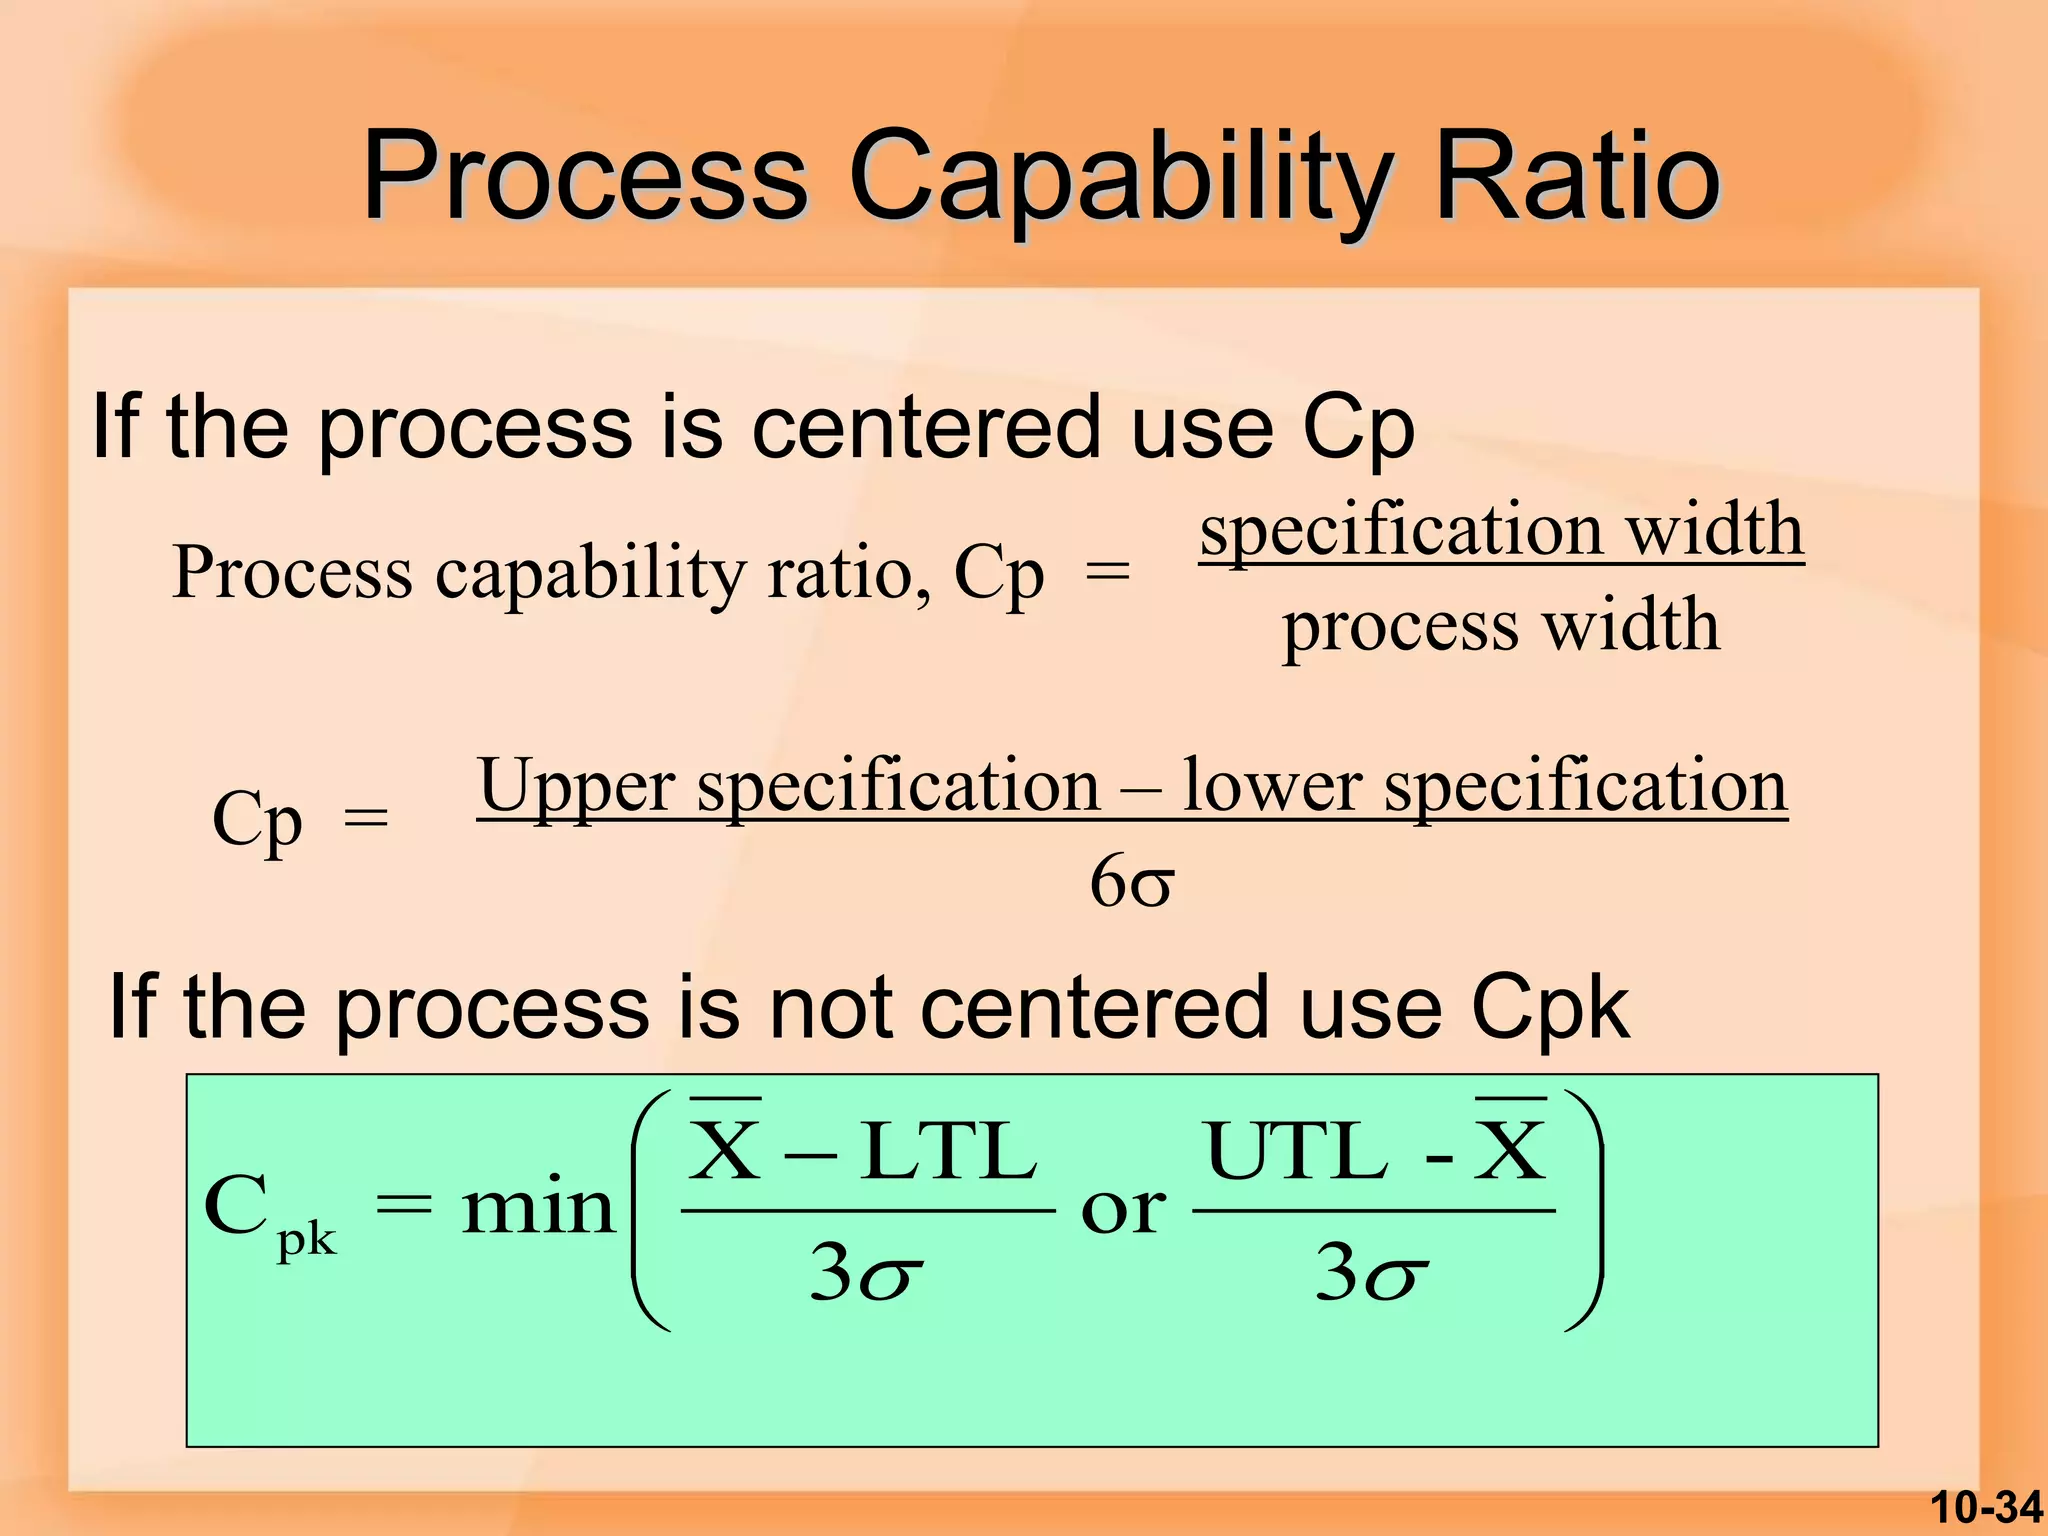
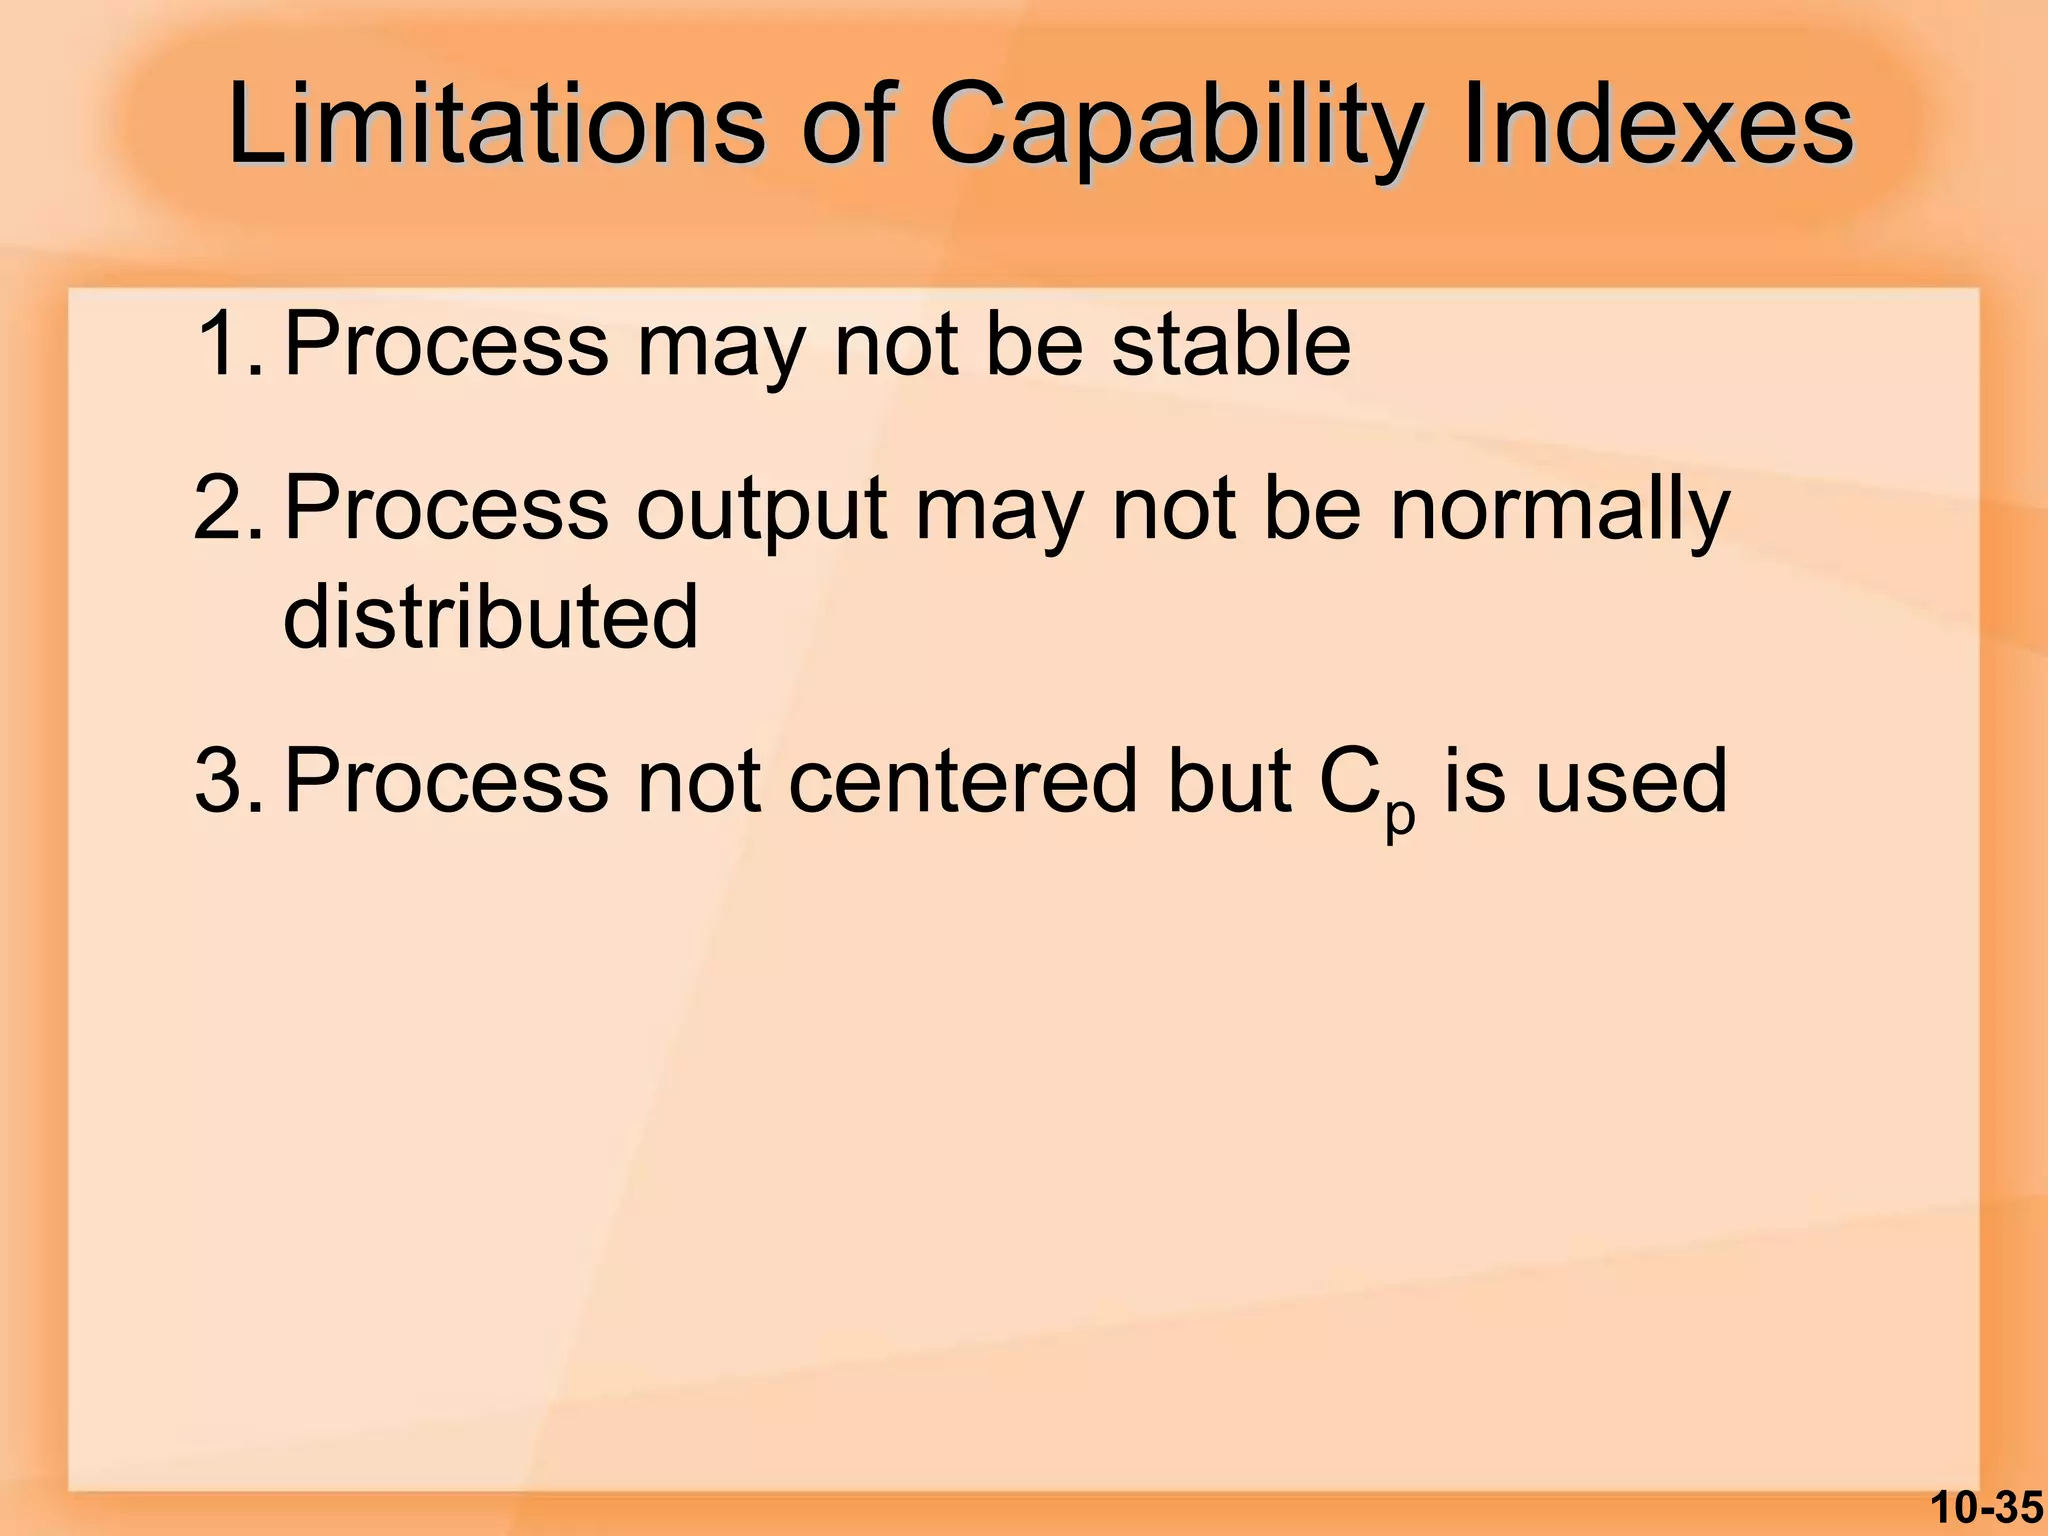
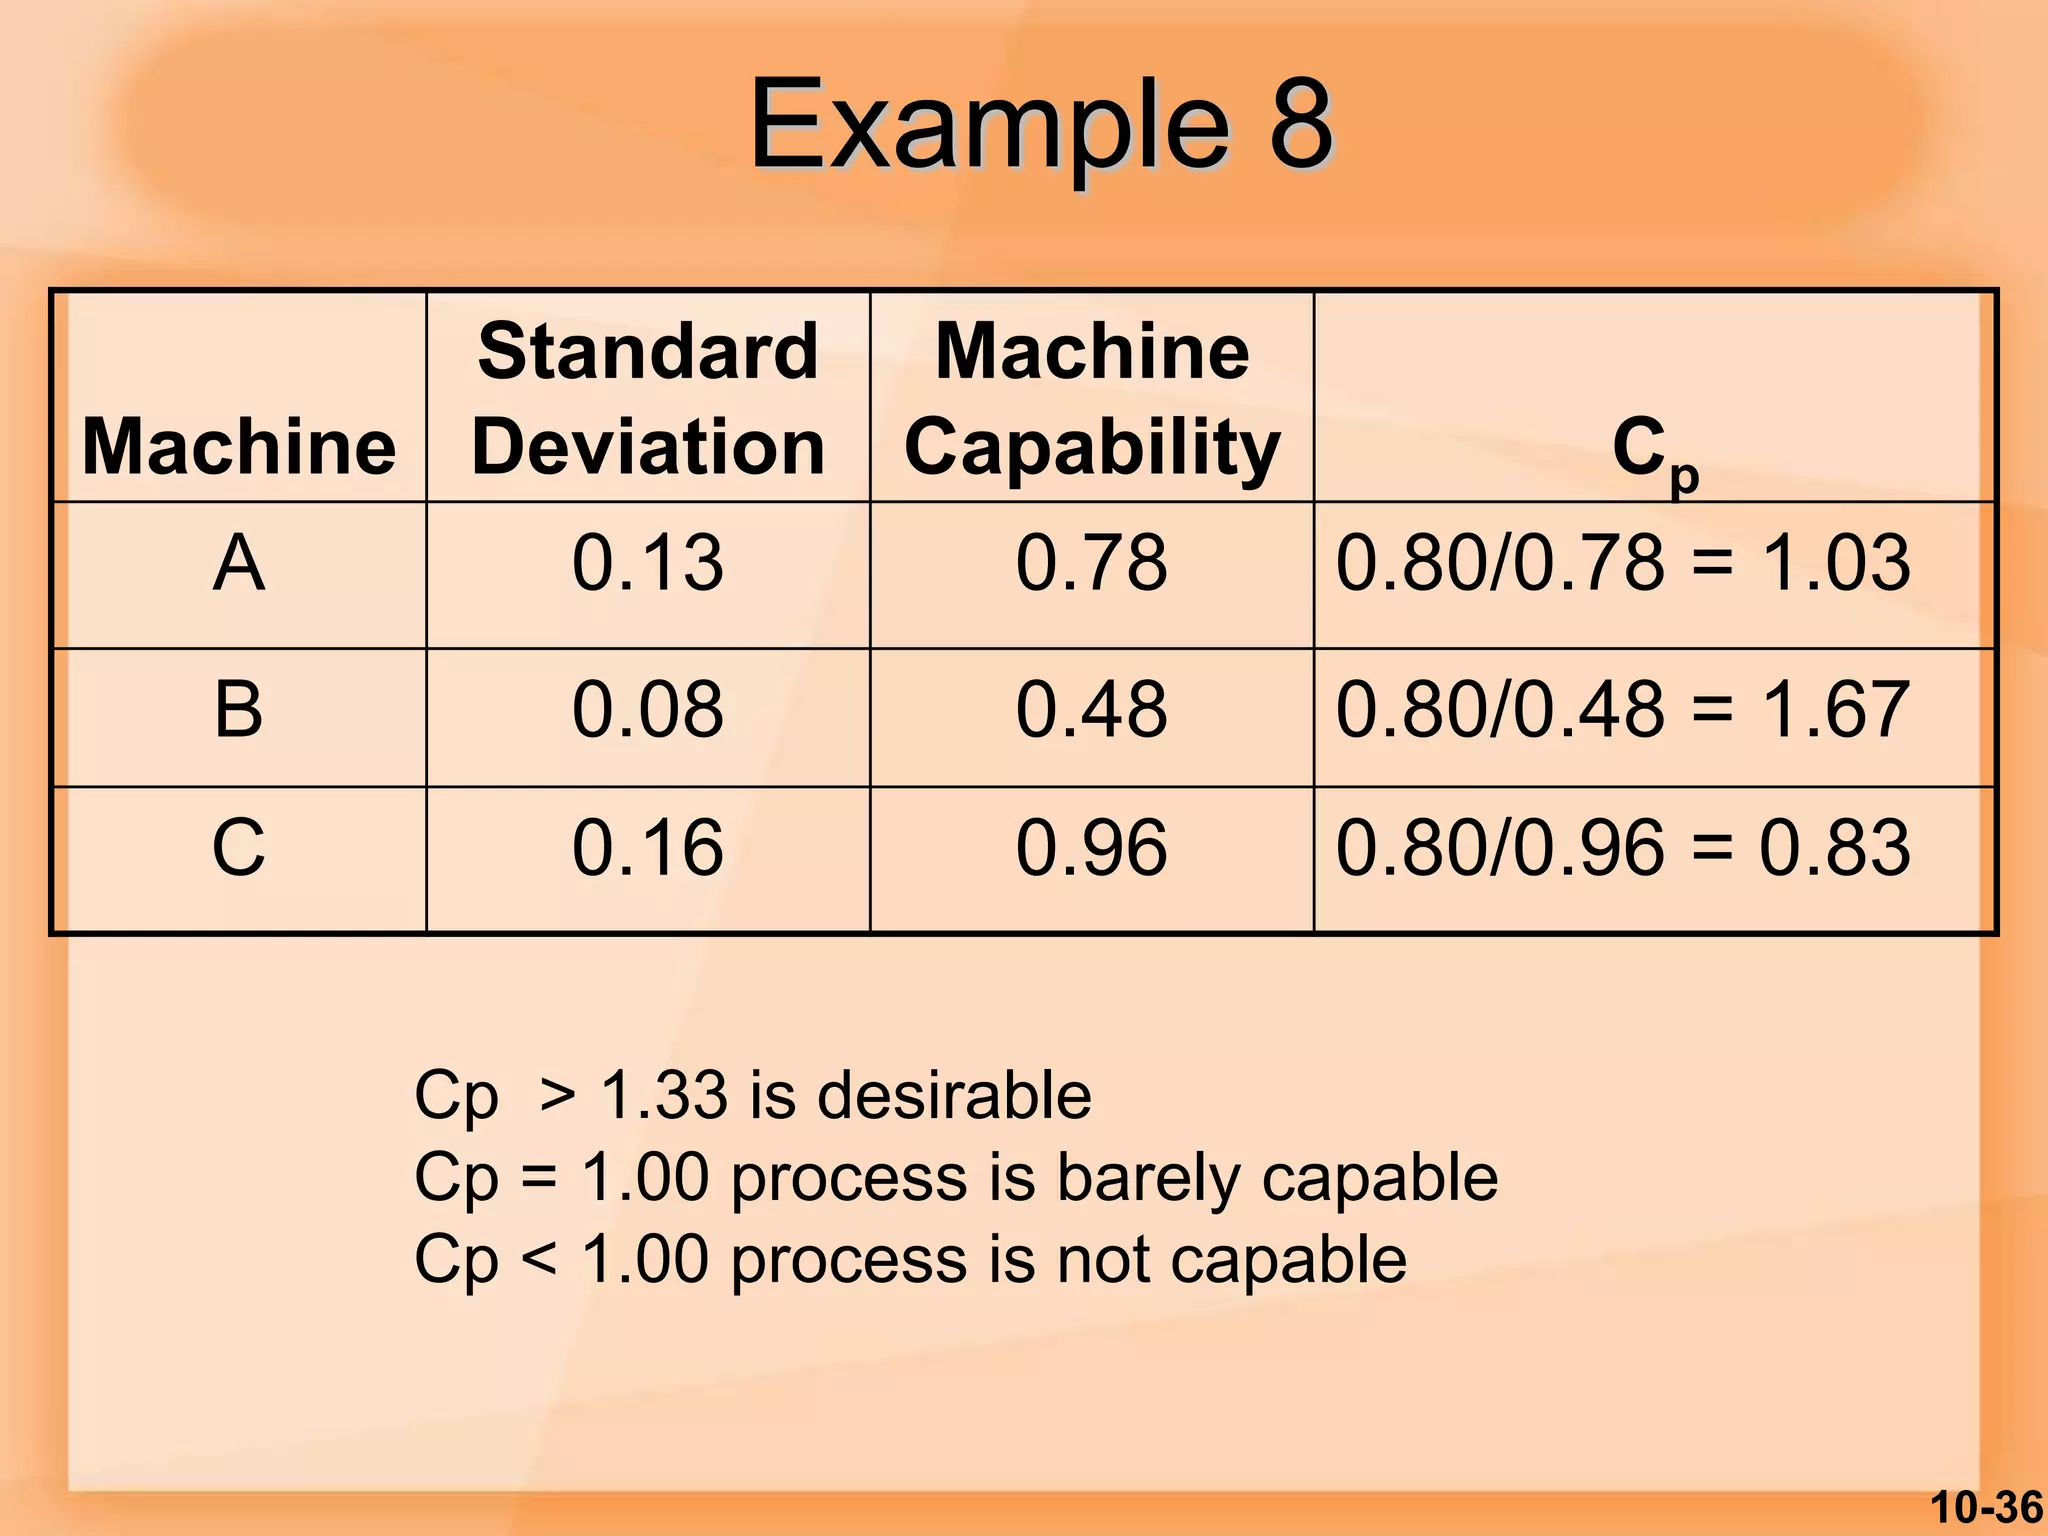
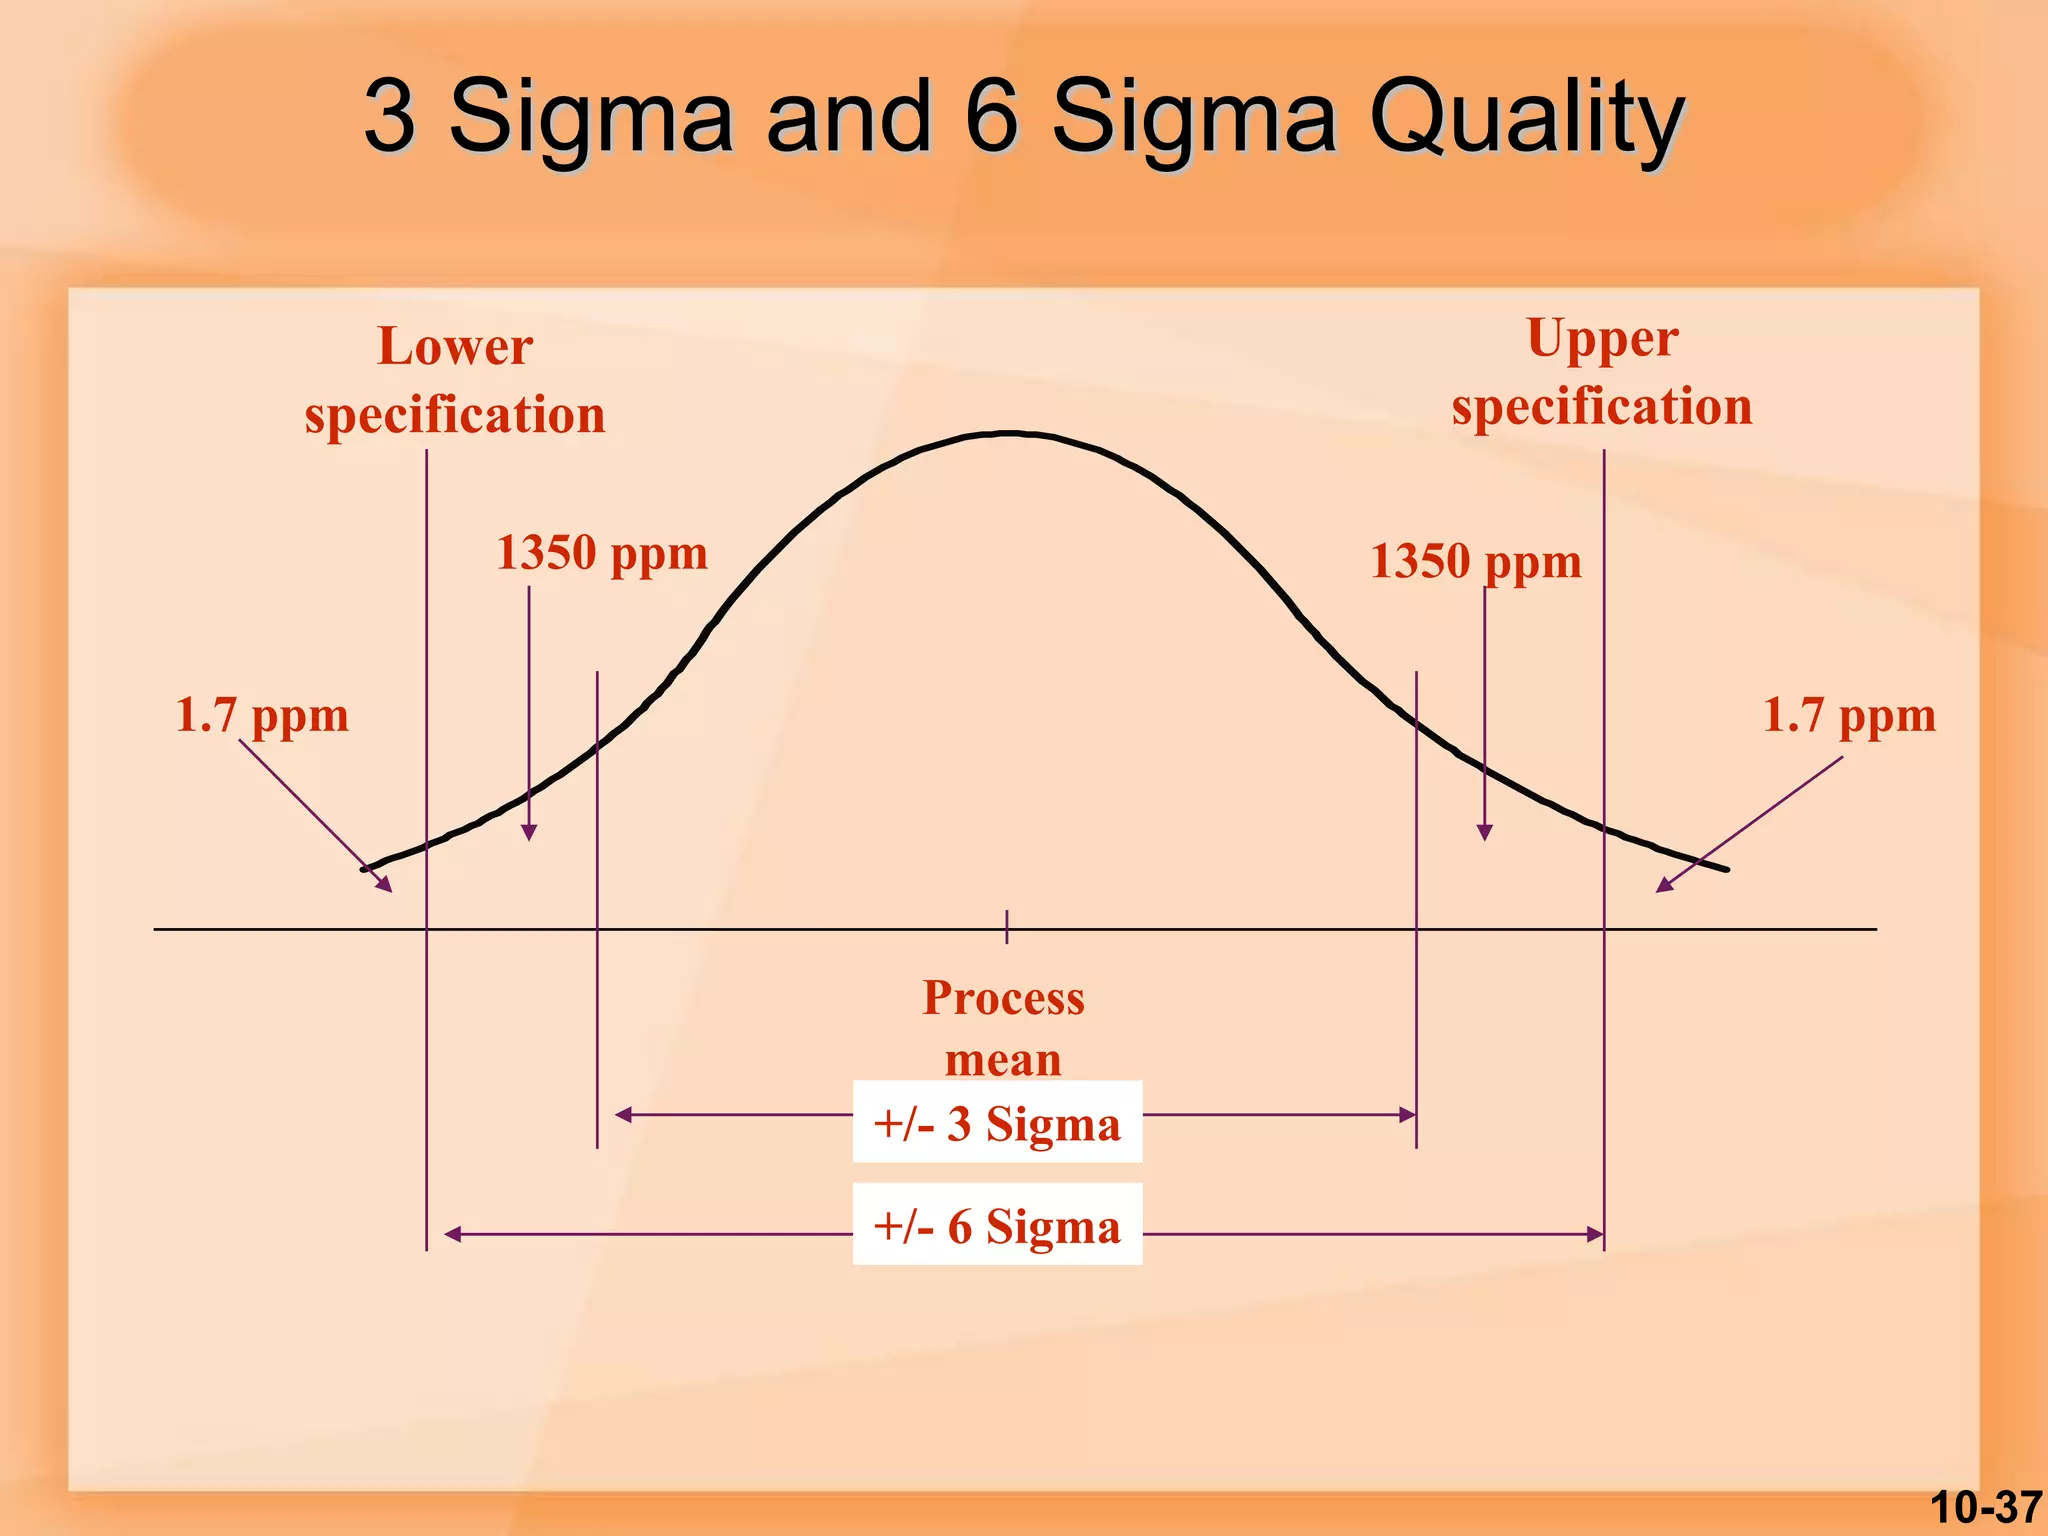
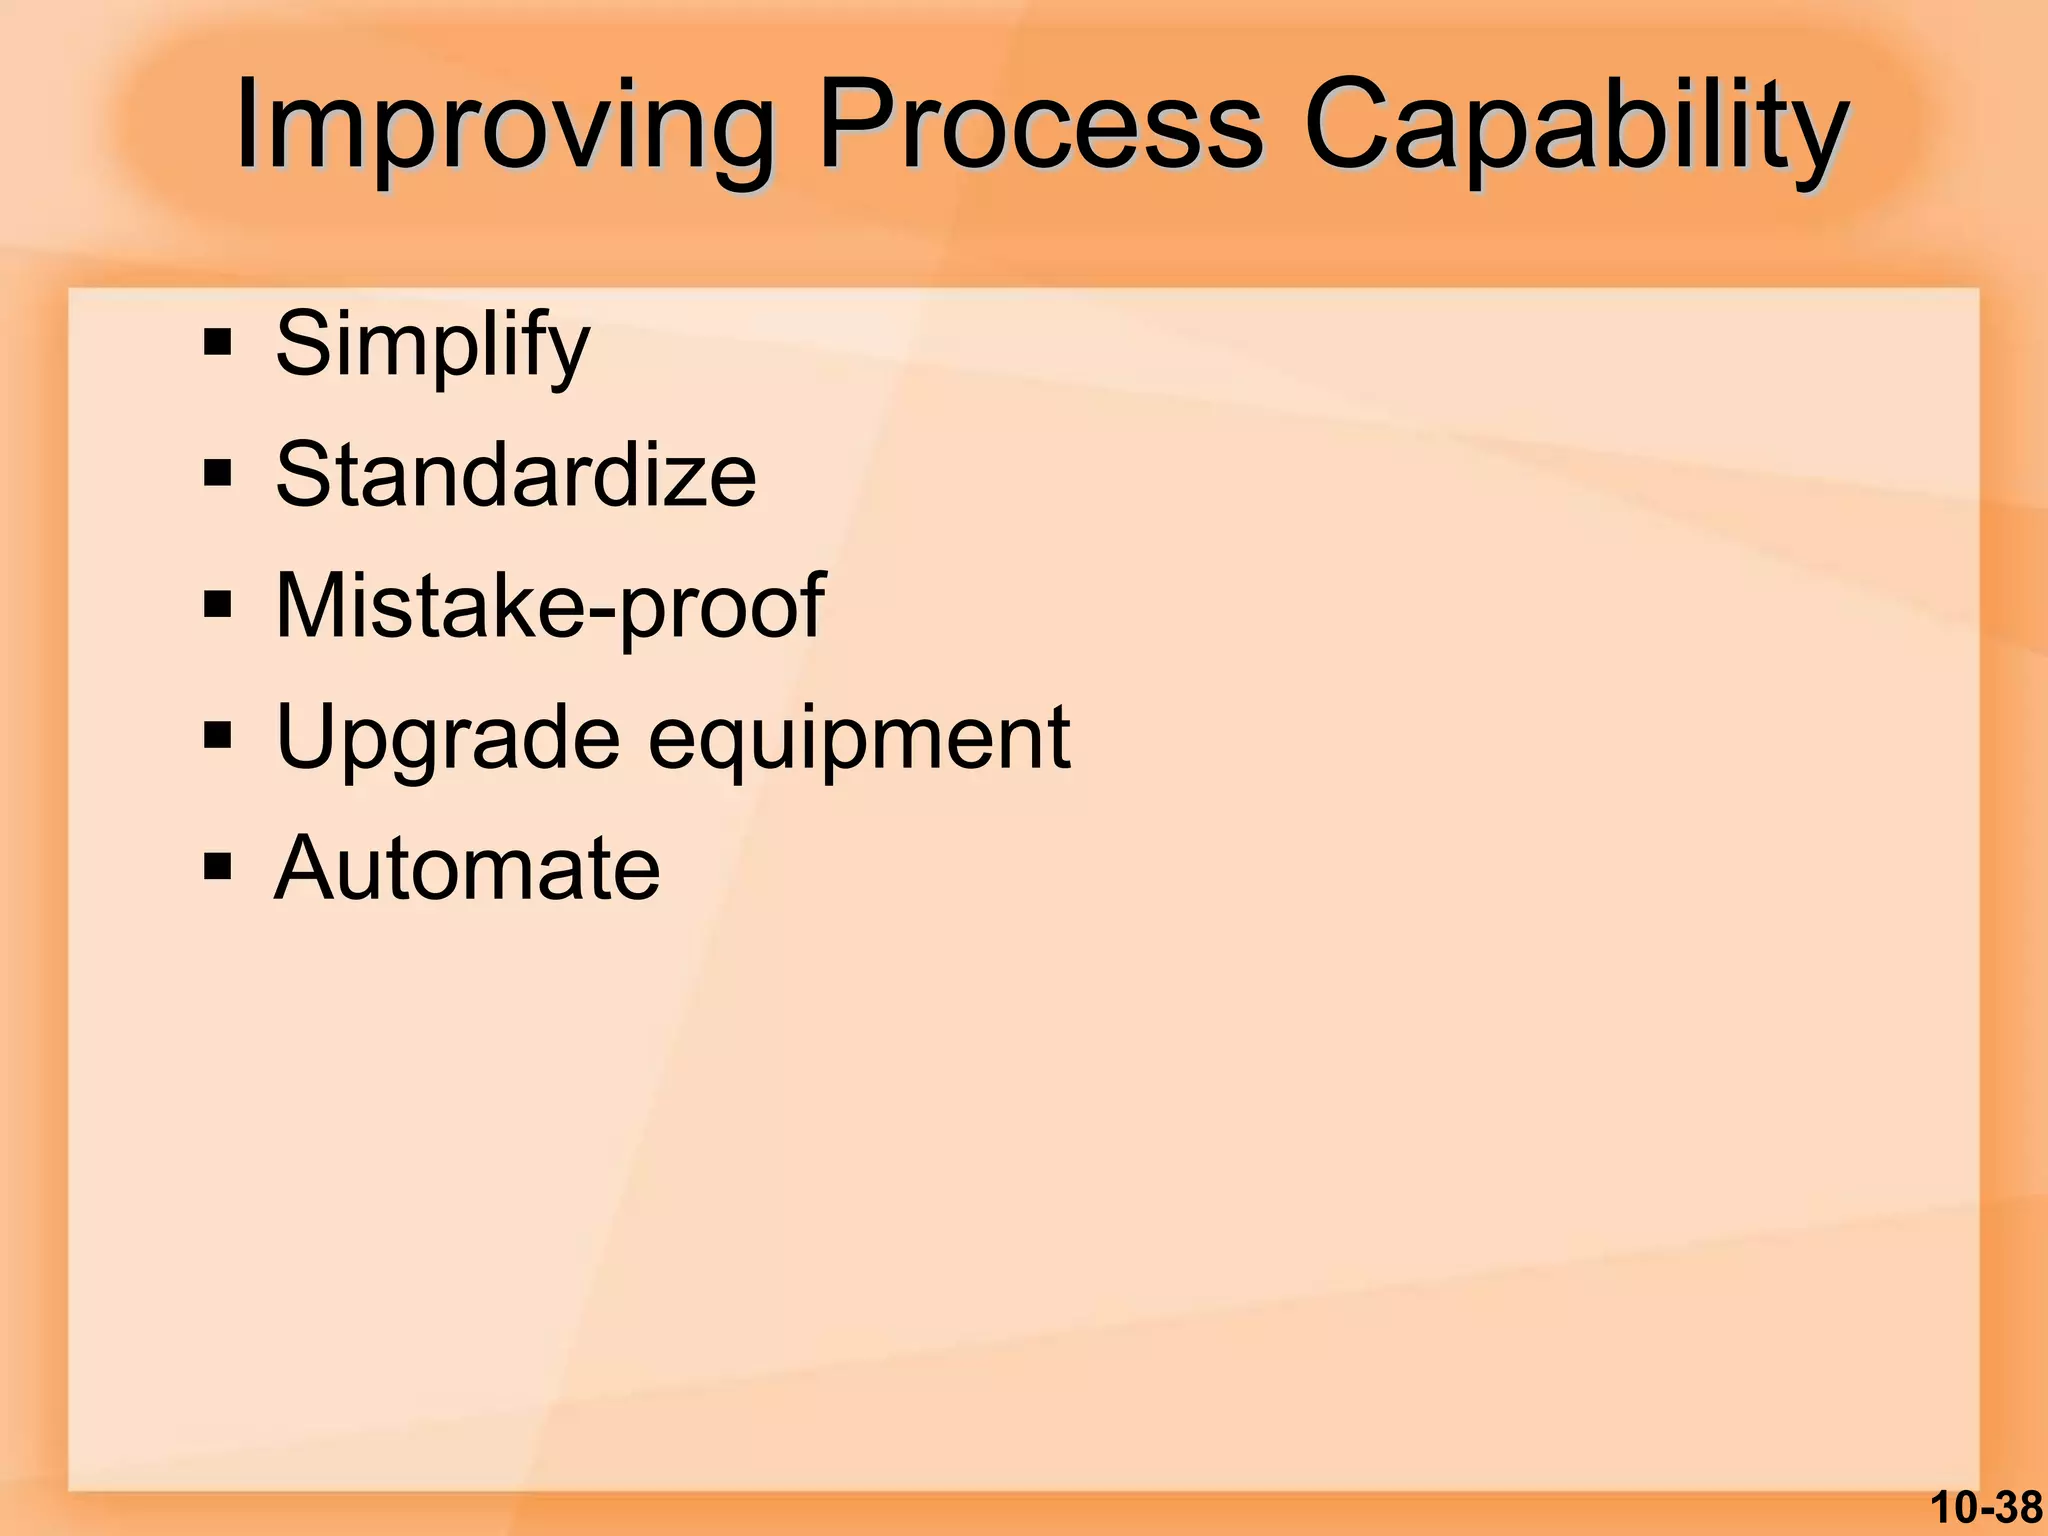
McGraw-Hill/Irwin Copyright © 2007 by The McGraw-Hill Companies, Inc. All rights reserved.
10
Quality Control
10-2
Learning Objectives
 List and briefly explain the elements of the
control process.
 Explain how control charts are used to
monitor a process, and the concepts that
underlie their use.
 Use and interpret control charts.
 Use run tests to check for nonrandomness
in process output.
 Assess process capability.
10-3
Phases of Quality Assurance
Acceptance
sampling
Process
control
Continuous
improvement
Inspection of lots
before/after
production
Inspection and
corrective
action during
production
Quality built
into the
process
The least
progressive
The most
progressive
Figure 10.1
10-4
Inspection
 How Much/How Often
 Where/When
 Centralized vs. On-site
Inputs Transformation Outputs
Acceptance
sampling
Process
control
Acceptance
sampling
Figure 10.2
10-5
Cost
Optimal
Amount of Inspection
Inspection Costs
Cost of
inspection
Cost of
passing
defectives
Total Cost
Figure 10.3
10-6
Where to Inspect in the Process
 Raw materials and purchased parts
 Finished products
 Before a costly operation
 Before an irreversible process
 Before a covering process
10-7
Examples of Inspection Points
Type of
business
Inspection
points
Characteristics
Fast Food Cashier
Counter area
Eating area
Building
Kitchen
Accuracy
Appearance, productivity
Cleanliness
Appearance
Health regulations
Hotel/motel Parking lot
Accounting
Building
Main desk
Safe, well lighted
Accuracy, timeliness
Appearance, safety
Waiting times
Supermarket Cashiers
Deliveries
Accuracy, courtesy
Quality, quantity
Table 10.1
10-8
Statistical Process Control:
Statistical evaluation of the output of a
process during production
Quality of Conformance:
A product or service conforms to
specifications
Statistical Control
10-9
Control Chart
 Control Chart
 Purpose: to monitor process output to see
if it is random
 A time ordered plot representative sample
statistics obtained from an on going
process (e.g. sample means)
 Upper and lower control limits define the
range of acceptable variation
10-10
Control Chart
0 1 2 3 4 5 6 7 8 9 10 11 12 13 14 15
UCL
LCL
Sample number
Mean
Out of
control
Normal variation
due to chance
Abnormal variation
due to assignable sources
Abnormal variation
due to assignable sources
Figure 10.4
10-11
Statistical Process Control
 The essence of statistical process
control is to assure that the output of a
process is random so that future output
will be random.
10-12
Statistical Process Control
 The Control Process
 Define
 Measure
 Compare
 Evaluate
 Correct
 Monitor results
10-13
Statistical Process Control
 Variations and Control
 Random variation: Natural variations in the
output of a process, created by countless
minor factors
 Assignable variation: A variation whose
source can be identified
10-14
Sampling Distribution
Sampling
distribution
Process
distribution
Mean
Figure 10.5
10-15
Normal Distribution
Mean
   
95.44%
99.74%
Standard deviation
Figure 10.6
10-16
Control Limits
Sampling
distribution
Process
distribution
Mean
Lower
control
limit
Upper
control
limit
Figure 10.7
10-17
SPC Errors
 Type I error
 Concluding a process is not in control
when it actually is.
 Type II error
 Concluding a process is in control when it
is not.
10-18
Type I and Type II Errors
In control Out of control
In control No Error Type I error
(producers risk)
Out of
control
Type II Error
(consumers risk)
No error
Table 10.2
10-19
Type I Error
Mean
LCL UCL
/2 /2
Probability
of Type I error
Figure 10.8
10-20
Observations from Sample
Distribution
Sample number
UCL
LCL
1 2 3 4
Figure 10.9
10-21
Control Charts for Variables
 Mean control charts
 Used to monitor the central tendency of a
process.
 X bar charts
 Range control charts
 Used to monitor the process dispersion
 R charts
Variables generate data that are measured.
10-22
Mean and Range Charts
UCL
LCL
UCL
LCL
R-chart
x-Chart Detects shift
Does not
detect shift
Figure 10.10A
(process mean is
shifting upward)
Sampling
Distribution
10-23
x-Chart
UCL
Does not
reveal increase
Mean and Range Charts
UCL
LCL
LCL
R-chart Reveals increase
Figure 10.10B
(process variability is increasing)
Sampling
Distribution
10-24
Control Chart for Attributes
 p-Chart - Control chart used to monitor
the proportion of defectives in a process
 c-Chart - Control chart used to monitor
the number of defects per unit
Attributes generate data that are counted.
10-25
Use of p-Charts
 When observations can be placed into
two categories.
 Good or bad
 Pass or fail
 Operate or don’t operate
 When the data consists of multiple
samples of several observations each
Table 10.4
10-26
Use of c-Charts
 Use only when the number of
occurrences per unit of measure can be
counted; non-occurrences cannot be
counted.
 Scratches, chips, dents, or errors per item
 Cracks or faults per unit of distance
 Breaks or Tears per unit of area
 Bacteria or pollutants per unit of volume
 Calls, complaints, failures per unit of time
Table 10.4
10-27
Use of Control Charts
 At what point in the process to use
control charts
 What size samples to take
 What type of control chart to use
 Variables
 Attributes
10-28
Run Tests
 Run test – a test for randomness
 Any sort of pattern in the data would
suggest a non-random process
 All points are within the control limits -
the process may not be random
10-29
Nonrandom Patterns in Control
charts
 Trend
 Cycles
 Bias
 Mean shift
 Too much dispersion
10-30
Counting Above/Below Median Runs (7 runs)
Counting Up/Down Runs (8 runs)
U U D U D U D U U D
B A A B A B B B A A B
Figure 10.12
Figure 10.13
Counting Runs
10-31
NonRandom Variation
 Managers should have response plans to
investigate cause
 May be false alarm (Type I error)
 May be assignable variation
10-32
 Tolerances or specifications
 Range of acceptable values established by
engineering design or customer
requirements
 Process variability
 Natural variability in a process
 Process capability
 Process variability relative to specification
Process Capability
10-33
Process Capability
Lower
Specification
Upper
Specification
A. Process variability
matches specifications
Lower
Specification
Upper
Specification
B. Process variability
well within specifications
Lower
Specification
Upper
Specification
C. Process variability
exceeds specifications
Figure 10.15
10-34
Process Capability Ratio
Process capability ratio, Cp =
specification width
process width
Upper specification – lower specification
6
Cp =







 

 3
X
-
UTL
or
3
LTL
X
min
=
Cpk
If the process is centered use Cp
If the process is not centered use Cpk
10-35
Limitations of Capability Indexes
1. Process may not be stable
2. Process output may not be normally
distributed
3. Process not centered but Cp is used
10-36
Example 8
Machine
Standard
Deviation
Machine
Capability Cp
A 0.13 0.78 0.80/0.78 = 1.03
B 0.08 0.48 0.80/0.48 = 1.67
C 0.16 0.96 0.80/0.96 = 0.83
Cp > 1.33 is desirable
Cp = 1.00 process is barely capable
Cp < 1.00 process is not capable
10-37
Process
mean
Lower
specification
Upper
specification
1350 ppm 1350 ppm
1.7 ppm 1.7 ppm
+/- 3 Sigma
+/- 6 Sigma
3 Sigma and 6 Sigma Quality
10-38
Improving Process Capability
 Simplify
 Standardize
 Mistake-proof
 Upgrade equipment
 Automate
10-39
Taguchi Loss Function
Cost
Target
Lower
spec
Upper
spec
Traditional
cost function
Taguchi
cost function
Figure 10.17
10-40
Video: Defect Prev.

Process Control.ppt

  • 1.
    McGraw-Hill/Irwin Copyright ©2007 by The McGraw-Hill Companies, Inc. All rights reserved. 10 Quality Control
  • 2.
    10-2 Learning Objectives  Listand briefly explain the elements of the control process.  Explain how control charts are used to monitor a process, and the concepts that underlie their use.  Use and interpret control charts.  Use run tests to check for nonrandomness in process output.  Assess process capability.
  • 3.
    10-3 Phases of QualityAssurance Acceptance sampling Process control Continuous improvement Inspection of lots before/after production Inspection and corrective action during production Quality built into the process The least progressive The most progressive Figure 10.1
  • 4.
    10-4 Inspection  How Much/HowOften  Where/When  Centralized vs. On-site Inputs Transformation Outputs Acceptance sampling Process control Acceptance sampling Figure 10.2
  • 5.
    10-5 Cost Optimal Amount of Inspection InspectionCosts Cost of inspection Cost of passing defectives Total Cost Figure 10.3
  • 6.
    10-6 Where to Inspectin the Process  Raw materials and purchased parts  Finished products  Before a costly operation  Before an irreversible process  Before a covering process
  • 7.
    10-7 Examples of InspectionPoints Type of business Inspection points Characteristics Fast Food Cashier Counter area Eating area Building Kitchen Accuracy Appearance, productivity Cleanliness Appearance Health regulations Hotel/motel Parking lot Accounting Building Main desk Safe, well lighted Accuracy, timeliness Appearance, safety Waiting times Supermarket Cashiers Deliveries Accuracy, courtesy Quality, quantity Table 10.1
  • 8.
    10-8 Statistical Process Control: Statisticalevaluation of the output of a process during production Quality of Conformance: A product or service conforms to specifications Statistical Control
  • 9.
    10-9 Control Chart  ControlChart  Purpose: to monitor process output to see if it is random  A time ordered plot representative sample statistics obtained from an on going process (e.g. sample means)  Upper and lower control limits define the range of acceptable variation
  • 10.
    10-10 Control Chart 0 12 3 4 5 6 7 8 9 10 11 12 13 14 15 UCL LCL Sample number Mean Out of control Normal variation due to chance Abnormal variation due to assignable sources Abnormal variation due to assignable sources Figure 10.4
  • 11.
    10-11 Statistical Process Control The essence of statistical process control is to assure that the output of a process is random so that future output will be random.
  • 12.
    10-12 Statistical Process Control The Control Process  Define  Measure  Compare  Evaluate  Correct  Monitor results
  • 13.
    10-13 Statistical Process Control Variations and Control  Random variation: Natural variations in the output of a process, created by countless minor factors  Assignable variation: A variation whose source can be identified
  • 14.
  • 15.
    10-15 Normal Distribution Mean    95.44% 99.74% Standard deviation Figure 10.6
  • 16.
  • 17.
    10-17 SPC Errors  TypeI error  Concluding a process is not in control when it actually is.  Type II error  Concluding a process is in control when it is not.
  • 18.
    10-18 Type I andType II Errors In control Out of control In control No Error Type I error (producers risk) Out of control Type II Error (consumers risk) No error Table 10.2
  • 19.
    10-19 Type I Error Mean LCLUCL /2 /2 Probability of Type I error Figure 10.8
  • 20.
    10-20 Observations from Sample Distribution Samplenumber UCL LCL 1 2 3 4 Figure 10.9
  • 21.
    10-21 Control Charts forVariables  Mean control charts  Used to monitor the central tendency of a process.  X bar charts  Range control charts  Used to monitor the process dispersion  R charts Variables generate data that are measured.
  • 22.
    10-22 Mean and RangeCharts UCL LCL UCL LCL R-chart x-Chart Detects shift Does not detect shift Figure 10.10A (process mean is shifting upward) Sampling Distribution
  • 23.
    10-23 x-Chart UCL Does not reveal increase Meanand Range Charts UCL LCL LCL R-chart Reveals increase Figure 10.10B (process variability is increasing) Sampling Distribution
  • 24.
    10-24 Control Chart forAttributes  p-Chart - Control chart used to monitor the proportion of defectives in a process  c-Chart - Control chart used to monitor the number of defects per unit Attributes generate data that are counted.
  • 25.
    10-25 Use of p-Charts When observations can be placed into two categories.  Good or bad  Pass or fail  Operate or don’t operate  When the data consists of multiple samples of several observations each Table 10.4
  • 26.
    10-26 Use of c-Charts Use only when the number of occurrences per unit of measure can be counted; non-occurrences cannot be counted.  Scratches, chips, dents, or errors per item  Cracks or faults per unit of distance  Breaks or Tears per unit of area  Bacteria or pollutants per unit of volume  Calls, complaints, failures per unit of time Table 10.4
  • 27.
    10-27 Use of ControlCharts  At what point in the process to use control charts  What size samples to take  What type of control chart to use  Variables  Attributes
  • 28.
    10-28 Run Tests  Runtest – a test for randomness  Any sort of pattern in the data would suggest a non-random process  All points are within the control limits - the process may not be random
  • 29.
    10-29 Nonrandom Patterns inControl charts  Trend  Cycles  Bias  Mean shift  Too much dispersion
  • 30.
    10-30 Counting Above/Below MedianRuns (7 runs) Counting Up/Down Runs (8 runs) U U D U D U D U U D B A A B A B B B A A B Figure 10.12 Figure 10.13 Counting Runs
  • 31.
    10-31 NonRandom Variation  Managersshould have response plans to investigate cause  May be false alarm (Type I error)  May be assignable variation
  • 32.
    10-32  Tolerances orspecifications  Range of acceptable values established by engineering design or customer requirements  Process variability  Natural variability in a process  Process capability  Process variability relative to specification Process Capability
  • 33.
    10-33 Process Capability Lower Specification Upper Specification A. Processvariability matches specifications Lower Specification Upper Specification B. Process variability well within specifications Lower Specification Upper Specification C. Process variability exceeds specifications Figure 10.15
  • 34.
    10-34 Process Capability Ratio Processcapability ratio, Cp = specification width process width Upper specification – lower specification 6 Cp =            3 X - UTL or 3 LTL X min = Cpk If the process is centered use Cp If the process is not centered use Cpk
  • 35.
    10-35 Limitations of CapabilityIndexes 1. Process may not be stable 2. Process output may not be normally distributed 3. Process not centered but Cp is used
  • 36.
    10-36 Example 8 Machine Standard Deviation Machine Capability Cp A0.13 0.78 0.80/0.78 = 1.03 B 0.08 0.48 0.80/0.48 = 1.67 C 0.16 0.96 0.80/0.96 = 0.83 Cp > 1.33 is desirable Cp = 1.00 process is barely capable Cp < 1.00 process is not capable
  • 37.
    10-37 Process mean Lower specification Upper specification 1350 ppm 1350ppm 1.7 ppm 1.7 ppm +/- 3 Sigma +/- 6 Sigma 3 Sigma and 6 Sigma Quality
  • 38.
    10-38 Improving Process Capability Simplify  Standardize  Mistake-proof  Upgrade equipment  Automate
  • 39.
  • 40.