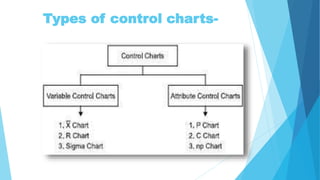
Control charts are graphs used to study how a process changes over time by plotting data points in time order. A control chart contains a central line for the average, and upper and lower control limits determined from historical data. There are variable control charts that measure things like weight, and attribute control charts that count outcomes like defects. Control charts help determine whether a process is stable or experiencing unusual variations so quality can be ensured. While useful, control charts have been criticized for how they model processes and compare performance.