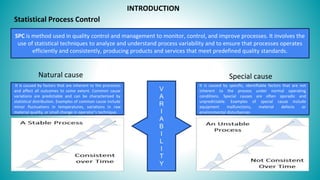
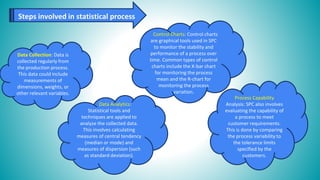
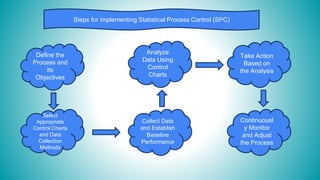
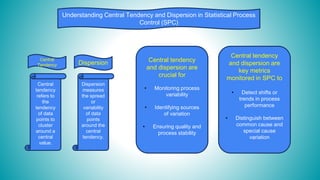
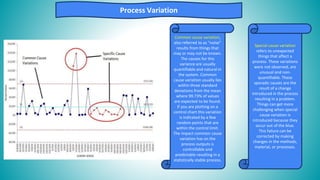
PRESENTED BY
GROUP 11
P. ASHWIN AYAPPADAS-231250092
UTTKARSH YADAV-231250160
VIVEK KUMAR-231250165
TARUN KUMAR-231250151
TUSHAR SINGH-231250154
STATISTICAL
PROCESS
CONTROL
Submitted to:- Proof. Suvendu Naskar
INTRODUCTION
SPC is method used in quality control and management to monitor, control, and improve processes. It involves the
use of statistical techniques to analyze and understand process variability and to ensure that processes operates
efficiently and consistently, producing products and services that meet predefined quality standards.
Statistical Process Control
It is caused by factors that are inherent to the processes
and affect all outcomes to some extent. Common cause
variations are predictable and can be characterized by
statistical distribution. Examples of common cause include
minor fluctuations in temperatures, variations in raw
material quality, or small change in operator’s technique.
It is caused by specific, identifiable factors that are not
inherent to the process under normal operating
conditions. Special causes are often sporadic and
unpredictable. Examples of special cause include
equipment malfunctions, material defects or
environmental disturbances
Natural cause Special cause
V
A
R
I
A
B
I
L
I
T
Y
Steps involved in statistical process
Data Collection: Data is
collected regularly from
the production process.
This data could include
measurements of
dimensions, weights, or
other relevant variables.
Data Analytics:
Statistical tools and
techniques are applied to
analyze the collected data.
This involves calculating
measures of central tendency
(median or mode) and
measures of dispersion (such
as standard deviation).
Control Charts: Control charts
are graphical tools used in SPC
to monitor the stability and
performance of a process over
time. Common types of control
charts include the X-bar chart
for monitoring the process
mean and the R-chart for
monitoring the process
variation.
Process Capability
Analysis: SPC also involves
evaluating the capability of
a process to meet
customer requirements.
This is done by comparing
the process variability to
the tolerance limits
specified by the
customers.
Steps for implementing Statistical Process Control (SPC)
Define the
Process and
its
Objectives
Select
Appropriate
Control Charts
and Data
Collection
Methods
Analyze
Data Using
Control
Charts
Collect Data
and Establish
Baseline
Performance
Take Action
Based on
the Analysis
Continuousl
y Monitor
and Adjust
the Process
Understanding Central Tendency and Dispersion in Statistical Process
Control (SPC)
Central
tendency
refers to
the
tendency
of data
points to
cluster
around a
central
value.
Dispersion
measures
the spread
or
variability
of data
points
around the
central
tendency.
Central
Tendency Dispersion Central tendency
and dispersion are
crucial for
• Monitoring process
variability
• Identifying sources
of variation
• Ensuring quality and
process stability
Central tendency
and dispersion are
key metrics
monitored in SPC to
• Detect shifts or
trends in process
performance
• Distinguish between
common cause and
special cause
variation
The control chart is a graph used
to study how processes changes
over time. Data are plotted in time
order. A control chart always has a
central line for average, upper line
for the upper control limit, and a
lower line for the lower control
limit. These lines are determined
from the historical data. By
comparing current data to these
lines, you can draw conclusions
about whether the process
variation is due to natural cause or
due to special cause.
CONTROL CHARTS
Process Control Chart
Plots the process mean over time. Use to
track the process level and detect the
presence of special causes affecting the
mean.
Plots the process range over time. Use to
track process variation and detect
unexpected variation.
Plots the process standard deviation
over time. Use to track the process
variation and detect unexpected
variation.
Plots the cumulative scores based on
"zones" at 1, 2, and 3 standard deviations
from the center line. Use to detect
unexpected variation.
Variable
Control
Chart
Variables control charts plot continuous
measurement process data, such as length or
pressure, in a time-ordered sequence. There
are two main types of variables control charts:
charts for data collected in subgroups and
charts for individual measurements. Variables
control charts for subgroups include Xbar, R,
S, and Zone.
Process Control Chart
P chart is one of the quality control charts used to assess
trends and patterns in counts of binary events (e.g., pass,
fail) over time. p charts are used when the subgroups are
not equal in size and compute control limits based on the
binomial distribution.
C chart is also known as the control chart for defects (i.e.,
counting the number of defects). It generally monitors the
number of defects in consistently sized units.
Attribute
Control
Chart
In contrast, attribute control charts plot count data, such as the number of defects or
defective units. If your process can be measured in attribute data, then attribute charts
can show you exactly where in the process you’re having problems, if any. Attribute
Control Charts include p-charts and c-charts.
Process Variation
Process variation (also known as process variance or process variability) can be defined as the numerical value
indicating how far processes vary from their expected performance. This is a leading cause of quality issues in
production and transactional processes. Many times, product quality issues are not identified until it has turned
into a large-scale disaster.
two types of process variation
Common
cause
variation
Special
cause
variation
Common cause variation,
also referred to as “noise”
results from things that
may or may not be known.
The causes for this
variance are usually
quantifiable and natural in
the system. Common
cause variation usually lies
within three standard
deviations from the mean
where 99.73% of values
are expected to be found.
If you are plotting on a
control chart this variation
is indicated by a few
random points that are
within the control limit.
The impact common cause
variation has on the
process outputs is
controllable and
predictable resulting in a
statistically stable process.
Special cause variation
refers to unexpected
things that affect a
process. These variations
were not observed, are
unusual and non-
quantifiable. These
sporadic causes are the
result of a change
introduced in the process
resulting in a problem.
Things can get more
challenging when special
cause variation is
introduced because they
occur out of the blue.
This failure can be
corrected by making
changes in the methods,
material, or processes.
Process Variation
Enhancing Process Stability and Performance with SPC
Early problem
detection by
Real-time
monitoring
Improved product
quality,Consistent
processes within
specifications
ensure higher
quality products
Reduction of
variation Identify
and eliminate
sources of
unwanted
variation
Waste and
rework
minimization By
preventing
defects upfront
Data-driven
decision making
by objective,
quantifiable data
that facilitates
informed process
improvement
choices.
Cost of
implementation
Complexity
Data collection
Misinterpretation of
results
Sustaining usage
Challenges
of SPC
Implementati
on

Statistical Process Control in Operation Mnagement

  • 1.
    PRESENTED BY GROUP 11 P.ASHWIN AYAPPADAS-231250092 UTTKARSH YADAV-231250160 VIVEK KUMAR-231250165 TARUN KUMAR-231250151 TUSHAR SINGH-231250154 STATISTICAL PROCESS CONTROL Submitted to:- Proof. Suvendu Naskar
  • 2.
    INTRODUCTION SPC is methodused in quality control and management to monitor, control, and improve processes. It involves the use of statistical techniques to analyze and understand process variability and to ensure that processes operates efficiently and consistently, producing products and services that meet predefined quality standards. Statistical Process Control It is caused by factors that are inherent to the processes and affect all outcomes to some extent. Common cause variations are predictable and can be characterized by statistical distribution. Examples of common cause include minor fluctuations in temperatures, variations in raw material quality, or small change in operator’s technique. It is caused by specific, identifiable factors that are not inherent to the process under normal operating conditions. Special causes are often sporadic and unpredictable. Examples of special cause include equipment malfunctions, material defects or environmental disturbances Natural cause Special cause V A R I A B I L I T Y
  • 3.
    Steps involved instatistical process Data Collection: Data is collected regularly from the production process. This data could include measurements of dimensions, weights, or other relevant variables. Data Analytics: Statistical tools and techniques are applied to analyze the collected data. This involves calculating measures of central tendency (median or mode) and measures of dispersion (such as standard deviation). Control Charts: Control charts are graphical tools used in SPC to monitor the stability and performance of a process over time. Common types of control charts include the X-bar chart for monitoring the process mean and the R-chart for monitoring the process variation. Process Capability Analysis: SPC also involves evaluating the capability of a process to meet customer requirements. This is done by comparing the process variability to the tolerance limits specified by the customers.
  • 4.
    Steps for implementingStatistical Process Control (SPC) Define the Process and its Objectives Select Appropriate Control Charts and Data Collection Methods Analyze Data Using Control Charts Collect Data and Establish Baseline Performance Take Action Based on the Analysis Continuousl y Monitor and Adjust the Process
  • 5.
    Understanding Central Tendencyand Dispersion in Statistical Process Control (SPC) Central tendency refers to the tendency of data points to cluster around a central value. Dispersion measures the spread or variability of data points around the central tendency. Central Tendency Dispersion Central tendency and dispersion are crucial for • Monitoring process variability • Identifying sources of variation • Ensuring quality and process stability Central tendency and dispersion are key metrics monitored in SPC to • Detect shifts or trends in process performance • Distinguish between common cause and special cause variation
  • 6.
    The control chartis a graph used to study how processes changes over time. Data are plotted in time order. A control chart always has a central line for average, upper line for the upper control limit, and a lower line for the lower control limit. These lines are determined from the historical data. By comparing current data to these lines, you can draw conclusions about whether the process variation is due to natural cause or due to special cause. CONTROL CHARTS
  • 7.
    Process Control Chart Plotsthe process mean over time. Use to track the process level and detect the presence of special causes affecting the mean. Plots the process range over time. Use to track process variation and detect unexpected variation. Plots the process standard deviation over time. Use to track the process variation and detect unexpected variation. Plots the cumulative scores based on "zones" at 1, 2, and 3 standard deviations from the center line. Use to detect unexpected variation. Variable Control Chart Variables control charts plot continuous measurement process data, such as length or pressure, in a time-ordered sequence. There are two main types of variables control charts: charts for data collected in subgroups and charts for individual measurements. Variables control charts for subgroups include Xbar, R, S, and Zone.
  • 8.
    Process Control Chart Pchart is one of the quality control charts used to assess trends and patterns in counts of binary events (e.g., pass, fail) over time. p charts are used when the subgroups are not equal in size and compute control limits based on the binomial distribution. C chart is also known as the control chart for defects (i.e., counting the number of defects). It generally monitors the number of defects in consistently sized units. Attribute Control Chart In contrast, attribute control charts plot count data, such as the number of defects or defective units. If your process can be measured in attribute data, then attribute charts can show you exactly where in the process you’re having problems, if any. Attribute Control Charts include p-charts and c-charts.
  • 9.
    Process Variation Process variation(also known as process variance or process variability) can be defined as the numerical value indicating how far processes vary from their expected performance. This is a leading cause of quality issues in production and transactional processes. Many times, product quality issues are not identified until it has turned into a large-scale disaster. two types of process variation Common cause variation Special cause variation
  • 10.
    Common cause variation, alsoreferred to as “noise” results from things that may or may not be known. The causes for this variance are usually quantifiable and natural in the system. Common cause variation usually lies within three standard deviations from the mean where 99.73% of values are expected to be found. If you are plotting on a control chart this variation is indicated by a few random points that are within the control limit. The impact common cause variation has on the process outputs is controllable and predictable resulting in a statistically stable process. Special cause variation refers to unexpected things that affect a process. These variations were not observed, are unusual and non- quantifiable. These sporadic causes are the result of a change introduced in the process resulting in a problem. Things can get more challenging when special cause variation is introduced because they occur out of the blue. This failure can be corrected by making changes in the methods, material, or processes. Process Variation
  • 11.
    Enhancing Process Stabilityand Performance with SPC Early problem detection by Real-time monitoring Improved product quality,Consistent processes within specifications ensure higher quality products Reduction of variation Identify and eliminate sources of unwanted variation Waste and rework minimization By preventing defects upfront Data-driven decision making by objective, quantifiable data that facilitates informed process improvement choices.
  • 12.
    Cost of implementation Complexity Data collection Misinterpretationof results Sustaining usage Challenges of SPC Implementati on