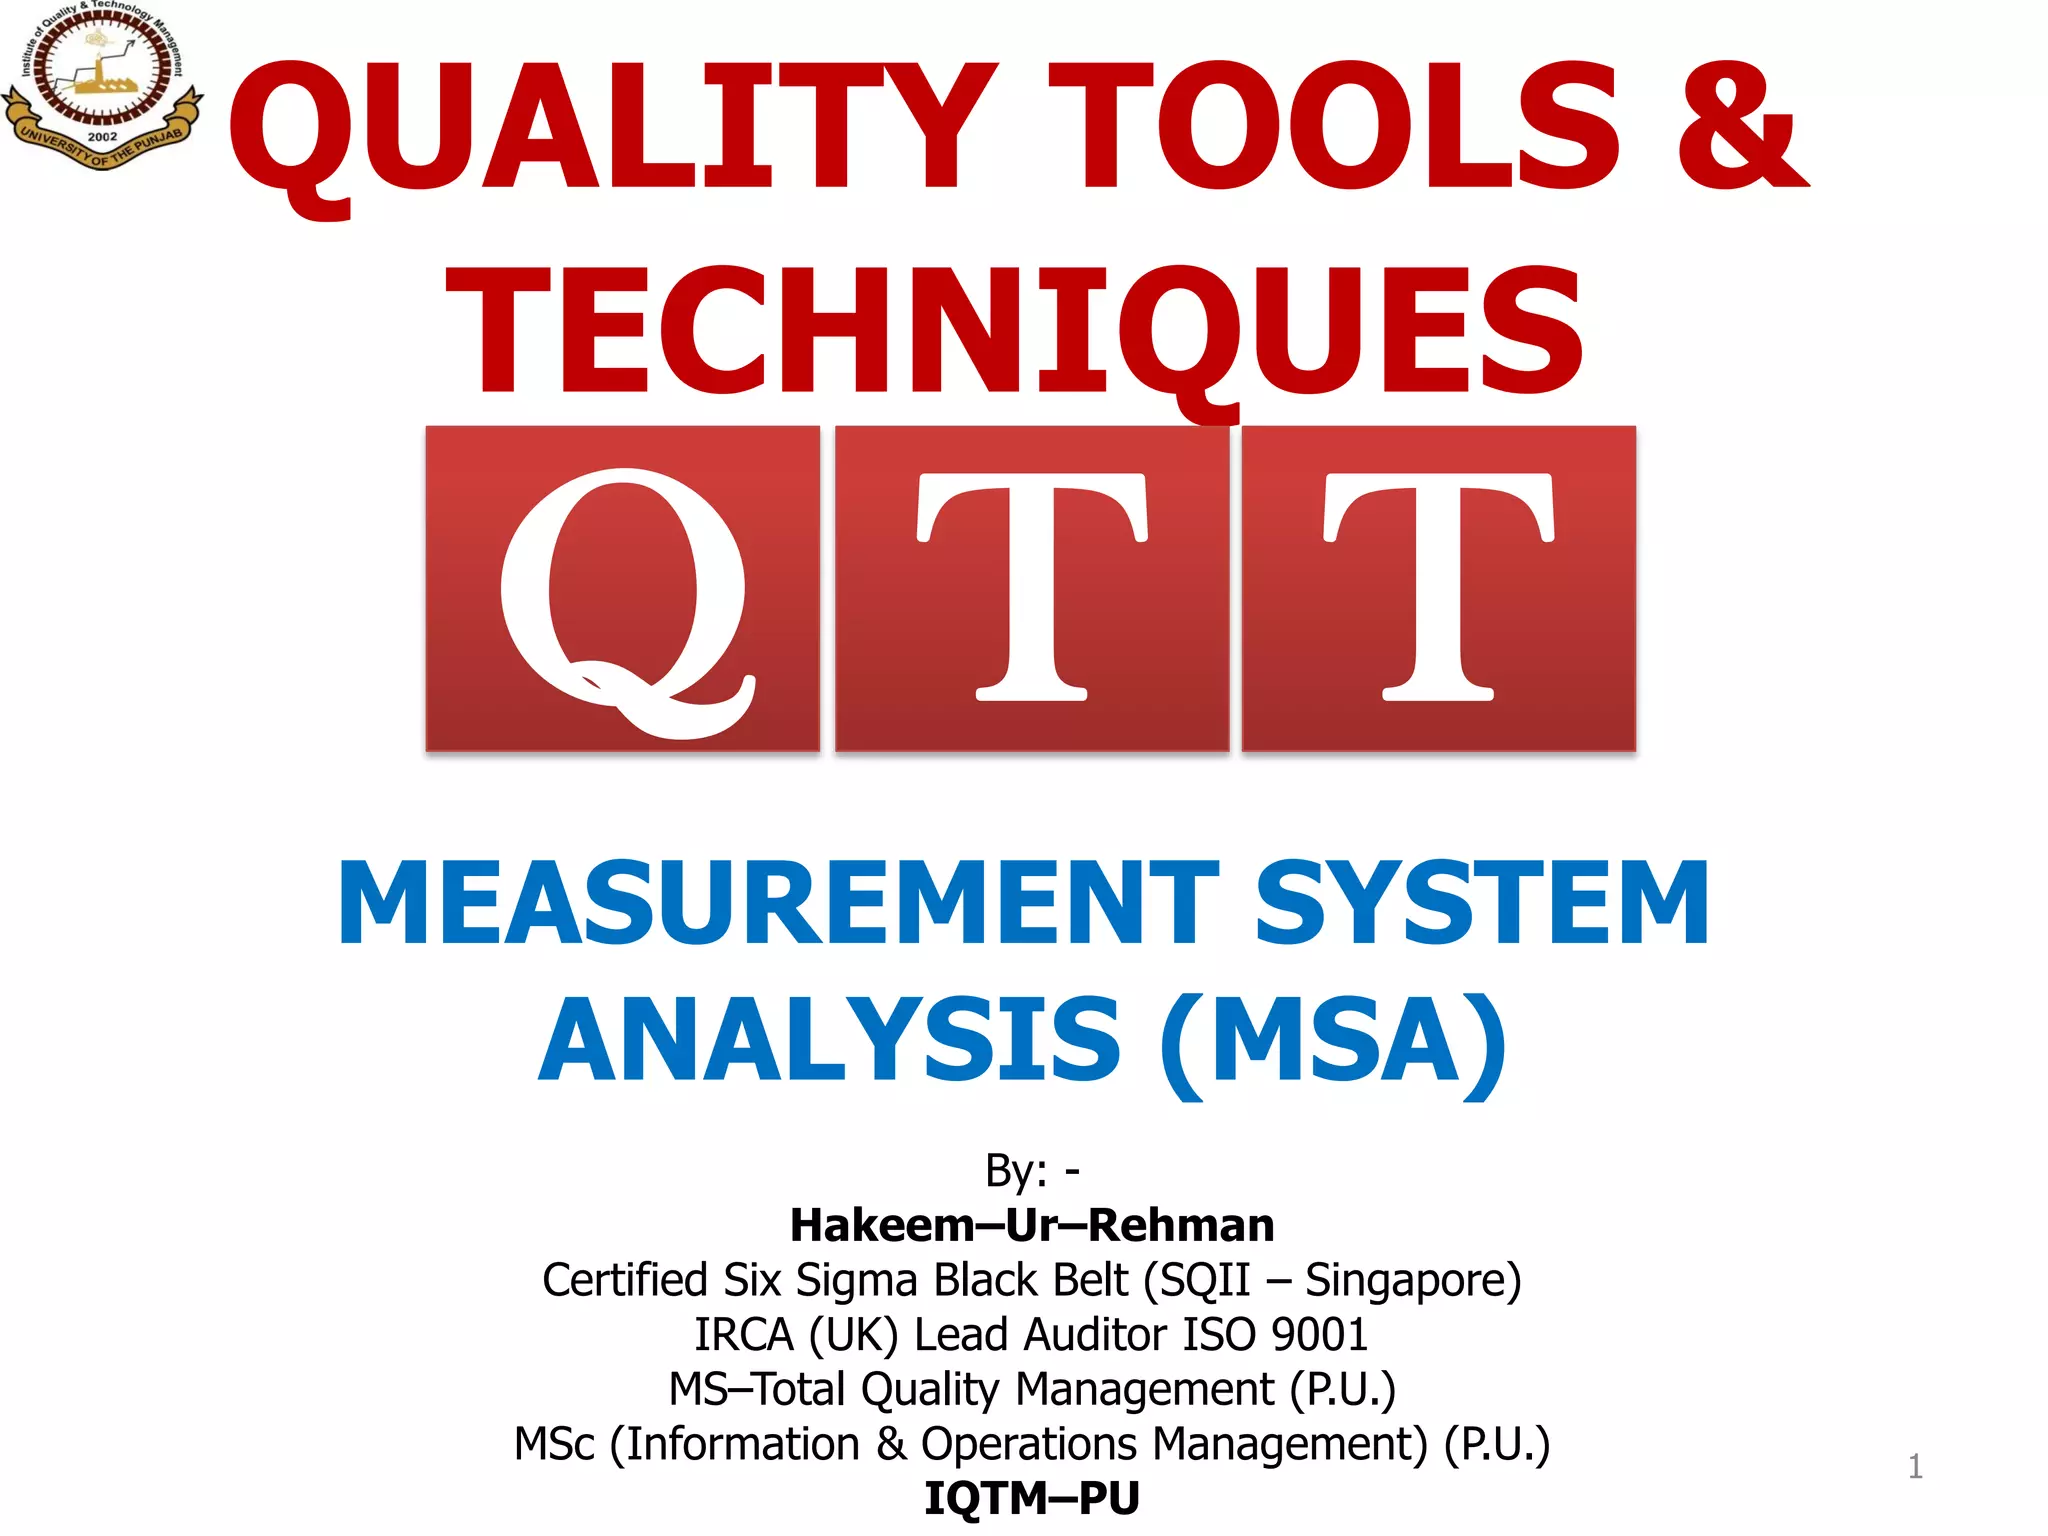
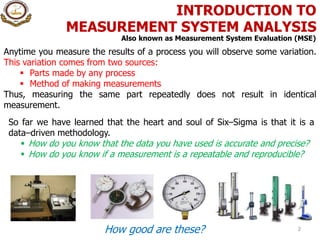
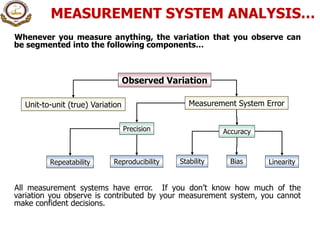
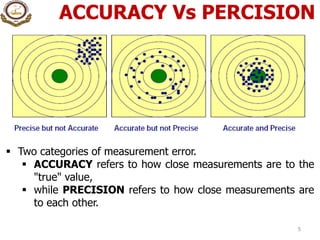
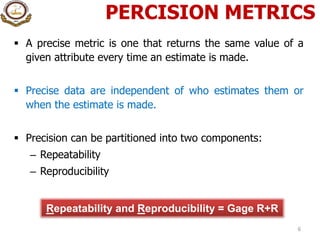
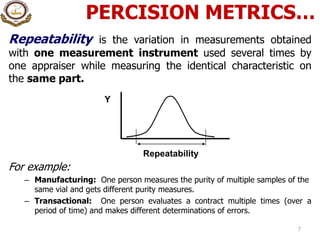
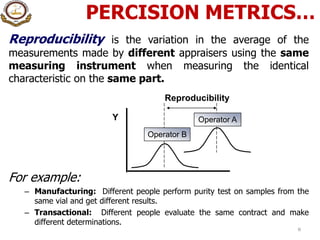
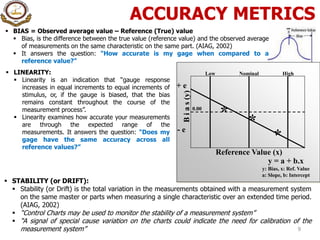
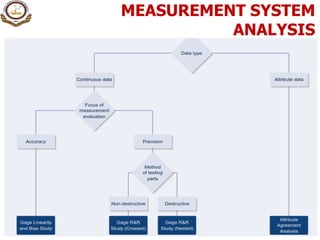
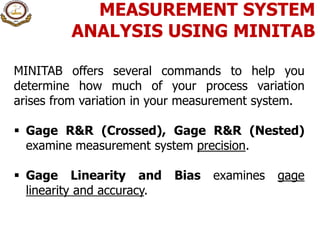
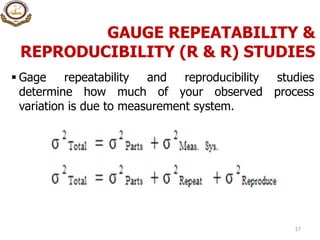
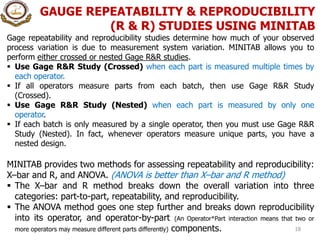
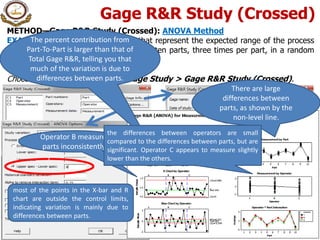
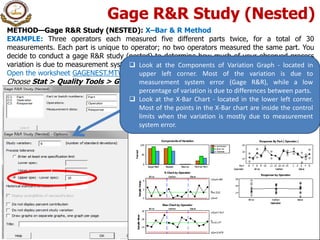
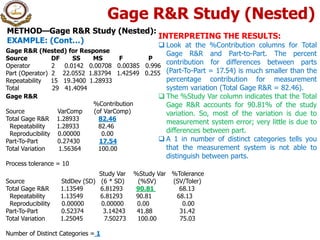
This document provides an introduction to measurement system analysis (MSA). It defines key terms related to measurement precision and accuracy, including repeatability, reproducibility, bias, linearity, and stability. It also describes how to use Minitab to conduct various types of MSA, including gauge repeatability and reproducibility studies, gauge linearity and bias studies, and attribute versus variable gauges. The goal of MSA is to determine how much observed process variation is due to the measurement system versus real variation between parts.
What is MSA .
1. Why we Need MSA
2. How to use data.
3.Measurement Error Sources of Variation
• Precision (Resolution, Repeat ability, Reproducibility)
•Accuracy (Bias, Stability, Linearity)
4.What is Gage R&R?
5.Explain MSA Sheet
Measurement System Analysis (MSA) course is essential for successful Six Sigma DMAIC and DFSS projects. It is also key for implementation of SQC, and efficient process management.
Reliable measurement processes are critical to the success of any effort dependent on measurement data and process analysis, including Six Sigma DMAIC improvement projects, DFSS project, SPC, SQC, Supplier Quality, and business process management and continuous improvement. Without validation that measurements are accurate, repeatable with multiple measurements by the same person, reproducible from person to person (gage Repeatability and Reproducibility or gage R&R), all conclusions are suspect, and process management is therefore fragile and ineffective.
Organizations typically focus on measurement accuracy and calibration, but this course also emphasizes the essential elements of reliable measurement procedures.
An illustration on the Measurement System Analysis(MSA) which leads to Excellence in Dimensional integrity. A complete journey through the process and explanations for implementation.
Detailed illustration of MSA procedures both for Variable and attribute, Analysis of results and planning for MSA. Complete guidance for planning and implementation of MSA.
THIS PPT IS ABOUT MEASUREMENT SYSTEM ANALYSIS.. THIS IS VERY USEFUL FOR PERSON WORKING IN INDUSTRY. IT ALSO TALK ABOUT SIX SIGMA APPROACH FOR EFFECTIVE MEASUREMENT.REPEATIBILITY & REPRODUCIBILITY ARE ALSO WELL EXPLAINED IN THIS PPT.
Dear All, I have prepared this presentation to get a better understanding of Statistical Process Control (SPC). This is a very informative presentation and giving information about the History of SPC, the basics of SPC, the PDCA approach, the Benefits of SPC, application of 7-QC tools for problem-solving. You can follow this technique in your day to day business working to solve the problems. Thanking you.
Measuremen Systems Analysis Training ModuleFrank-G. Adler
The Six Sigma Measurement Systems Analysis (MSA) Training Module includes a MS PowerPoint Presentation including 62 slides covering an Introduction to Measurement Systems Analysis - Relevance - Discrimination - Accuracy - Stability - Linearity - Precision, Variable Gage R&R Study, and Attribute Gage R&R Study.
Measurement System Analysis is the first step of the Measure Phase of an improvement project. Before you can pass judgment on the process, you need to ensure that your measurement system is accurate, precise, capable and in control.
Measurement systems analysis and a study of anova methodeSAT Journals
Abstract
Instruments and measurement systems form the base of any process improvement strategies. The much widely used QC tools like
SPC depends on sample data taken from processes to track process variation which in turn depends on measuring system itself.
The purpose of Measurement System Analysis is to qualify a measurement system for use by quantifying its accuracy, precision,
and stability and to minimize their contribution in process variation through inherent tools such as ANOVA. The purpose of this
paper is to outline MSA and study ANOVA method through a real-time shop floor experiment.
Keywords: SPC, Accuracy, Precision, Stability, QC, ANOVA
"Six Sigma Green Belt Training Part 8" published by Skillogic.
If you are looking for six sigma training in Chennai, Mumbai and Hyderabad, then visit SKillogic. Regular batches are running during the weekends.
Measurement Systems Analysis - Variable Gage R&R Study Metrics, Applications ...Gabor Szabo, CQE
This presentation walks you through the components of variation and the various metrics used in Variable Gage R&R Study. It also talks about the different root causes associated with a failing study, and how to perform root cause analysis using statistical tools.
IJERA (International journal of Engineering Research and Applications) is International online, ... peer reviewed journal. For more detail or submit your article, please visit www.ijera.com
International Journal of Engineering Research and Applications (IJERA) is an open access online peer reviewed international journal that publishes research and review articles in the fields of Computer Science, Neural Networks, Electrical Engineering, Software Engineering, Information Technology, Mechanical Engineering, Chemical Engineering, Plastic Engineering, Food Technology, Textile Engineering, Nano Technology & science, Power Electronics, Electronics & Communication Engineering, Computational mathematics, Image processing, Civil Engineering, Structural Engineering, Environmental Engineering, VLSI Testing & Low Power VLSI Design etc.
Explore the innovative world of trenchless pipe repair with our comprehensive guide, "The Benefits and Techniques of Trenchless Pipe Repair." This document delves into the modern methods of repairing underground pipes without the need for extensive excavation, highlighting the numerous advantages and the latest techniques used in the industry.
Learn about the cost savings, reduced environmental impact, and minimal disruption associated with trenchless technology. Discover detailed explanations of popular techniques such as pipe bursting, cured-in-place pipe (CIPP) lining, and directional drilling. Understand how these methods can be applied to various types of infrastructure, from residential plumbing to large-scale municipal systems.
Ideal for homeowners, contractors, engineers, and anyone interested in modern plumbing solutions, this guide provides valuable insights into why trenchless pipe repair is becoming the preferred choice for pipe rehabilitation. Stay informed about the latest advancements and best practices in the field.
About
Indigenized remote control interface card suitable for MAFI system CCR equipment. Compatible for IDM8000 CCR. Backplane mounted serial and TCP/Ethernet communication module for CCR remote access. IDM 8000 CCR remote control on serial and TCP protocol.
• Remote control: Parallel or serial interface.
• Compatible with MAFI CCR system.
• Compatible with IDM8000 CCR.
• Compatible with Backplane mount serial communication.
• Compatible with commercial and Defence aviation CCR system.
• Remote control system for accessing CCR and allied system over serial or TCP.
• Indigenized local Support/presence in India.
• Easy in configuration using DIP switches.
Technical Specifications
Indigenized remote control interface card suitable for MAFI system CCR equipment. Compatible for IDM8000 CCR. Backplane mounted serial and TCP/Ethernet communication module for CCR remote access. IDM 8000 CCR remote control on serial and TCP protocol.
Key Features
Indigenized remote control interface card suitable for MAFI system CCR equipment. Compatible for IDM8000 CCR. Backplane mounted serial and TCP/Ethernet communication module for CCR remote access. IDM 8000 CCR remote control on serial and TCP protocol.
• Remote control: Parallel or serial interface
• Compatible with MAFI CCR system
• Copatiable with IDM8000 CCR
• Compatible with Backplane mount serial communication.
• Compatible with commercial and Defence aviation CCR system.
• Remote control system for accessing CCR and allied system over serial or TCP.
• Indigenized local Support/presence in India.
Application
• Remote control: Parallel or serial interface.
• Compatible with MAFI CCR system.
• Compatible with IDM8000 CCR.
• Compatible with Backplane mount serial communication.
• Compatible with commercial and Defence aviation CCR system.
• Remote control system for accessing CCR and allied system over serial or TCP.
• Indigenized local Support/presence in India.
• Easy in configuration using DIP switches.
Industrial Training at Shahjalal Fertilizer Company Limited (SFCL)MdTanvirMahtab2
This presentation is about the working procedure of Shahjalal Fertilizer Company Limited (SFCL). A Govt. owned Company of Bangladesh Chemical Industries Corporation under Ministry of Industries.
CFD Simulation of By-pass Flow in a HRSG module by R&R Consult.pptxR&R Consult
CFD analysis is incredibly effective at solving mysteries and improving the performance of complex systems!
Here's a great example: At a large natural gas-fired power plant, where they use waste heat to generate steam and energy, they were puzzled that their boiler wasn't producing as much steam as expected.
R&R and Tetra Engineering Group Inc. were asked to solve the issue with reduced steam production.
An inspection had shown that a significant amount of hot flue gas was bypassing the boiler tubes, where the heat was supposed to be transferred.
R&R Consult conducted a CFD analysis, which revealed that 6.3% of the flue gas was bypassing the boiler tubes without transferring heat. The analysis also showed that the flue gas was instead being directed along the sides of the boiler and between the modules that were supposed to capture the heat. This was the cause of the reduced performance.
Based on our results, Tetra Engineering installed covering plates to reduce the bypass flow. This improved the boiler's performance and increased electricity production.
It is always satisfying when we can help solve complex challenges like this. Do your systems also need a check-up or optimization? Give us a call!
Work done in cooperation with James Malloy and David Moelling from Tetra Engineering.
More examples of our work https://www.r-r-consult.dk/en/cases-en/
Sachpazis:Terzaghi Bearing Capacity Estimation in simple terms with Calculati...Dr.Costas Sachpazis
Terzaghi's soil bearing capacity theory, developed by Karl Terzaghi, is a fundamental principle in geotechnical engineering used to determine the bearing capacity of shallow foundations. This theory provides a method to calculate the ultimate bearing capacity of soil, which is the maximum load per unit area that the soil can support without undergoing shear failure. The Calculation HTML Code included.
Hybrid optimization of pumped hydro system and solar- Engr. Abdul-Azeez.pdffxintegritypublishin
Advancements in technology unveil a myriad of electrical and electronic breakthroughs geared towards efficiently harnessing limited resources to meet human energy demands. The optimization of hybrid solar PV panels and pumped hydro energy supply systems plays a pivotal role in utilizing natural resources effectively. This initiative not only benefits humanity but also fosters environmental sustainability. The study investigated the design optimization of these hybrid systems, focusing on understanding solar radiation patterns, identifying geographical influences on solar radiation, formulating a mathematical model for system optimization, and determining the optimal configuration of PV panels and pumped hydro storage. Through a comparative analysis approach and eight weeks of data collection, the study addressed key research questions related to solar radiation patterns and optimal system design. The findings highlighted regions with heightened solar radiation levels, showcasing substantial potential for power generation and emphasizing the system's efficiency. Optimizing system design significantly boosted power generation, promoted renewable energy utilization, and enhanced energy storage capacity. The study underscored the benefits of optimizing hybrid solar PV panels and pumped hydro energy supply systems for sustainable energy usage. Optimizing the design of solar PV panels and pumped hydro energy supply systems as examined across diverse climatic conditions in a developing country, not only enhances power generation but also improves the integration of renewable energy sources and boosts energy storage capacities, particularly beneficial for less economically prosperous regions. Additionally, the study provides valuable insights for advancing energy research in economically viable areas. Recommendations included conducting site-specific assessments, utilizing advanced modeling tools, implementing regular maintenance protocols, and enhancing communication among system components.
Final project report on grocery store management system..pdfKamal Acharya
In today’s fast-changing business environment, it’s extremely important to be able to respond to client needs in the most effective and timely manner. If your customers wish to see your business online and have instant access to your products or services.
Online Grocery Store is an e-commerce website, which retails various grocery products. This project allows viewing various products available enables registered users to purchase desired products instantly using Paytm, UPI payment processor (Instant Pay) and also can place order by using Cash on Delivery (Pay Later) option. This project provides an easy access to Administrators and Managers to view orders placed using Pay Later and Instant Pay options.
In order to develop an e-commerce website, a number of Technologies must be studied and understood. These include multi-tiered architecture, server and client-side scripting techniques, implementation technologies, programming language (such as PHP, HTML, CSS, JavaScript) and MySQL relational databases. This is a project with the objective to develop a basic website where a consumer is provided with a shopping cart website and also to know about the technologies used to develop such a website.
This document will discuss each of the underlying technologies to create and implement an e- commerce website.
1. QUALITY TOOLS &
TECHNIQUES
1
TQ T
MEASUREMENT SYSTEM
ANALYSIS (MSA)
By: -
Hakeem–Ur–Rehman
Certified Six Sigma Black Belt (SQII – Singapore)
IRCA (UK) Lead Auditor ISO 9001
MS–Total Quality Management (P.U.)
MSc (Information & Operations Management) (P.U.)
IQTM–PU
2. INTRODUCTION TO
MEASUREMENT SYSTEM ANALYSIS
2
So far we have learned that the heart and soul of Six–Sigma is that it is a
data–driven methodology.
How do you know that the data you have used is accurate and precise?
How do you know if a measurement is a repeatable and reproducible?
How good are these?
Also known as Measurement System Evaluation (MSE)
Anytime you measure the results of a process you will observe some variation.
This variation comes from two sources:
Parts made by any process
Method of making measurements
Thus, measuring the same part repeatedly does not result in identical
measurement.
3. MEASUREMENT SYSTEM
ANALYSIS: Definition
3
A measurement system may be defined as “the
collection of instruments or gages, standards,
operations, methods, fixtures, software, personnel,
environment and assumptions used to quantify a unit
of measure or fix assessment to the feature
characteristic being measured; the complete process
used to obtain the measurement.
(Automotive Industry Action Group – AIAG 2002 Standard)
4. MEASUREMENT SYSTEM ANALYSIS…
Whenever you measure anything, the variation that you observe can
be segmented into the following components…
All measurement systems have error. If you don’t know how much of the
variation you observe is contributed by your measurement system, you cannot
make confident decisions.
AccuracyPrecision
Repeatability Reproducibility
Measurement System ErrorUnit-to-unit (true) Variation
Observed Variation
Stability Bias Linearity
5. ACCURACY Vs PERCISION
5
Two categories of measurement error.
ACCURACY refers to how close measurements are to the
"true" value,
while PRECISION refers to how close measurements are
to each other.
6. PERCISION METRICS
6
A precise metric is one that returns the same value of a
given attribute every time an estimate is made.
Precise data are independent of who estimates them or
when the estimate is made.
Precision can be partitioned into two components:
– Repeatability
– Reproducibility
Repeatability and Reproducibility = Gage R+R
7. PERCISION METRICS…
7
Repeatability is the variation in measurements obtained
with one measurement instrument used several times by
one appraiser while measuring the identical characteristic on
the same part.
For example:
– Manufacturing: One person measures the purity of multiple samples of the
same vial and gets different purity measures.
– Transactional: One person evaluates a contract multiple times (over a
period of time) and makes different determinations of errors.
Repeatability
Y
8. PERCISION METRICS…
8
Reproducibility is the variation in the average of the
measurements made by different appraisers using the same
measuring instrument when measuring the identical
characteristic on the same part.
For example:
– Manufacturing: Different people perform purity test on samples from the
same vial and get different results.
– Transactional: Different people evaluate the same contract and make
different determinations.
Reproducibility
Operator A
Operator B
Y
9. ACCURACY METRICS
9
LINEARITY:
Linearity is an indication that “gauge response
increases in equal increments to equal increments of
stimulus, or, if the gauge is biased, that the bias
remains constant throughout the course of the
measurement process”.
Linearity examines how accurate your measurements
are through the expected range of the
measurements. It answers the question: "Does my
gage have the same accuracy across all
reference values?”
STABILITY (or DRIFT):
Stability (or Drift) is the total variation in the measurements obtained with a measurement system
on the same master or parts when measuring a single characteristic over an extended time period.
(AIAG, 2002)
“Control Charts may be used to monitor the stability of a measurement system”
“A signal of special cause variation on the charts could indicate the need for calibration of the
measurement system”
BIAS = Observed average value – Reference (True) value
Bias, is the difference between the true value (reference value) and the observed average
of measurements on the same characteristic on the same part. (AIAG, 2002)
It answers the question: "How accurate is my gage when compared to a
reference value?"
Nominal HighLow
*
*
*
Reference Value (x)
Bias(y)
0.00
+ e
- e
y = a + b.x
y: Bias, x: Ref. Value
a: Slope, b: Intercept
11. MEASUREMENT SYSTEM
ANALYSIS USING MINITAB
MINITAB offers several commands to help you
determine how much of your process variation
arises from variation in your measurement system.
Gage R&R (Crossed), Gage R&R (Nested)
examine measurement system precision.
Gage Linearity and Bias examines gage
linearity and accuracy.
12. MEASUREMENT SYSTEM ANALYSIS (Cont…)
12
BIAS AND LINEARITY (EXAMPLE):
A manufacturer wants to know if a thermometer is taking
accurate and consistent readings at five heat settings (202°,
204°, 206°, 208°, and 210°). Six readings are taken at each
setting.
To find out if the thermometer is taking biased
measurements, subtract the individual readings from the
reference value. The bias values for measurements taken at
heat setting 202° are calculated in the below table.
Thermometer
reading
Actual
temperature
BIAS
The temperature readings at the
202° heat setting are positively
biased; the thermometer gives
readings that are higher than
the actual temperature.
202.7 - 202 = 0.7
202.5 - 202 = 0.5
203.2 - 202 = 1.2
203.0 - 202 = 1.0
203.1 - 202 = 1.1
203.3 - 202 = 1.3
13. MEASUREMENT SYSTEM ANALYSIS (Cont…)
13
BIAS AND LINEARITY (EXAMPLE) (Cont…):
To interpret the linearity of the thermometer data, determine if
the bias of the thermometer changes across the heat settings.
If the data do not form a horizontal line on a scatter plot,
linearity is present.
The scatter plot shows that bias
changes as the heat settings
increase. Temperatures for lower
heat settings are higher than the
actual temperatures, while readings
for higher heat settings are lower
than the actual temperatures.
Because bias changes over the heat
settings, linearity is present in this
data.
14. GAGE LINEARITY AND BIAS STUDY
14
EXAMPLE: A plant foreman chose five parts that represented the expected range of the
measurements. Each part was measured by layout inspection to determine its reference (master)
value. Then, one operator randomly measured each part twelve times.
You obtained the process variation (16.5368) from a Gage R&R study using the ANOVA method.
Minitab displays the process variation in the Session window (Total Variation row of the Study Var
(6 * SD) column).
Open the worksheet GAGELIN.MTW
Choose Stat Quality Tools Gage Study Gage Linearity and Bias Study
15. GAGE LINEARITY AND BIAS STUDY:
EXAMPLE (Cont…)
15
INTERPRETATION RULE:
In (Gage Bias) Section; if
“Average” P–Value < 5%
So, Gage is Bias
In (Gage Linearity) Section;
if “Slope” P–Value < 5%,
So Gage is producing
Nonlinear Results
Good Gage must have more
linearity than bias
16. Types of MSA’s
MSA’s fall into two categories:
– Attribute
– Variable
Transactional projects typically have Attribute based measurement
systems.
Manufacturing projects generally use Variable studies more often, but do
use Attribute studies to a lesser degree.
Attribute
– Pass/Fail
– Go/No Go
– Document Preparation
– Surface imperfections
– Customer Service Response
Variable
– Continuous scale
– Discrete scale
– Critical dimensions
– Pull strength
– Warp
17. GAUGE REPEATABILITY &
REPRODUCIBILITY (R & R) STUDIES
17
Gage repeatability and reproducibility studies
determine how much of your observed process
variation is due to measurement system.
18. GAUGE REPEATABILITY & REPRODUCIBILITY
(R & R) STUDIES USING MINITAB
18
Gage repeatability and reproducibility studies determine how much of your observed
process variation is due to measurement system variation. MINITAB allows you to
perform either crossed or nested Gage R&R studies.
Use Gage R&R Study (Crossed) when each part is measured multiple times by
each operator.
If all operators measure parts from each batch, then use Gage R&R Study
(Crossed).
Use Gage R&R Study (Nested) when each part is measured by only one
operator.
If each batch is only measured by a single operator, then you must use Gage R&R
Study (Nested). In fact, whenever operators measure unique parts, you have a
nested design.
MINITAB provides two methods for assessing repeatability and reproducibility:
X–bar and R, and ANOVA. (ANOVA is better than X–bar and R method)
The X–bar and R method breaks down the overall variation into three
categories: part-to-part, repeatability, and reproducibility.
The ANOVA method goes one step further and breaks down reproducibility
into its operator, and operator-by-part (An Operator*Part interaction means that two or
more operators may measure different parts differently) components.
19. Gage R&R Study (Crossed)
METHOD—Gage R&R Study (Crossed): ANOVA Method
EXAMPLE: Ten parts were selected that represent the expected range of the process
variation. Three operators measured the ten parts, three times per part, in a random
order.
Open the worksheet GAGEAIAG.MTW
Choose Stat > Quality Tools > Gage Study > Gage R&R Study (Crossed).
The percent contribution from
Part-To-Part is larger than that of
Total Gage R&R, telling you that
much of the variation is due to
differences between parts.
There are large
differences between
parts, as shown by the
non-level line.
Operator B measures
parts inconsistently.
most of the points in the X-bar and R
chart are outside the control limits,
indicating variation is mainly due to
differences between parts.
the differences between operators are small
compared to the differences between parts, but are
significant. Operator C appears to measure slightly
lower than the others.
20. GUIDELINES FOR MEASUREMENT
SYSTEM ACCEPTABILITY
20
According to the Automobile Industry Action Group
(AIAG), you can determine whether your measurement
system is acceptable using the following guidelines.
If the Total Gage R&R contribution in the %Study Var
column (% Tolerance, %Process) is:
Less than 10% the measurement system is
acceptable.
Between 10% and 30% the measurement
system is acceptable depending on the application,
the cost of the measuring device , cost of repair, or
other factors.
Greater than 30% the measurement system is
unacceptable and should be improved.
If you are looking at the %Contribution column, the
corresponding standards are:
Less than 1% the measurement system is
acceptable.
Between 1% and 9% the measurement system is
acceptable depending on the application, the cost of
the measuring device, cost of repair, or other
factors.
Greater than 9% the measurement system is
unacceptable and should be improved.
According to the AIAG ,
when the number of distinct categories is 5 or more
it represents an adequate measuring system.
% Tolerance
or
% Study
Variance
% Contribution System is…
10% or less
10% - 20%
20% - 30%
30% or greater
1% or less
1% - 4%
5% - 9%
10% or greater
Ideal
Acceptable
Marginal
Poor
Here are the Automotive Industry
Action Group’s definitions for Gage
acceptance
21. Gage R&R Study (Crossed)
METHOD—Gage R&R Study (Crossed): ANOVA Method
Two-Way ANOVA Table With Interaction
Source DF SS MS F P
Part 9 88.3619 9.81799 492.291 0.000
Operator 2 3.1673 1.58363 79.406 0.000
Part * Operator 18 0.3590 0.01994 0.434 0.974
Repeatability 60 2.7589 0.04598
Total 89 94.6471
Alpha to remove interaction term = 0.25
If p-value for Operator * Part is > 0.25, Minitab
omits this from the full model. Notice there is
an ANOVA table without the interaction because
the p-value was 0.974.
Two-Way ANOVA Table Without Interaction
Source DF SS MS F P
Part 9 88.3619 9.81799 245.614 0.000
Operator 2 3.1673 1.58363 39.617 0.000
Repeatability 78 3.1179 0.03997
Total 89 94.6471Gage R&R
%Contribution
Source VarComp (of VarComp)
Total Gage R&R 0.09143 7.76
Repeatability 0.03997 3.39
Reproducibility 0.05146 4.37
Operator 0.05146 4.37
Part-To-Part 1.08645 92.24
Total Variation 1.17788 100.00
Between 1% and 9% the measurement system
is acceptable depending on the application, the
cost of the measuring device, cost of repair, or
other factors. (AIAG)
Study Var %Study Var %Tolerance
Source StdDev (SD) (6 * SD) (%SV) (SV/Toler)
Total Gage R&R 0.30237 1.81423 27.86 22.68
Repeatability 0.19993 1.19960 18.42 14.99
Reproducibility 0.22684 1.36103 20.90 17.01
Operator 0.22684 1.36103 20.90 17.01
Part-To-Part 1.04233 6.25396 96.04 78.17
Total Variation 1.08530 6.51180 100.00 81.40
Number of Distinct Categories = 4
Between 10% and 30% the measurement
system is acceptable depending on the
application, the cost of the measuring device ,
cost of repair, or other factors
number of distinct categories is 5
represents an adequate measuring system
22. Gage R&R Study (Crossed)
22
METHOD—Gage R&R Study (Crossed): X–Bar & R Method
EXAMPLE: Ten parts were selected that represent the expected range of the process
variation. Three operators measured the ten parts, three times per part, in a random
order.
Open the worksheet GAGEAIAG.MTW
Choose Stat > Quality Tools > Gage Study > Gage R&R Study (Crossed).
22
In the Components of Variation graph, a low percentage
of variation (7.13%) is due to the measurement system
(Gage R&R), and a high percentage (92.87%) is due to
differences between parts. (See your Session Window)
Most of the points in the X–Bar Chart are outside the
control limits when the variation is mainly due to part-to-
part differences.
23. Gage R&R Study (Crossed)
METHOD—Gage R&R Study (Crossed): X–Bar & R Method
EXAMPLE: (Cont…)
Session window output
X–Bar and R method with GAGEAIAG data
%Contribution
Source VarComp (of VarComp)
Total Gage R&R 0.09357 7.13
Repeatability 0.04073 3.10
Reproducibility 0.05284 4.03
Part-To-Part 1.21909 92.87
Total Variation 1.31266 100.00
Process tolerance = 8
Study Var %Study Var %Tolerance
Source StdDev (SD) (6 * SD) (%SV) (SV/Toler)
Total Gage R&R 0.30589 1.83536 26.70 22.94
Repeatability 0.20181 1.21087 17.61 15.14
Reproducibility 0.22988 1.37925 20.06 17.24
Part-To-Part 1.10412 6.62474 96.37 82.81
Total Variation 1.14571 6.87428 100.00 85.93
Number of Distinct Categories = 5
INTERPRETATION:
Look at the %Contribution column in the Gage R%R Table.
The measurement system variation (Total Gage R&R) is
slightly smaller than what was found for the same data with
the ANOVA method.
The % Study Var column shows that the Total Gage R&R
accounts for 26.70% of the study variation; again slightly
smaller than what was found using the ANOVA method. In
some cases, there is a greater difference in the two
methods because the ANOVA method considers significant
Operator by Part interactions whereas the X–Bar and R
method does not.
Between 1% and 9% the
measurement system is
acceptable depending on the
application, the cost of the
measuring device, cost of
repair, or other factors. (AIAG)
Between 10% and 30% the
measurement system is
acceptable depending on the
application, the cost of the
measuring device , cost of repair,
or other factors
number of distinct categories is 5 represents an adequate
measuring system
24. GAGE R&R STUDY (CROSSED) USING:
i. ANOVA METHOD
ii. X–BAR & R METHOD
Three parts were selected that represent the
expected range of the process variation. Three
operators measured the three parts, three
times per part, in a random order.
Open the file GAGE2.MTW
EXERCISE
25. Gage R&R Study (Nested)
METHOD—Gage R&R Study (NESTED): X–Bar & R Method
EXAMPLE: Three operators each measured five different parts twice, for a total of 30
measurements. Each part is unique to operator; no two operators measured the same part. You
decide to conduct a gage R&R study (nested) to determine how much of your observed process
variation is due to measurement system variation .
Open the worksheet GAGENEST.MTW
Choose Stat > Quality Tools > Gage Study > Gage R&R Study (Nested).
Look at the Components of Variation Graph - located in
upper left corner. Most of the variation is due to
measurement system error (Gage R&R), while a low
percentage of variation is due to differences between parts.
Look at the X-Bar Chart - located in the lower left corner.
Most of the points in the X-Bar chart are inside the control
limits when the variation is mostly due to measurement
system error.
26. Gage R&R Study (Nested)
METHOD—Gage R&R Study (Nested):
EXAMPLE: (Cont…)
Gage R&R (Nested) for Response
Source DF SS MS F P
Operator 2 0.0142 0.00708 0.00385 0.996
Part (Operator) 2 22.0552 1.83794 1.42549 0.255
Repeatability 15 19.3400 1.28933
Total 29 41.4094
Gage R&R
%Contribution
Source VarComp (of VarComp)
Total Gage R&R 1.28933 82.46
Repeatability 1.28933 82.46
Reproducibility 0.00000 0.00
Part-To-Part 0.27430 17.54
Total Variation 1.56364 100.00
Process tolerance = 10
Study Var %Study Var %Tolerance
Source StdDev (SD) (6 * SD) (%SV) (SV/Toler)
Total Gage R&R 1.13549 6.81293 90.81 68.13
Repeatability 1.13549 6.81293 90.81 68.13
Reproducibility 0.00000 0.00000 0.00 0.00
Part-To-Part 0.52374 3.14243 41.88 31.42
Total Variation 1.25045 7.50273 100.00 75.03
Number of Distinct Categories = 1
INTERPRETING THE RESULTS:
Look at the %Contribution columns for Total
Gage R&R and Part-to-Part. The percent
contribution for differences between parts
(Part-To-Part = 17.54) is much smaller than the
percentage contribution for measurement
system variation (Total Gage R&R = 82.46).
The %Study Var column indicates that the Total
Gage R&R accounts for 90.81% of the study
variation. So, most of the variation is due to
measurement system error; very little is due to
differences between part.
A 1 in number of distinct categories tells you
that the measurement system is not able to
distinguish between parts.