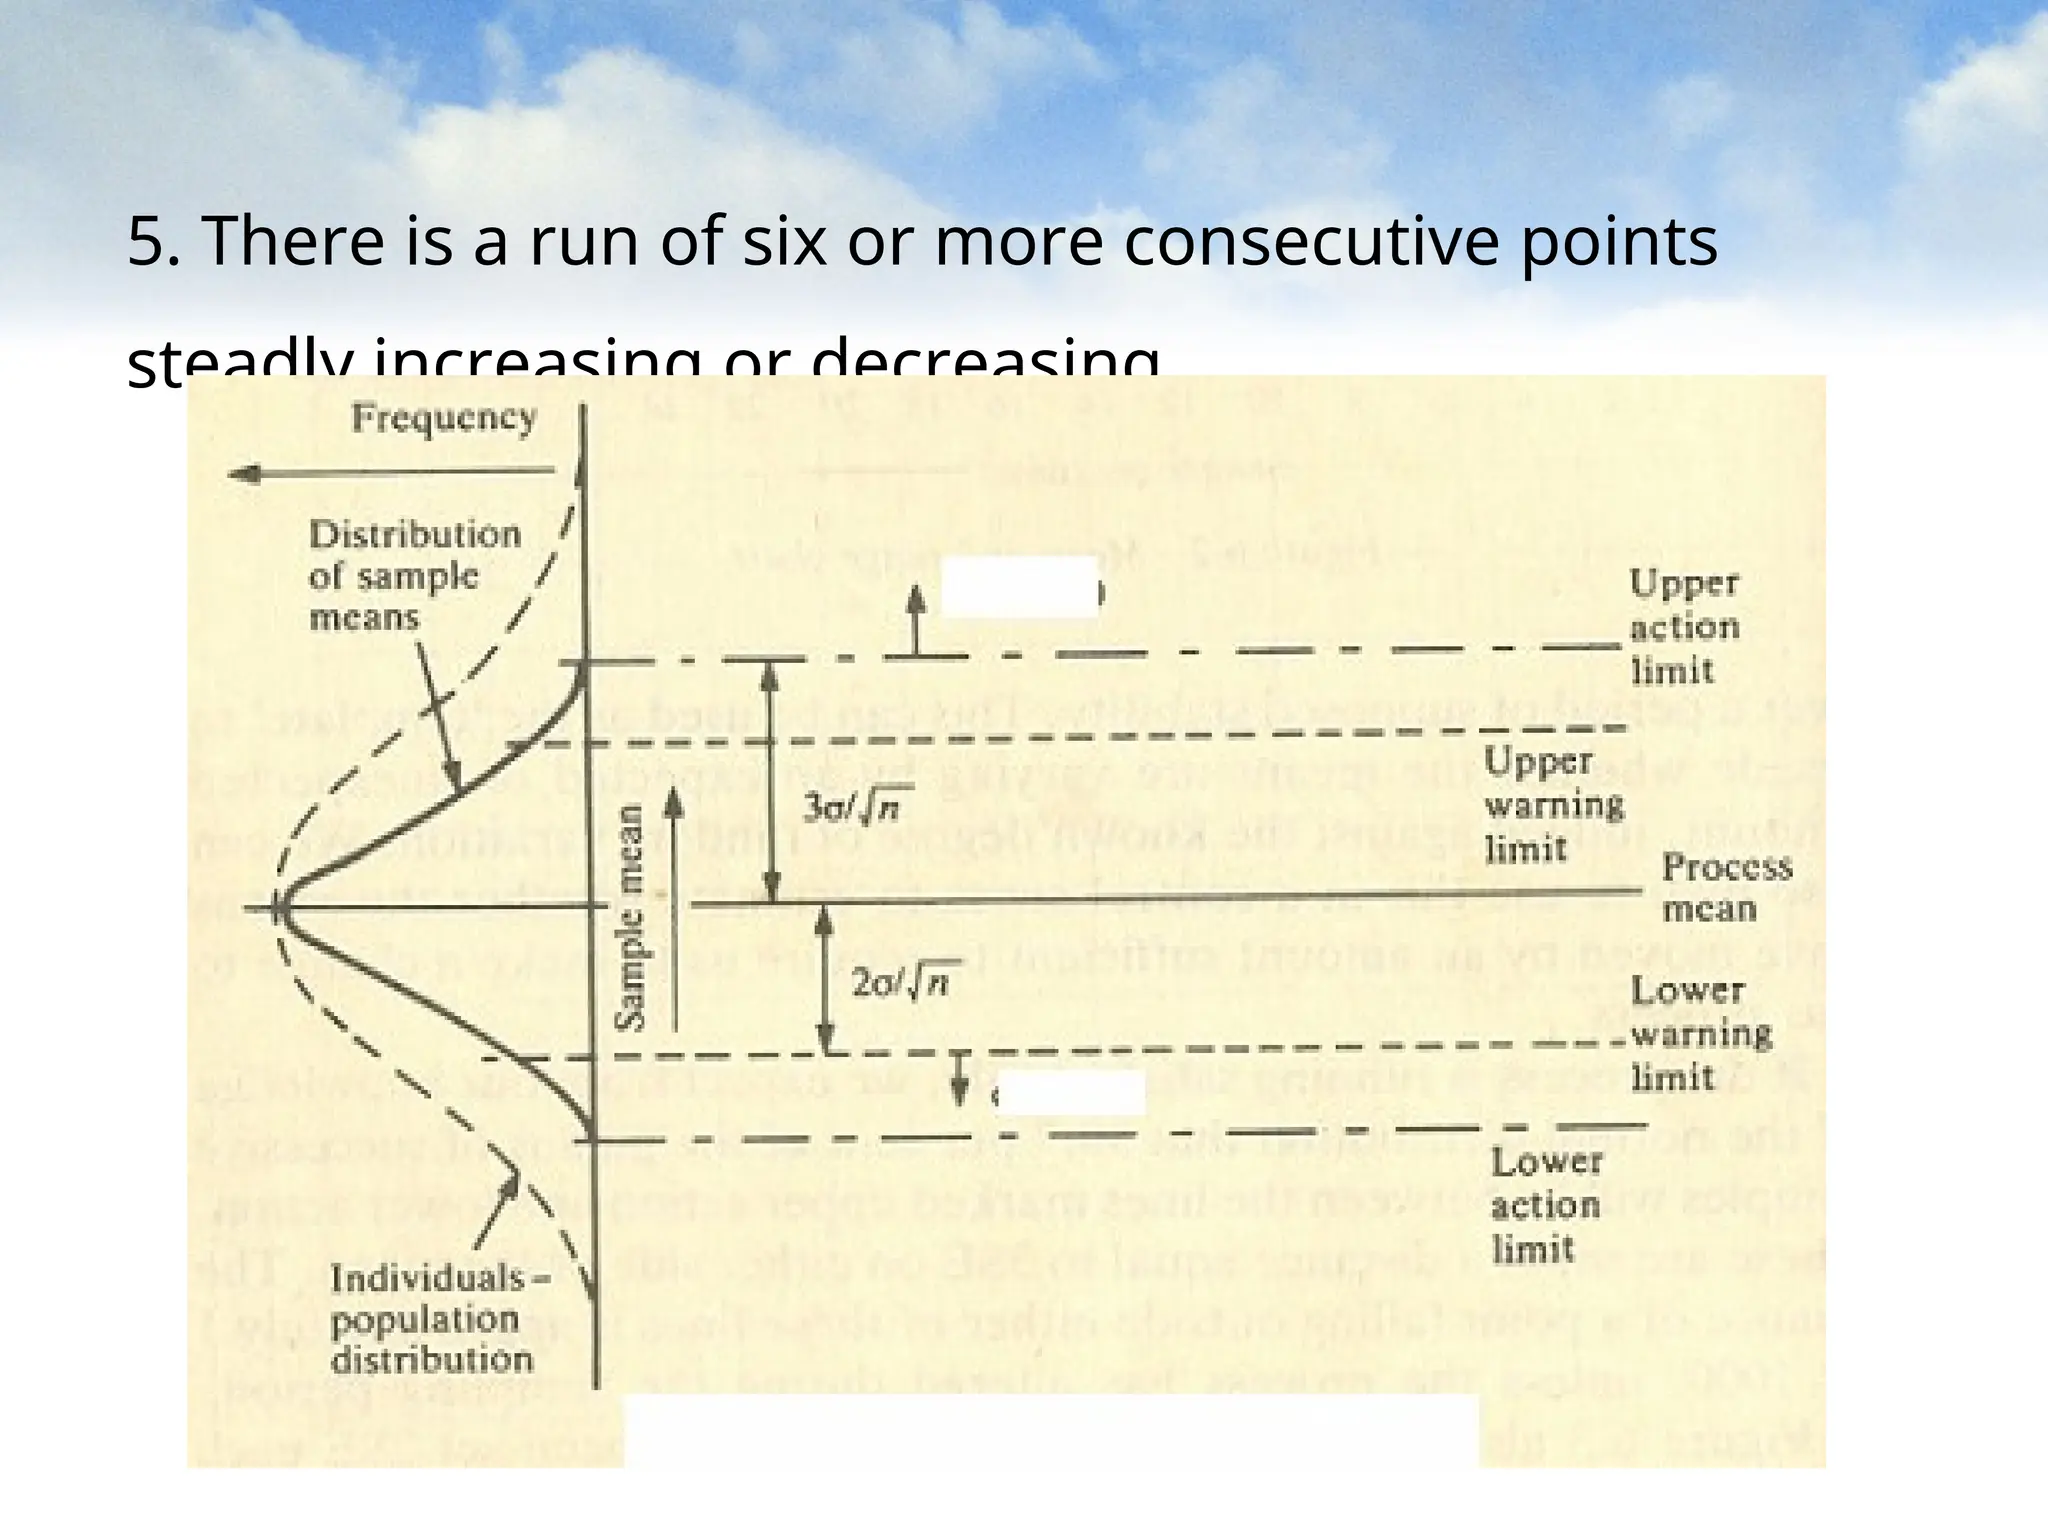
Chapter four
Statistical Quality Control (SQC)
What Is Statistical Quality Control?
 Statistical quality control (SQC) is the term used to describe
the set of statistical tools used by quality professionals.
 The need of statistical quality control emerged due to the
following short comings of inspection:-
• There is no way to know what happened between
inspector visits
• It can allow nonconforming parts to be shipped
Cont.d
• When nonconforming parts are discovered, it causes
unplanned production delays.
• costs of scrap and rework for the manufacturer are very high.
• The system breeds mistrust between inspector and machine
operator.
• With Statistical Process Control, however, companies can
provide better products for their customers while at the same
time reducing the overall cost of quality by identifying quality
problems during the process
Cont.d
• Any process stream is made up of raw materials,
people, methods, equipment, and the environment
surrounding the process.
• All or any one of the elements of a process stream
may contain variation that could affect the output.
• To maintain the variation within a predetermined
limit is the objective of SPC.
Cont.d
 Variations ca be either of the two:
1. Common/random cause variation--a source of chance
variation that is always present; part of the natural
variation inherent in the process itself
• It can’t be eliminted or if it can be eliminated – needs
huge expenditure
• Therfore, quality control should identify the range of
natural random variation in a process
Cont.d
• Monitor the production process to make sure that the
variation is within the natural range
• If, otherwise, the process goes out of this range, leads to
an indication that there is a problem with the process as
the variation is greater than the natural one.
2. Assignable/special causes of variation
• causes that are not inherent to the process, i.e they are not
part of the process as designed, does not affect all items
Cont.d
- causes of variation can be precisely identified and
eliminated
- we have a control up on them
- It includes operator error, use of wrong material,
wong tools, machine in need of maintenance,
poor organizational policy etc
Descriptive Statistics
• Descriptive statistics can be helpful in describing certain
characteristics of a product and a process.
• The most important descriptive statistics are measures of
central tendency such as the mean, measures of variability
such as the standard deviation and range, and measures of
the distribution of data
 Measures the central tendency of a set of data
• Mean is computed by summing all the observations and
dividing it to the total number of observations
Cont.d
• Median - is the middle value in a set of data arranged
from the smallest to the largest.
• Mode is the most frequently occurring value in a data set
 Measures of dispersion
• Range – is the difference between the largest and
smallest observations in a set of data.
• Standard deviation - measures the amount of data
dispersion around the mean.
Cont.d
• Small values of the range and standard deviation mean
that the observations are closely clustered around the
mean.
• Large values of the range and standard deviation mean
that the observations are spread out around the mean
 Distribution of Data
• the shape of the distribution of the observed data is
another measure of quality characteristics.
Cont.d
• When a distribution is symmetric, there are the same
number of observations below and above the mean.
• commonly found when only normal variation is
present in the data.
• When a disproportionate number of observations
are either above or below the mean, the data has a
skewed distribution.
Statistical Process Control (SPC)
• SPC is an application of statistical tools that create a process
capable of meeting or exceeding customer expectations
• extends the use of descriptive statistics to monitor the
quality of the product and process
• Using SPC, the amount of variation that is common or
normal is determined
• the production process is then monitored to make sure
production stays within this normal range.
Cont.d
• That is, we want to make sure the process is in a state
of control.
• The most commonly used tool for monitoring the
production process is a control chart.
• Control chart is a graphical tool for monitoring the
activity on an ongoing process
• shows whether a sample of data falls within the
common or normal range of variation.
Cont.d
 In a control chart;
– The Vertical axis is quality line axis that is used for value of
the quality characteristics
– The Horizontal axis represents sample (sub group)
 Control chart has three lines:-
• The central line: average value where the process is centered
• Two limits ( upper and lower control limit) are used to make
decisions - separate common from assignable causes of
variation
Cont.d
• If the points plot within the control limit and do not exhibit
any identifiable pattern, then the process is in state of
statistical control
Y
X
Upper limit
Lower limit
Average
Cont.d
• If a point plots out side the control limit or if
nonrandom pattern exists, the process is out of
statistical control
• The upper and lower control limits on a control chart
are usually set at 3 standard deviations from the mean,
• It can also be 2 or 1 standard deviations from the mean
Rules for identifying an out of
control process
A process is assumed to be out of control if
1. Any point of the sample falls out of the 3σ control limits
2. Two out of three consecutive point fall out of the 2σ
(warning limits) on the same side of the center line
3. Four out of five consecutive point fall outside the 1σ limits
on the same side of the center line.
4. Nine or more consecutive point fall to one side of the
center line
5. There is a run of six or more consecutive points
steadly increasing or decreasing
Cont.d
Upper action line.................. mean +3σ/ n
√
Upper warning line ............... mean+ 2σ/ n
√
Process mean (center line)......mean
Lower warning line ............... Mean-2σ/ n
√
Lower action line.................. mean -3σ/ n
√
Cont.d
Benefites of control charting:-
• Gives direction when to take corrective action
• Type of remedial action necessary:- indication of
possible causes hence, indirectly indicate remedial
action
• Measure of process capability....a process under control
is a capable process (Process capability: ability to meet
customer requirement)
Cont.d
• Possible means of further quality improvement – as
it helps the operator diagonise raw materials,
methods, equipment, and the working condition
• When to leave a process alone – when it is
continously in control
 Errors
• There are two types of errors from inferring control
charts
Cont.d
 Error Type I
Resulted from inferring (concluding) that the process is out
of control while it is in control
 Error Type II
Resulted from inferring that the process is in control while
it is out of control (the process variability has changed due
to presence of new/change in some processes)
Cont.d
 Preventing the errors
1. If a process is in control with +3σ, the chance of a sample
statistics falling outside the control is 0.3%
2. Type two error can be reduced by increasing the size of
the sample - this makes the control limits to be closer to
each other
an action taken to avoid error type II maximizes error type
I
Judgemental dicision of managers required for trade-off
Cont.d
m +s +2s +3s
-s
-2s
-3s
63,3%
95,5%
99,7%
Variable or attribute?
• Variable data - Characteristics that can be measured
and expressed in values from a continuous scale.
This type of data must be collected through a gauge
or test device. Eg. Fabric srength
• Attribute data - Characteristics that can be defined as
either pass/fail, yes/no, conforming/nonconforming
(discrete value that can be counted based on an
acceptance criteria).
Cont.d
 pros and cons of attribute control chart
Pros
Preferable for some quality characterstics (eg Taste,
color)
Applicable when time and financial resources are
limited
Cons
 it doesn’t state to which specifications are met or
not
Cont.d
 Guidelines for using Control Charts:-
• Management training - Management must understand the
value of SPC and the basics of application
• Employees training - Employees need to be trained in basic
SPC. They need to know how to determine when a process is
out of control.
• Understand the process - Flow chart the process to
understand how and where part characteristics are affected
during the process stream.
Cont.d
- Determine all contributing elements from the process
stream: material, methods, people, equipment, and
environment.
• Choose the characteristics for charting--Base your
decisions on need for improvement. Possible facts in a
plant
 There may be more than one product line and product
type in the company
Cont.d
 There are different quality characterstics to be
controlled in one product
 It should be understood that an operator can’t take care
of 10 or more different control charts at the same time
Hence, the number of control charts in a process should
be manageable by the operator
 Pareto chart will help to determine the 20% affecting
factors and the major quality parameters
Cont.d
• Choose your method of measurement--Determine the test
and measuring equipment
• Remove sources of variation--When the process is studied,
find ways to remove as many sources of variation as
possible
Assignment – II
• Definitions of ISO 9000 quality management system
• Structure and content of ISO 9001: 2000
• Deadline of submission – Wednesday dec.21, 2011
Thank you!

QMC chapter four 1.ppt statical quality control

  • 1.
  • 2.
    What Is StatisticalQuality Control?  Statistical quality control (SQC) is the term used to describe the set of statistical tools used by quality professionals.  The need of statistical quality control emerged due to the following short comings of inspection:- • There is no way to know what happened between inspector visits • It can allow nonconforming parts to be shipped
  • 3.
    Cont.d • When nonconformingparts are discovered, it causes unplanned production delays. • costs of scrap and rework for the manufacturer are very high. • The system breeds mistrust between inspector and machine operator. • With Statistical Process Control, however, companies can provide better products for their customers while at the same time reducing the overall cost of quality by identifying quality problems during the process
  • 4.
    Cont.d • Any processstream is made up of raw materials, people, methods, equipment, and the environment surrounding the process. • All or any one of the elements of a process stream may contain variation that could affect the output. • To maintain the variation within a predetermined limit is the objective of SPC.
  • 5.
    Cont.d  Variations cabe either of the two: 1. Common/random cause variation--a source of chance variation that is always present; part of the natural variation inherent in the process itself • It can’t be eliminted or if it can be eliminated – needs huge expenditure • Therfore, quality control should identify the range of natural random variation in a process
  • 6.
    Cont.d • Monitor theproduction process to make sure that the variation is within the natural range • If, otherwise, the process goes out of this range, leads to an indication that there is a problem with the process as the variation is greater than the natural one. 2. Assignable/special causes of variation • causes that are not inherent to the process, i.e they are not part of the process as designed, does not affect all items
  • 7.
    Cont.d - causes ofvariation can be precisely identified and eliminated - we have a control up on them - It includes operator error, use of wrong material, wong tools, machine in need of maintenance, poor organizational policy etc
  • 8.
    Descriptive Statistics • Descriptivestatistics can be helpful in describing certain characteristics of a product and a process. • The most important descriptive statistics are measures of central tendency such as the mean, measures of variability such as the standard deviation and range, and measures of the distribution of data  Measures the central tendency of a set of data • Mean is computed by summing all the observations and dividing it to the total number of observations
  • 9.
    Cont.d • Median -is the middle value in a set of data arranged from the smallest to the largest. • Mode is the most frequently occurring value in a data set  Measures of dispersion • Range – is the difference between the largest and smallest observations in a set of data. • Standard deviation - measures the amount of data dispersion around the mean.
  • 10.
    Cont.d • Small valuesof the range and standard deviation mean that the observations are closely clustered around the mean. • Large values of the range and standard deviation mean that the observations are spread out around the mean  Distribution of Data • the shape of the distribution of the observed data is another measure of quality characteristics.
  • 11.
    Cont.d • When adistribution is symmetric, there are the same number of observations below and above the mean. • commonly found when only normal variation is present in the data. • When a disproportionate number of observations are either above or below the mean, the data has a skewed distribution.
  • 12.
    Statistical Process Control(SPC) • SPC is an application of statistical tools that create a process capable of meeting or exceeding customer expectations • extends the use of descriptive statistics to monitor the quality of the product and process • Using SPC, the amount of variation that is common or normal is determined • the production process is then monitored to make sure production stays within this normal range.
  • 13.
    Cont.d • That is,we want to make sure the process is in a state of control. • The most commonly used tool for monitoring the production process is a control chart. • Control chart is a graphical tool for monitoring the activity on an ongoing process • shows whether a sample of data falls within the common or normal range of variation.
  • 14.
    Cont.d  In acontrol chart; – The Vertical axis is quality line axis that is used for value of the quality characteristics – The Horizontal axis represents sample (sub group)  Control chart has three lines:- • The central line: average value where the process is centered • Two limits ( upper and lower control limit) are used to make decisions - separate common from assignable causes of variation
  • 15.
    Cont.d • If thepoints plot within the control limit and do not exhibit any identifiable pattern, then the process is in state of statistical control Y X Upper limit Lower limit Average
  • 16.
    Cont.d • If apoint plots out side the control limit or if nonrandom pattern exists, the process is out of statistical control • The upper and lower control limits on a control chart are usually set at 3 standard deviations from the mean, • It can also be 2 or 1 standard deviations from the mean
  • 17.
    Rules for identifyingan out of control process A process is assumed to be out of control if 1. Any point of the sample falls out of the 3σ control limits 2. Two out of three consecutive point fall out of the 2σ (warning limits) on the same side of the center line 3. Four out of five consecutive point fall outside the 1σ limits on the same side of the center line. 4. Nine or more consecutive point fall to one side of the center line
  • 18.
    5. There isa run of six or more consecutive points steadly increasing or decreasing
  • 19.
    Cont.d Upper action line..................mean +3σ/ n √ Upper warning line ............... mean+ 2σ/ n √ Process mean (center line)......mean Lower warning line ............... Mean-2σ/ n √ Lower action line.................. mean -3σ/ n √
  • 20.
    Cont.d Benefites of controlcharting:- • Gives direction when to take corrective action • Type of remedial action necessary:- indication of possible causes hence, indirectly indicate remedial action • Measure of process capability....a process under control is a capable process (Process capability: ability to meet customer requirement)
  • 21.
    Cont.d • Possible meansof further quality improvement – as it helps the operator diagonise raw materials, methods, equipment, and the working condition • When to leave a process alone – when it is continously in control  Errors • There are two types of errors from inferring control charts
  • 22.
    Cont.d  Error TypeI Resulted from inferring (concluding) that the process is out of control while it is in control  Error Type II Resulted from inferring that the process is in control while it is out of control (the process variability has changed due to presence of new/change in some processes)
  • 23.
    Cont.d  Preventing theerrors 1. If a process is in control with +3σ, the chance of a sample statistics falling outside the control is 0.3% 2. Type two error can be reduced by increasing the size of the sample - this makes the control limits to be closer to each other an action taken to avoid error type II maximizes error type I Judgemental dicision of managers required for trade-off
  • 24.
    Cont.d m +s +2s+3s -s -2s -3s 63,3% 95,5% 99,7%
  • 25.
    Variable or attribute? •Variable data - Characteristics that can be measured and expressed in values from a continuous scale. This type of data must be collected through a gauge or test device. Eg. Fabric srength • Attribute data - Characteristics that can be defined as either pass/fail, yes/no, conforming/nonconforming (discrete value that can be counted based on an acceptance criteria).
  • 26.
    Cont.d  pros andcons of attribute control chart Pros Preferable for some quality characterstics (eg Taste, color) Applicable when time and financial resources are limited Cons  it doesn’t state to which specifications are met or not
  • 27.
    Cont.d  Guidelines forusing Control Charts:- • Management training - Management must understand the value of SPC and the basics of application • Employees training - Employees need to be trained in basic SPC. They need to know how to determine when a process is out of control. • Understand the process - Flow chart the process to understand how and where part characteristics are affected during the process stream.
  • 28.
    Cont.d - Determine allcontributing elements from the process stream: material, methods, people, equipment, and environment. • Choose the characteristics for charting--Base your decisions on need for improvement. Possible facts in a plant  There may be more than one product line and product type in the company
  • 29.
    Cont.d  There aredifferent quality characterstics to be controlled in one product  It should be understood that an operator can’t take care of 10 or more different control charts at the same time Hence, the number of control charts in a process should be manageable by the operator  Pareto chart will help to determine the 20% affecting factors and the major quality parameters
  • 30.
    Cont.d • Choose yourmethod of measurement--Determine the test and measuring equipment • Remove sources of variation--When the process is studied, find ways to remove as many sources of variation as possible Assignment – II • Definitions of ISO 9000 quality management system • Structure and content of ISO 9001: 2000 • Deadline of submission – Wednesday dec.21, 2011
  • 31.