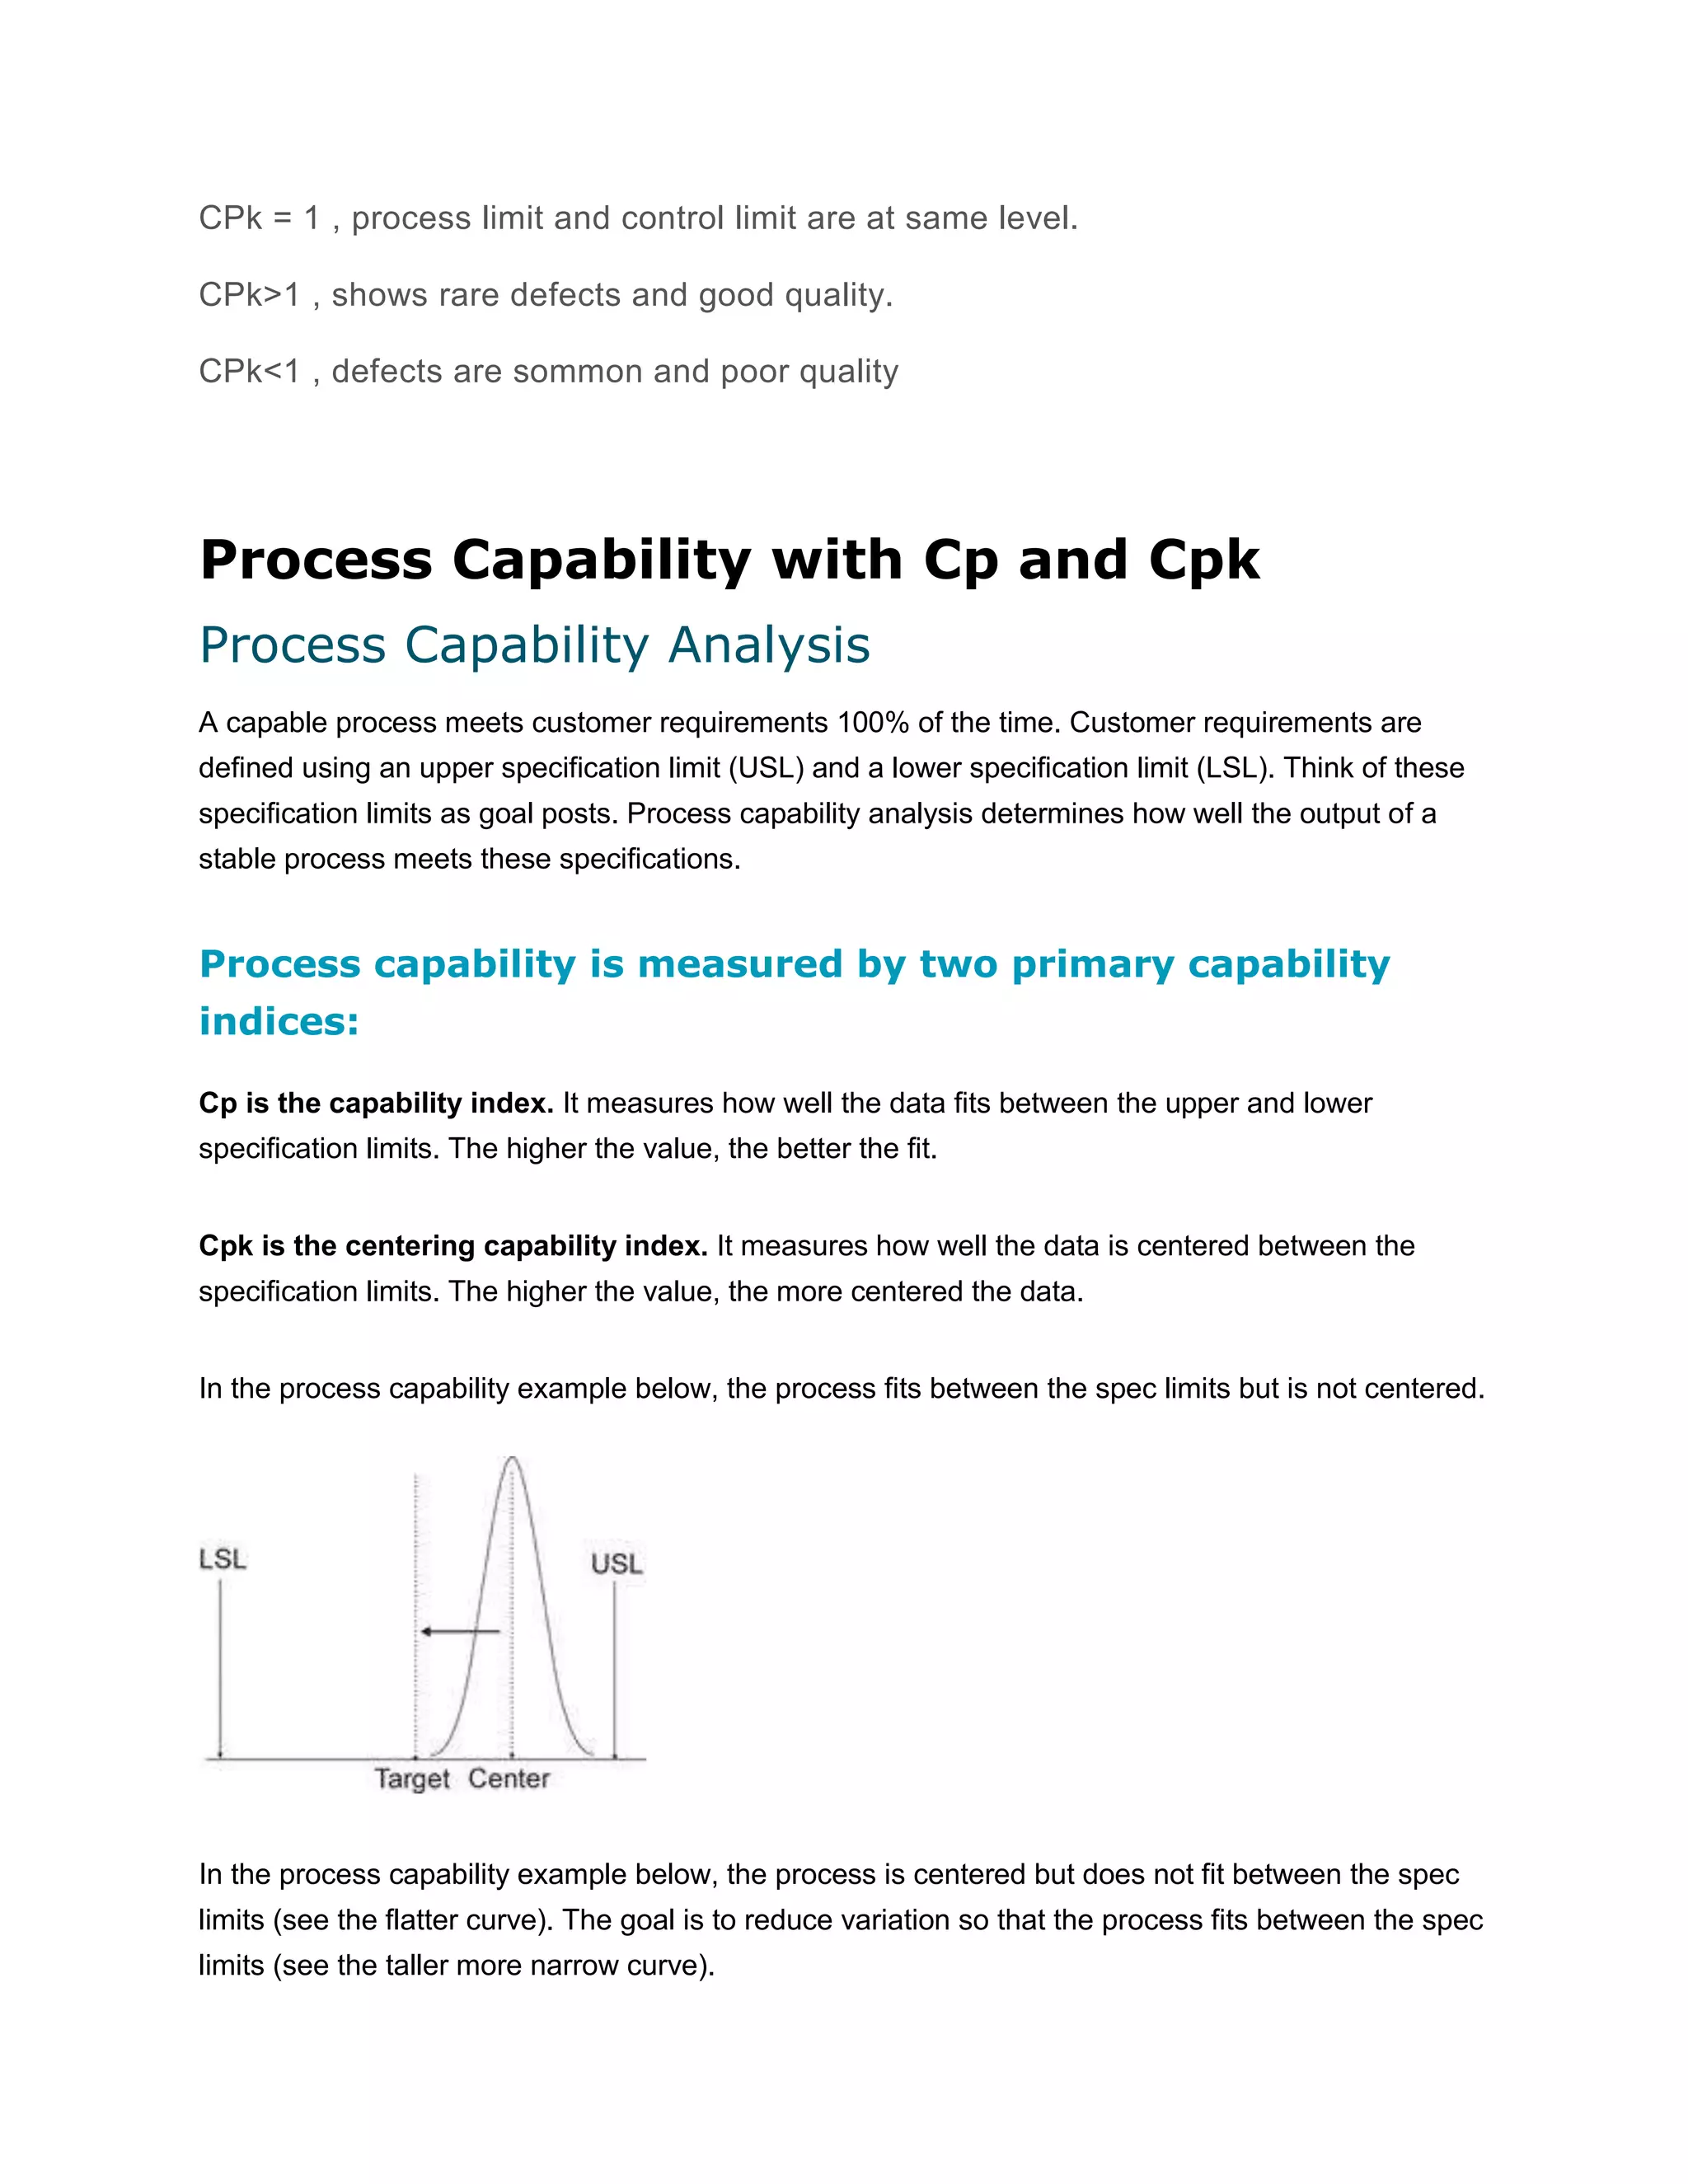
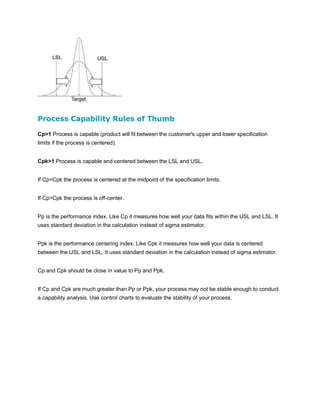
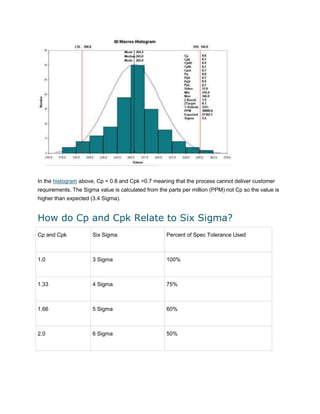
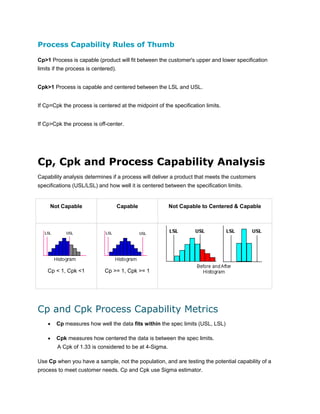
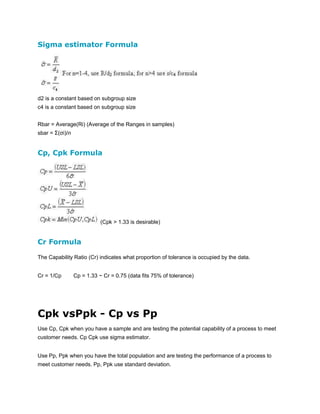
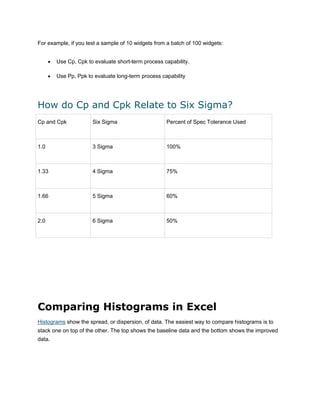
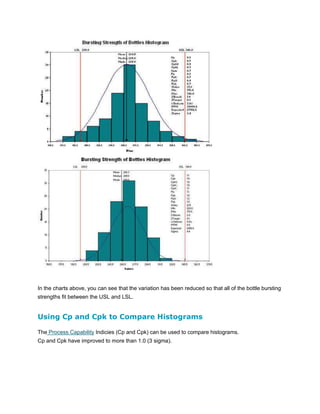
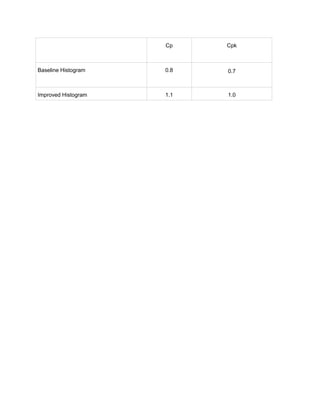
The document discusses process capability analysis using Cp and Cpk metrics. Cp measures how well a process fits within specification limits, while Cpk also considers centering. A Cpk over 1 indicates a capable and centered process. Values over 1.33 represent 4-sigma capability. Cp over 1 but Cpk below 1 means the process is capable but not centered. Histograms and Cp, Cpk values are used to compare baseline and improved processes.
Filing Your Delaware Franchise Tax A Detailed Guide
Summary research on c pk vs cp
1. CPk = 1 , process limit and control limit are at same level.
CPk>1 , shows rare defects and good quality.
CPk<1 , defects are sommon and poor quality
Process Capability with Cp and Cpk
Process Capability Analysis
A capable process meets customer requirements 100% of the time. Customer requirements are
defined using an upper specification limit (USL) and a lower specification limit (LSL). Think of these
specification limits as goal posts. Process capability analysis determines how well the output of a
stable process meets these specifications.
Process capability is measured by two primary capability
indices:
Cp is the capability index. It measures how well the data fits between the upper and lower
specification limits. The higher the value, the better the fit.
Cpk is the centering capability index. It measures how well the data is centered between the
specification limits. The higher the value, the more centered the data.
In the process capability example below, the process fits between the spec limits but is not centered.
In the process capability example below, the process is centered but does not fit between the spec
limits (see the flatter curve). The goal is to reduce variation so that the process fits between the spec
limits (see the taller more narrow curve).
2. Process Capability Rules of Thumb
Cp>1 Process is capable (product will fit between the customer's upper and lower specification
limits if the process is centered).
Cpk>1 Process is capable and centered between the LSL and USL.
If Cp=Cpk the process is centered at the midpoint of the specification limits.
If Cp>Cpk the process is off-center.
Pp is the performance index. Like Cp it measures how well your data fits within the USL and LSL. It
uses standard deviation in the calculation instead of sigma estimator.
Ppk is the performance centering index. Like Cpk it measures how well your data is centered
between the USL and LSL. It uses standard deviation in the calculation instead of sigma estimator.
Cp and Cpk should be close in value to Pp and Ppk.
If Cp and Cpk are much greater than Pp or Ppk, your process may not be stable enough to conduct
a capability analysis. Use control charts to evaluate the stability of your process.
3. In the histogram above, Cp = 0.8 and Cpk =0.7 meaning that the process cannot deliver customer
requirements. The Sigma value is calculated from the parts per million (PPM) not Cp so the value is
higher than expected (3.4 Sigma).
How do Cp and Cpk Relate to Six Sigma?
Cp and Cpk
Six Sigma
Percent of Spec Tolerance Used
1.0
3 Sigma
100%
1.33
4 Sigma
75%
1.66
5 Sigma
60%
2.0
6 Sigma
50%
4. Process Capability Rules of Thumb
Cp>1 Process is capable (product will fit between the customer's upper and lower specification
limits if the process is centered).
Cpk>1 Process is capable and centered between the LSL and USL.
If Cp=Cpk the process is centered at the midpoint of the specification limits.
If Cp>Cpk the process is off-center.
Cp, Cpk and Process Capability Analysis
Capability analysis determines if a process will deliver a product that meets the customers
specifications (USL/LSL) and how well it is centered between the specification limits.
Not Capable
Capable
Cp < 1, Cpk <1
Not Capable to Centered & Capable
Cp >= 1, Cpk >= 1
Cp and Cpk Process Capability Metrics
Cp measures how well the data fits within the spec limits (USL, LSL)
Cpk measures how centered the data is between the spec limits.
A Cpk of 1.33 is considered to be at 4-Sigma.
Use Cp when you have a sample, not the population, and are testing the potential capability of a
process to meet customer needs. Cp and Cpk use Sigma estimator.
5. Sigma estimator Formula
d2 is a constant based on subgroup size
c4 is a constant based on subgroup size
Rbar = Average(Ri) (Average of the Ranges in samples)
sbar = Σ(σi)/n
Cp, Cpk Formula
(Cpk > 1.33 is desirable)
Cr Formula
The Capability Ratio (Cr) indicates what proportion of tolerance is occupied by the data.
Cr = 1/Cp
Cp = 1.33 ~ Cr = 0.75 (data fits 75% of tolerance)
Cpk vsPpk - Cp vs Pp
Use Cp, Cpk when you have a sample and are testing the potential capability of a process to meet
customer needs. Cp Cpk use sigma estimator.
Use Pp, Ppk when you have the total population and are testing the performance of a process to
meet customer needs. Pp, Ppk use standard deviation.
6. For example, if you test a sample of 10 widgets from a batch of 100 widgets:
Use Cp, Cpk to evaluate short-term process capability.
Use Pp, Ppk to evaluate long-term process capability
How do Cp and Cpk Relate to Six Sigma?
Cp and Cpk
Six Sigma
Percent of Spec Tolerance Used
1.0
3 Sigma
100%
1.33
4 Sigma
75%
1.66
5 Sigma
60%
2.0
6 Sigma
50%
Comparing Histograms in Excel
Histograms show the spread, or dispersion, of data. The easiest way to compare histograms is to
stack one on top of the other. The top shows the baseline data and the bottom shows the improved
data.
7. In the charts above, you can see that the variation has been reduced so that all of the bottle bursting
strengths fit between the USL and LSL.
Using Cp and Cpk to Compare Histograms
The Process Capability Indicies (Cp and Cpk) can be used to compare histograms.
Cp and Cpk have improved to more than 1.0 (3 sigma).