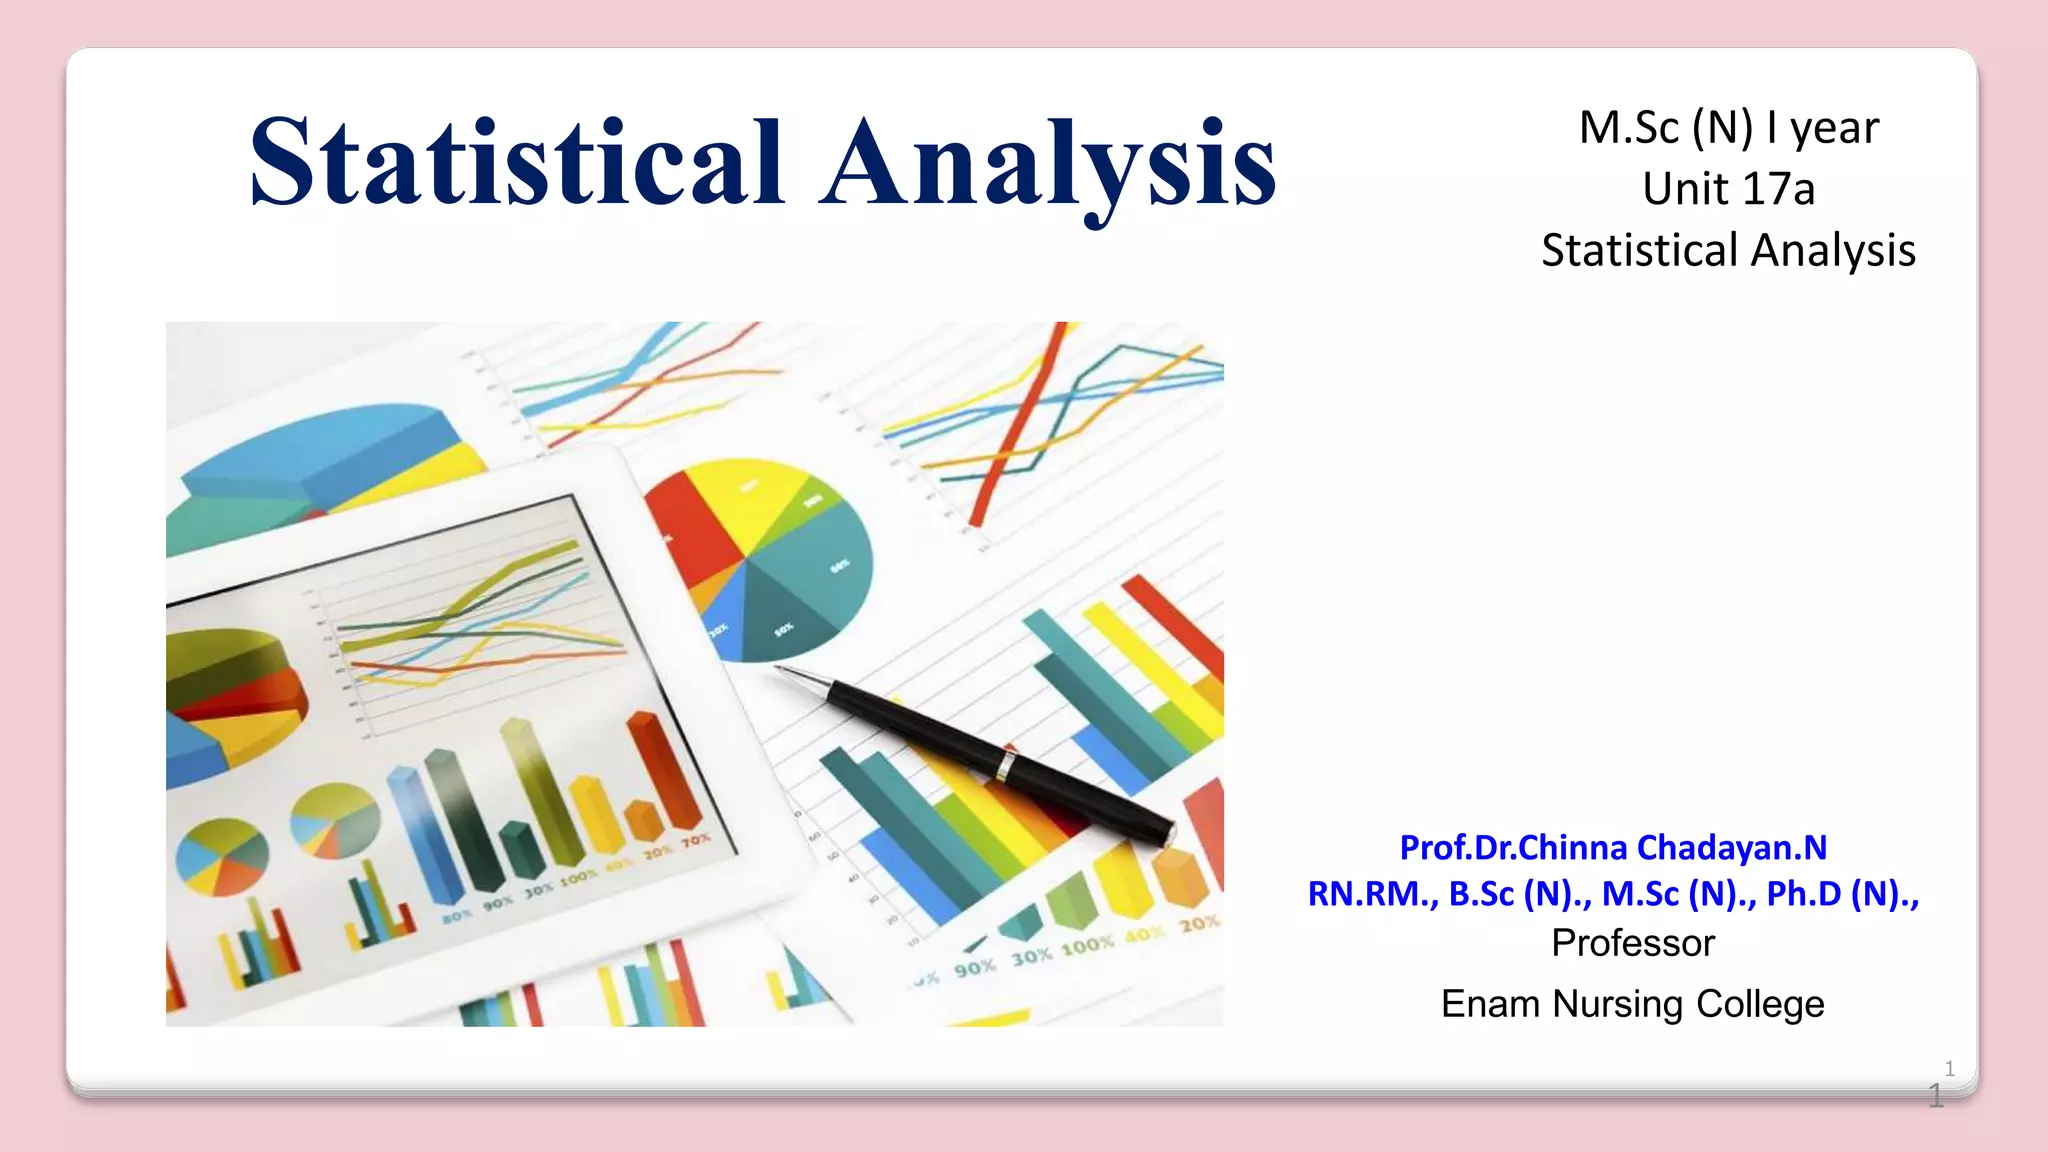
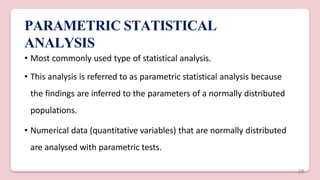
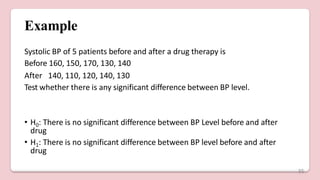
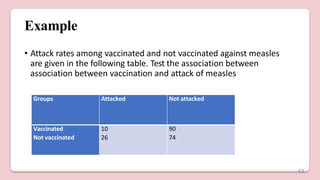
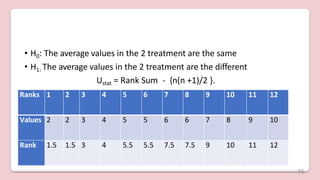
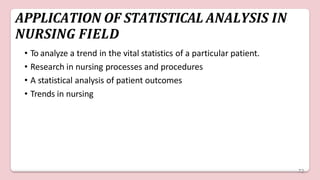
![MEDIAN
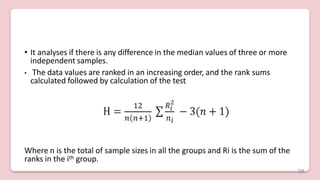
• When all the observations are arranged in ascending or descending
orders of magnitude, the middle one is the median.
• For raw data, If n is the total number of observations, the value of the
2
𝑛+1
[ ] th item will be called median .
th 𝑛
2
• if n is the even number, the mean of n/2 item and [ + 1] th item
will be median.
Example : Median of given data 10, 20, 30 is
20
10](https://image.slidesharecdn.com/encmsc17aunitstatisticalanalysis-230830065741-e543d58a/85/Statistical-analysis-pptx-10-320.jpg)
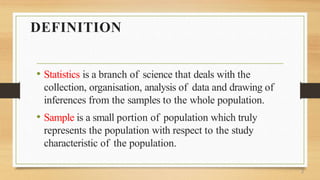
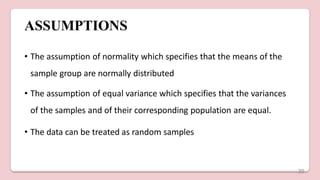
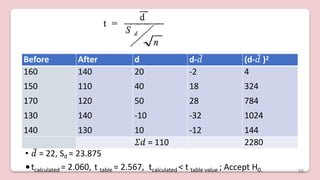
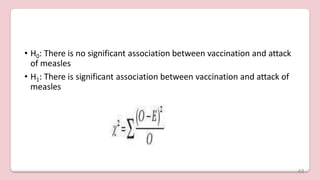
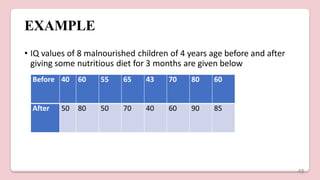
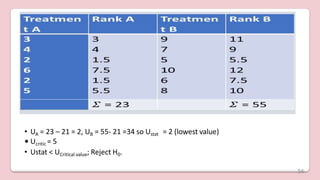
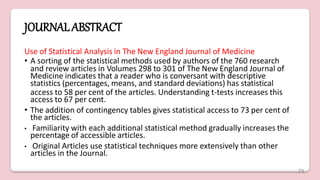
![Example
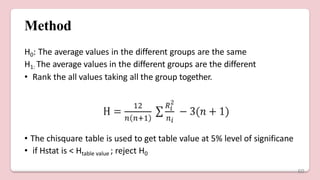
Interquartile range of following data 30, 20, 40, 60 , 50
4
• Q1 =[ 𝑛+1
]th item = 1.5th item = 20+ 0.5 (30-20) = 25
4
• Q3 = 3[ 𝑛+1
]th item = 50 +0.5x (60-50) = 55.
• IQR = 30
13](https://image.slidesharecdn.com/encmsc17aunitstatisticalanalysis-230830065741-e543d58a/85/Statistical-analysis-pptx-13-320.jpg)
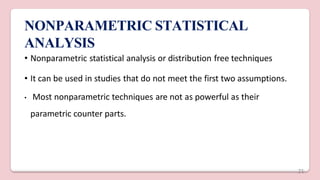
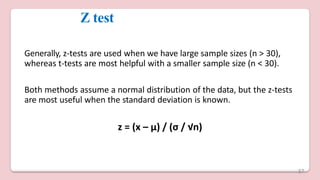
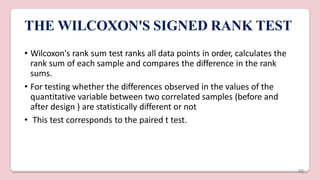
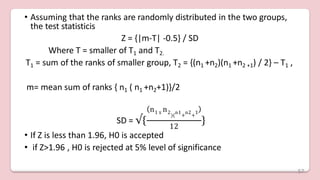
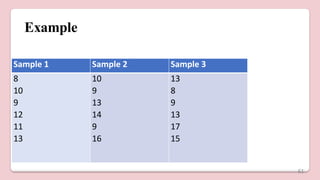
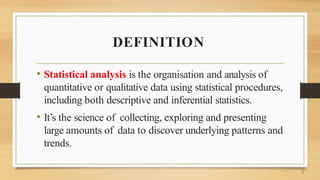
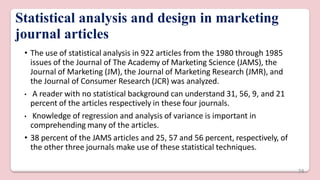
![• H = {12/18x19 [ (45.252 /6 ) + (61.52/6) + (65.52/6 )]} – 3x19
•Hcalculated = 56.99 , 𝑥2
table value = 5.99
•Hstat > 𝑥2
table value ; Reject H0
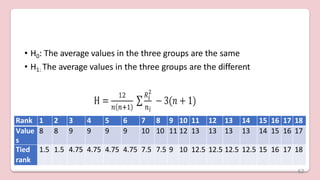
Sample 1 Rank 1 Sample 2 Rank 2 Sample 3 Rank 3
8 1.5 10 7.5 13 12.5
10 7.5 9 4.75 8 1.5
9 4.75 13 12.5 9 4.75
12 10 14 15 13 12.5
11 9 9 4.75 17 18
13 12.5 16 17 15 16
𝛴 = 45.25 𝛴 = 61.5 𝛴 = 65.25
63](https://image.slidesharecdn.com/encmsc17aunitstatisticalanalysis-230830065741-e543d58a/85/Statistical-analysis-pptx-63-320.jpg)


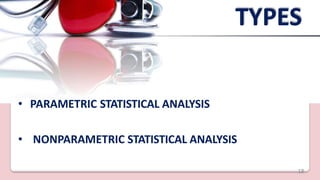
1. Statistical analysis involves collecting, organizing, analyzing data, and drawing inferences about populations based on samples. It includes both descriptive and inferential statistics. 2. The document defines key terms used in statistical analysis like population, sample, statistical analysis, and discusses various statistical measures like mean, median, mode, interquartile range, and standard deviation. 3. The purposes of statistical analysis are outlined as measuring relationships, making predictions, testing hypotheses, and summarizing results. Both parametric and non-parametric statistical analyses are discussed.