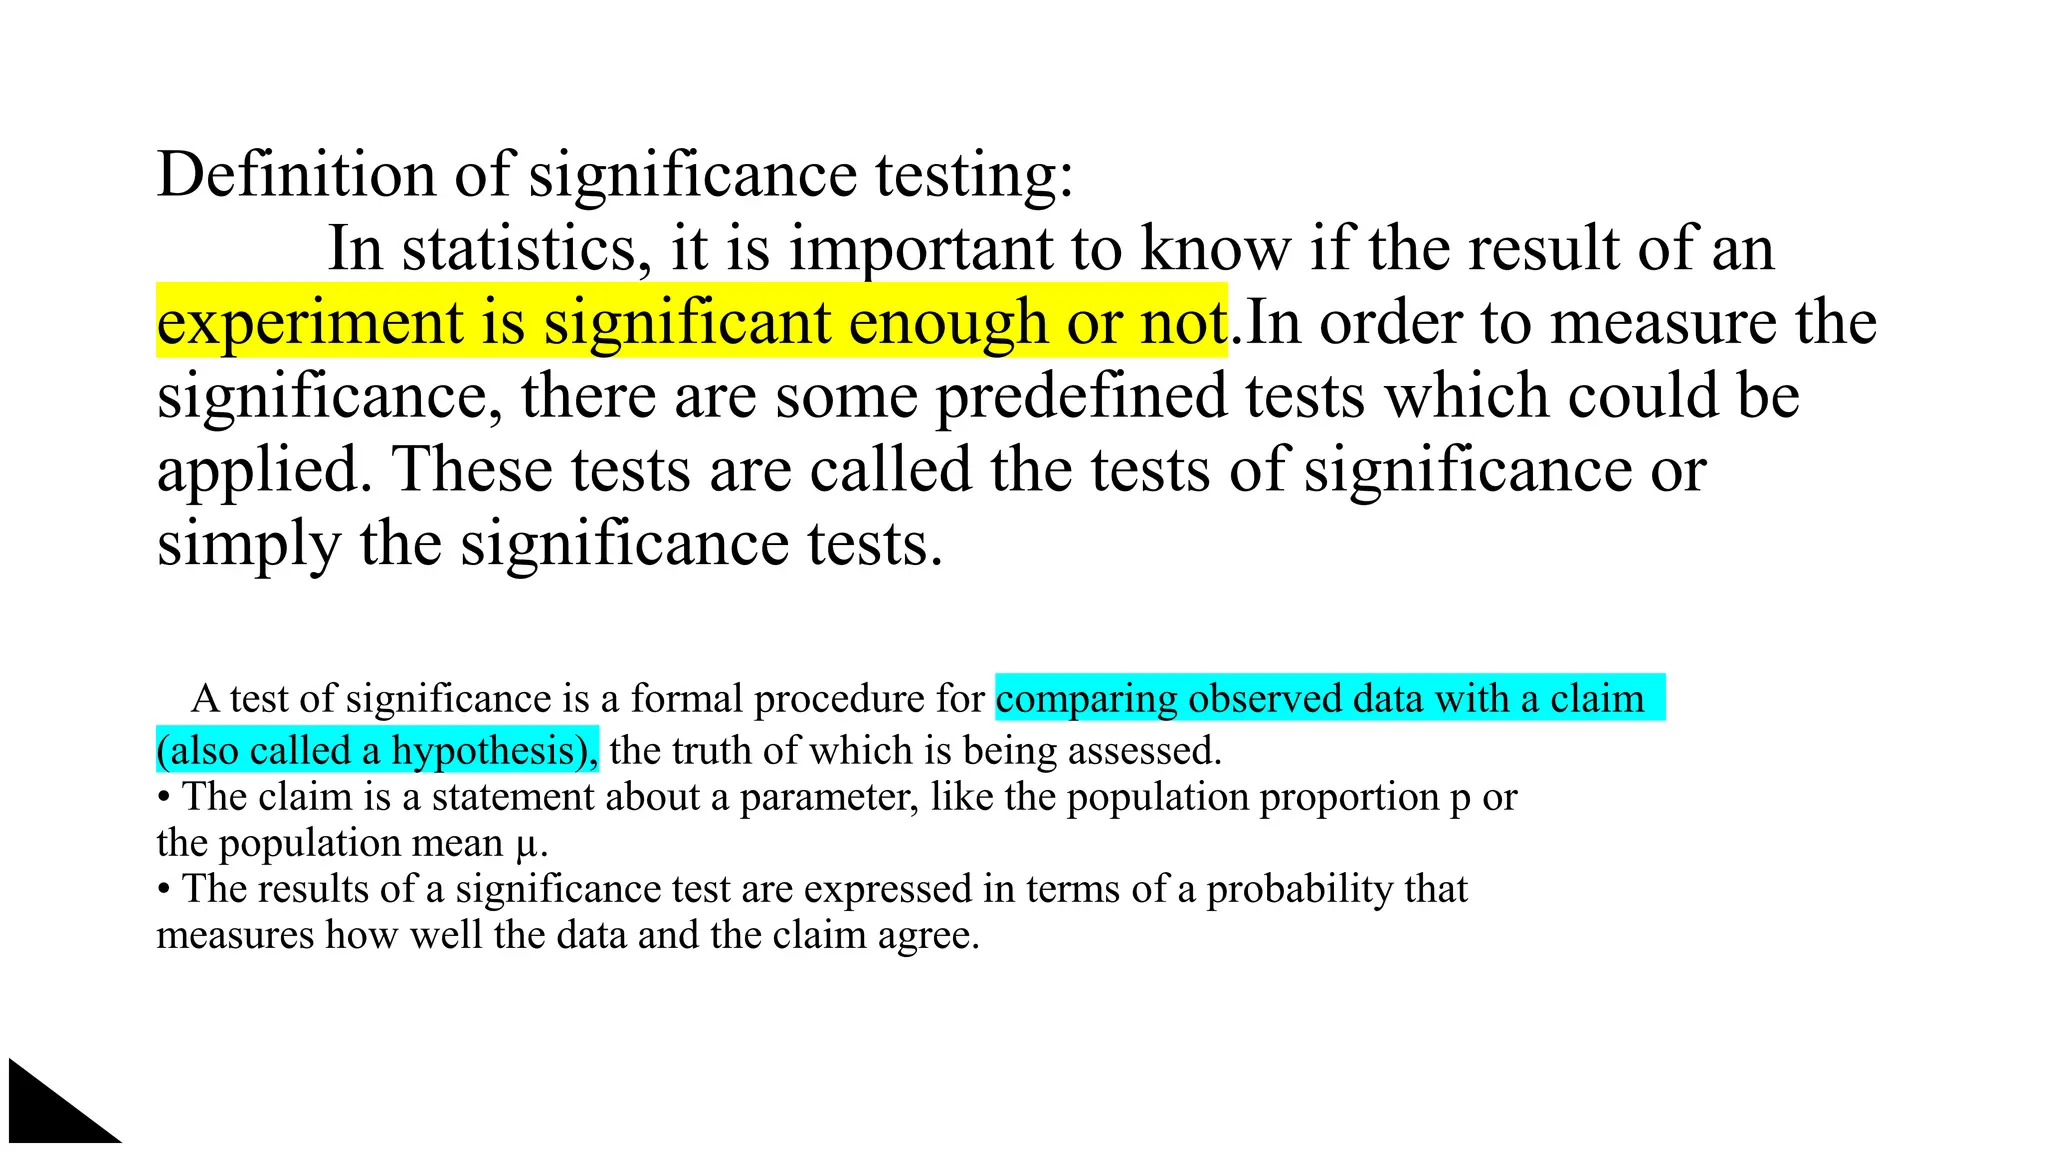
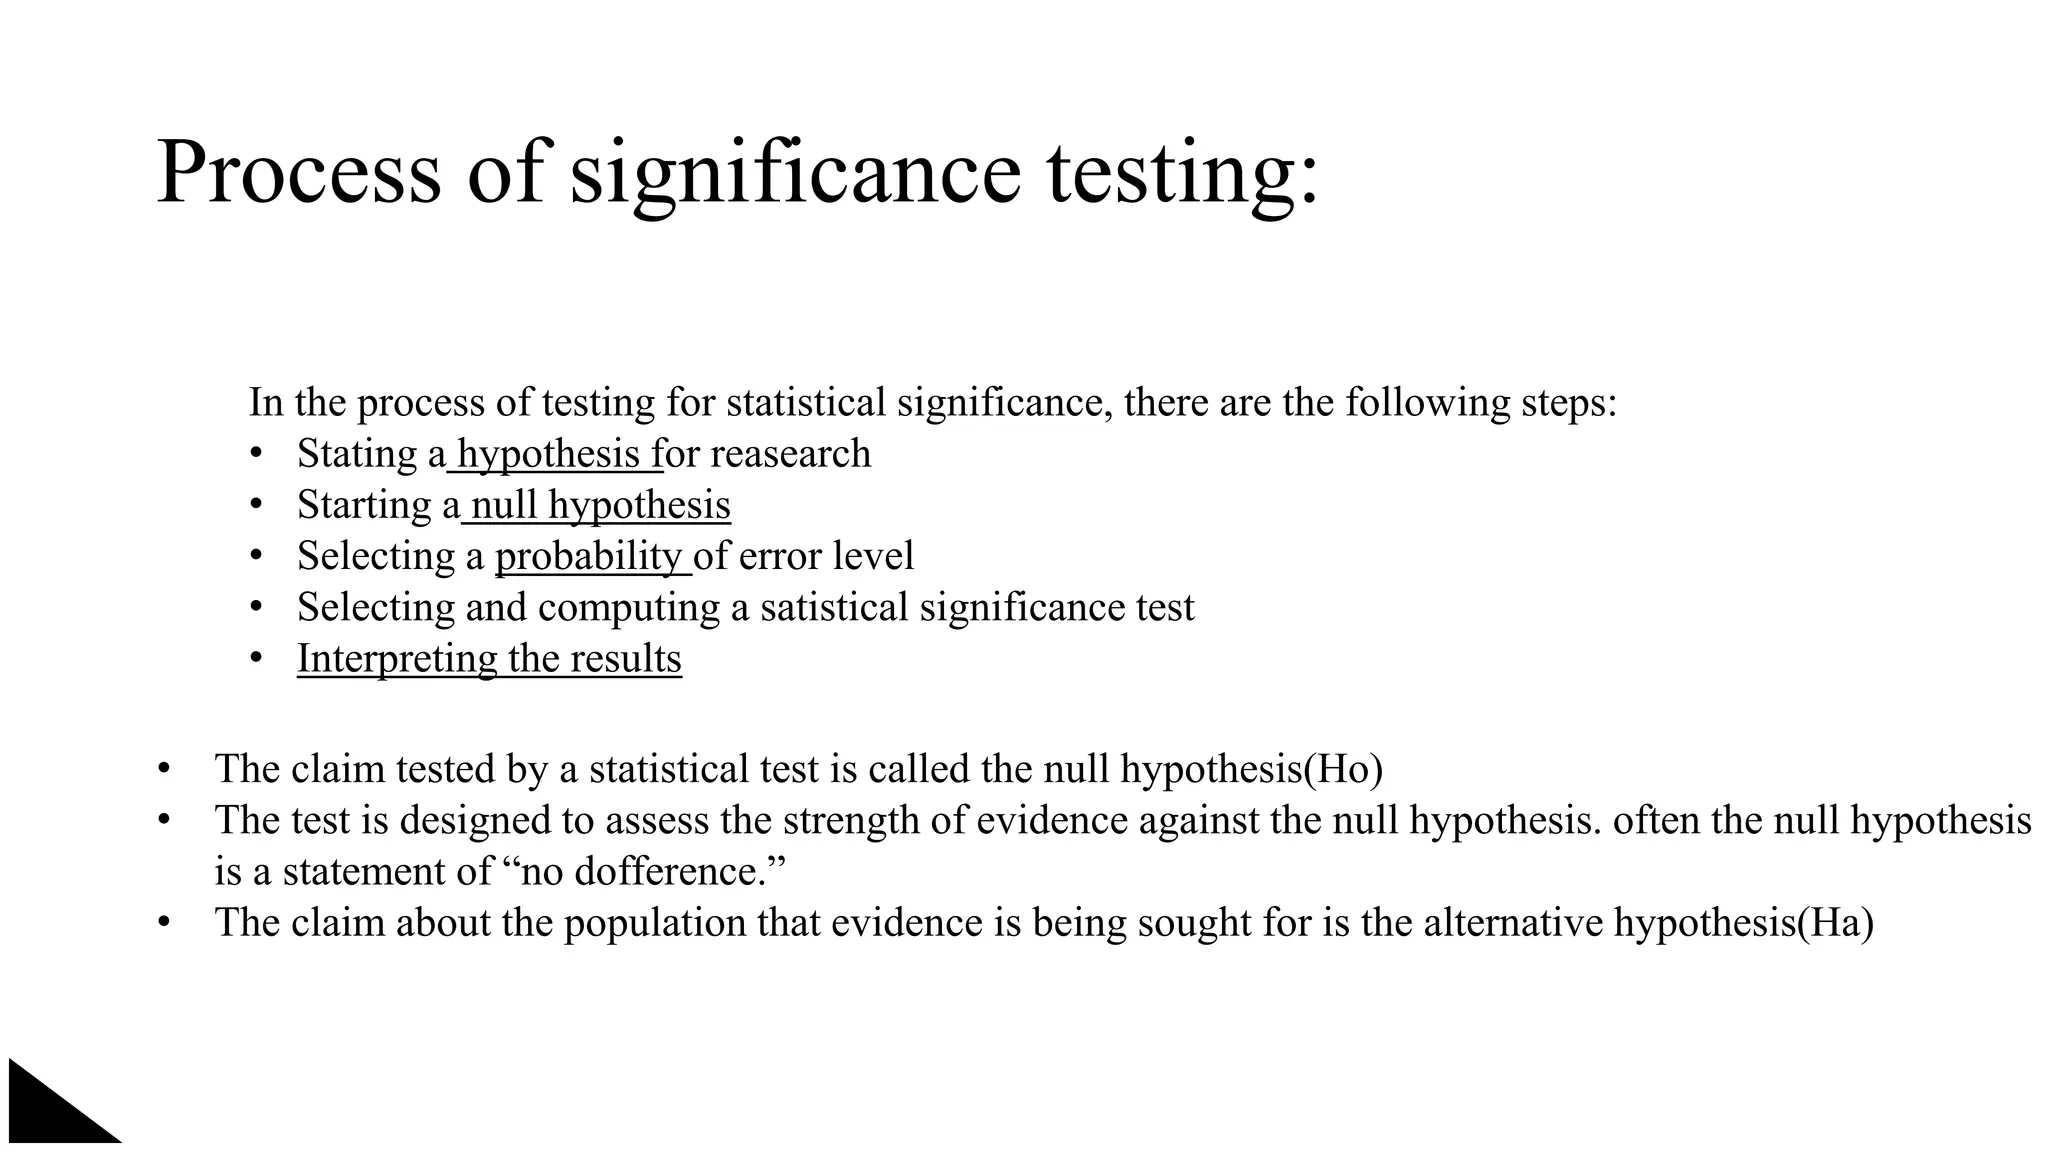
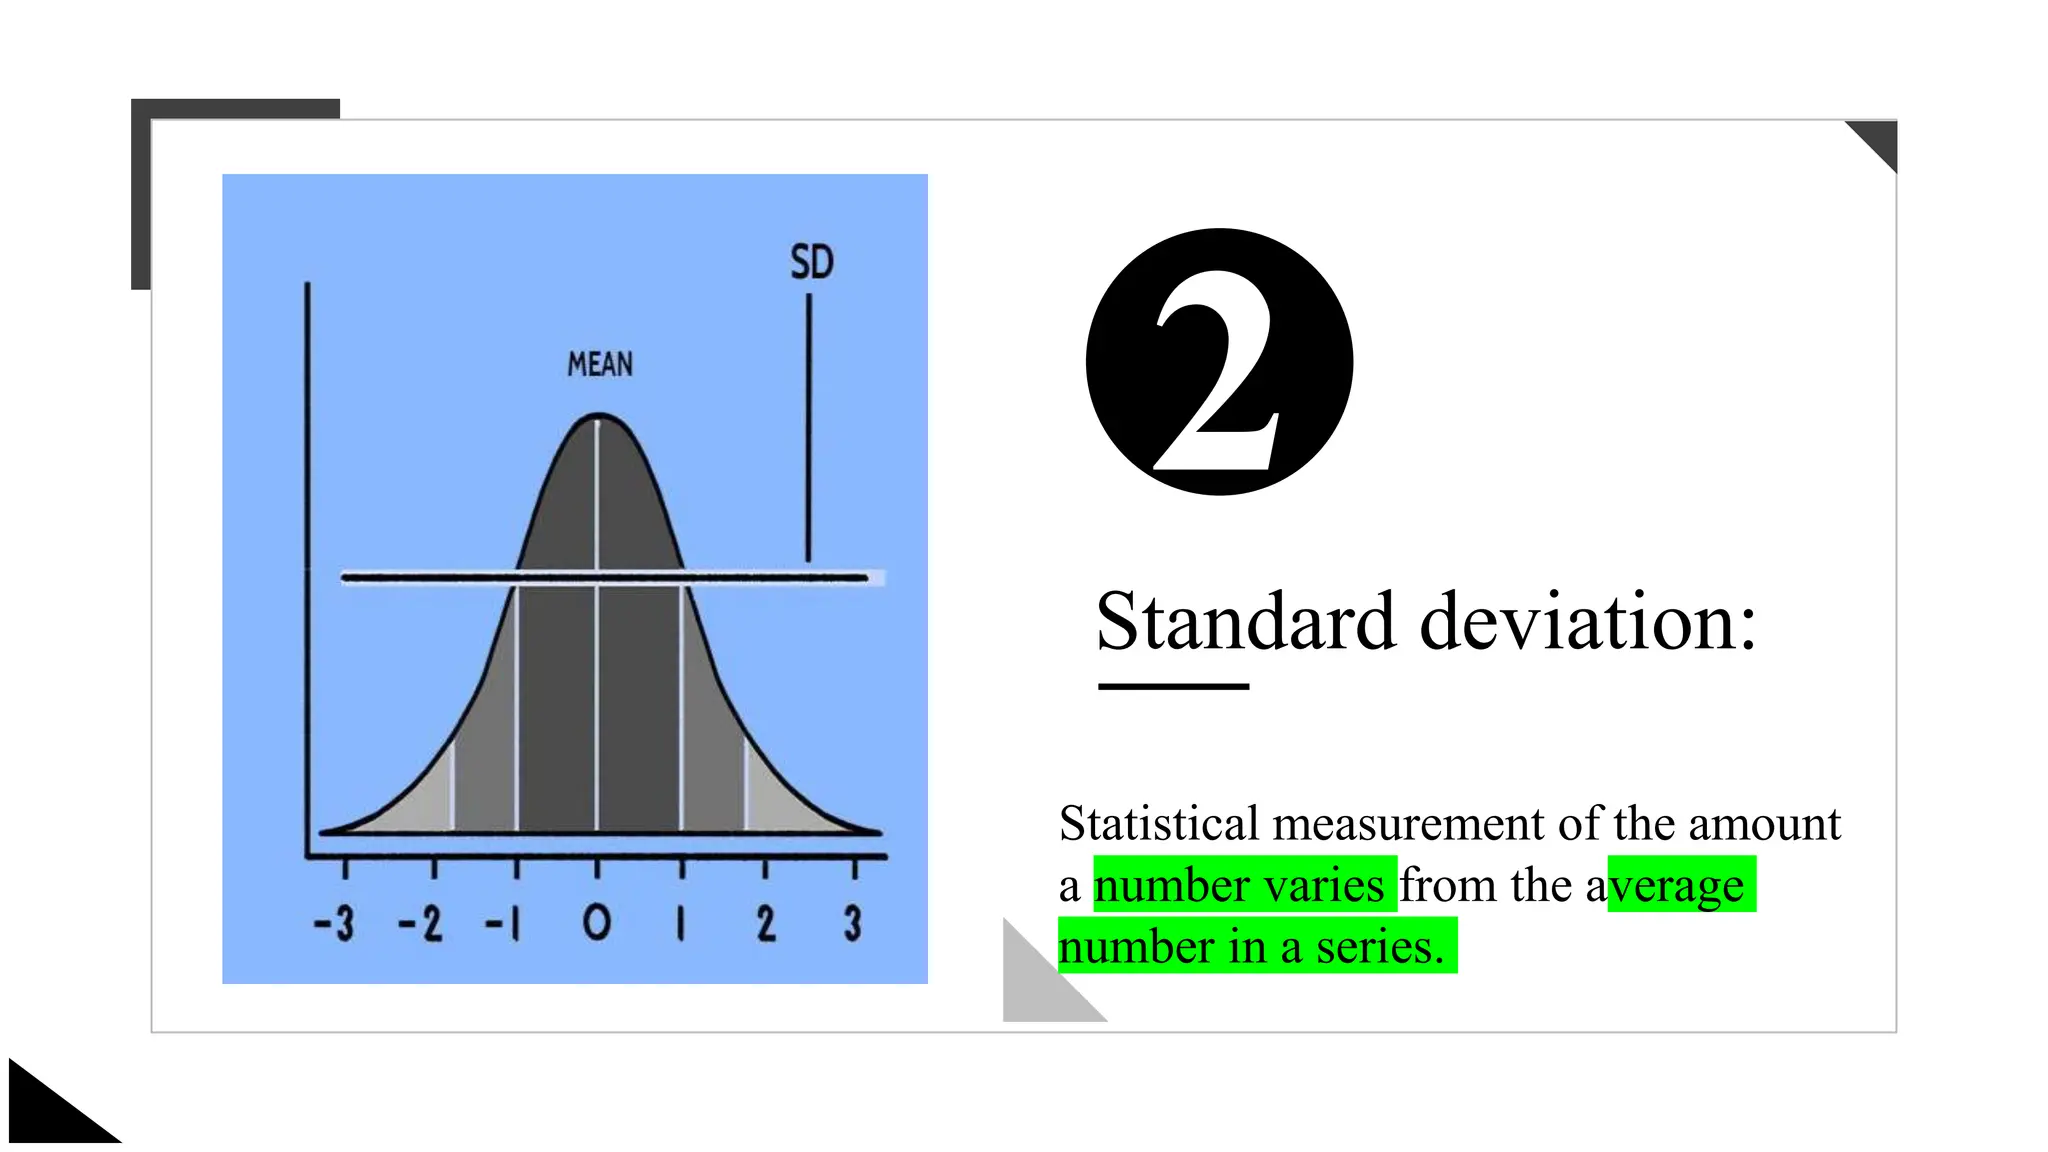
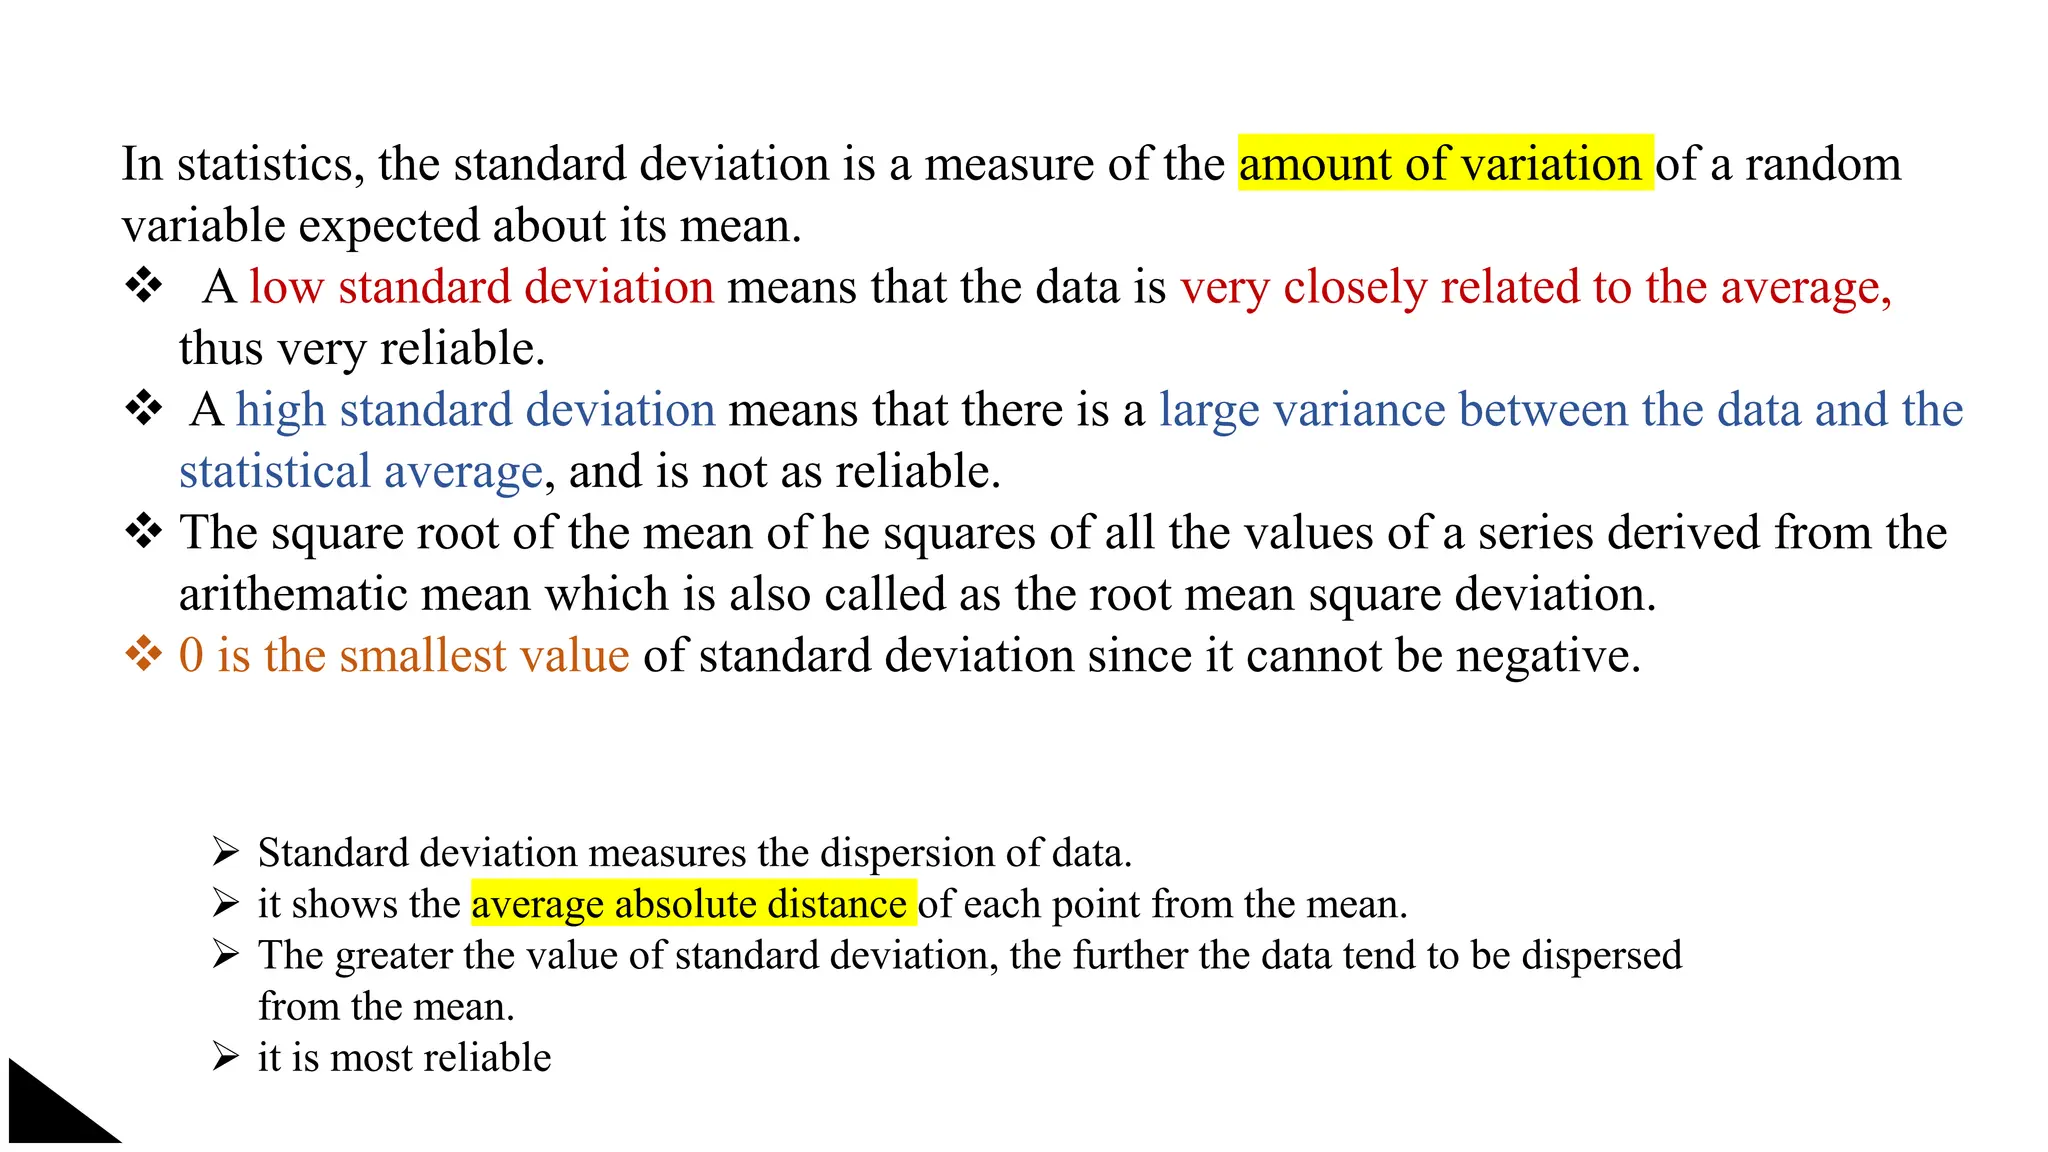
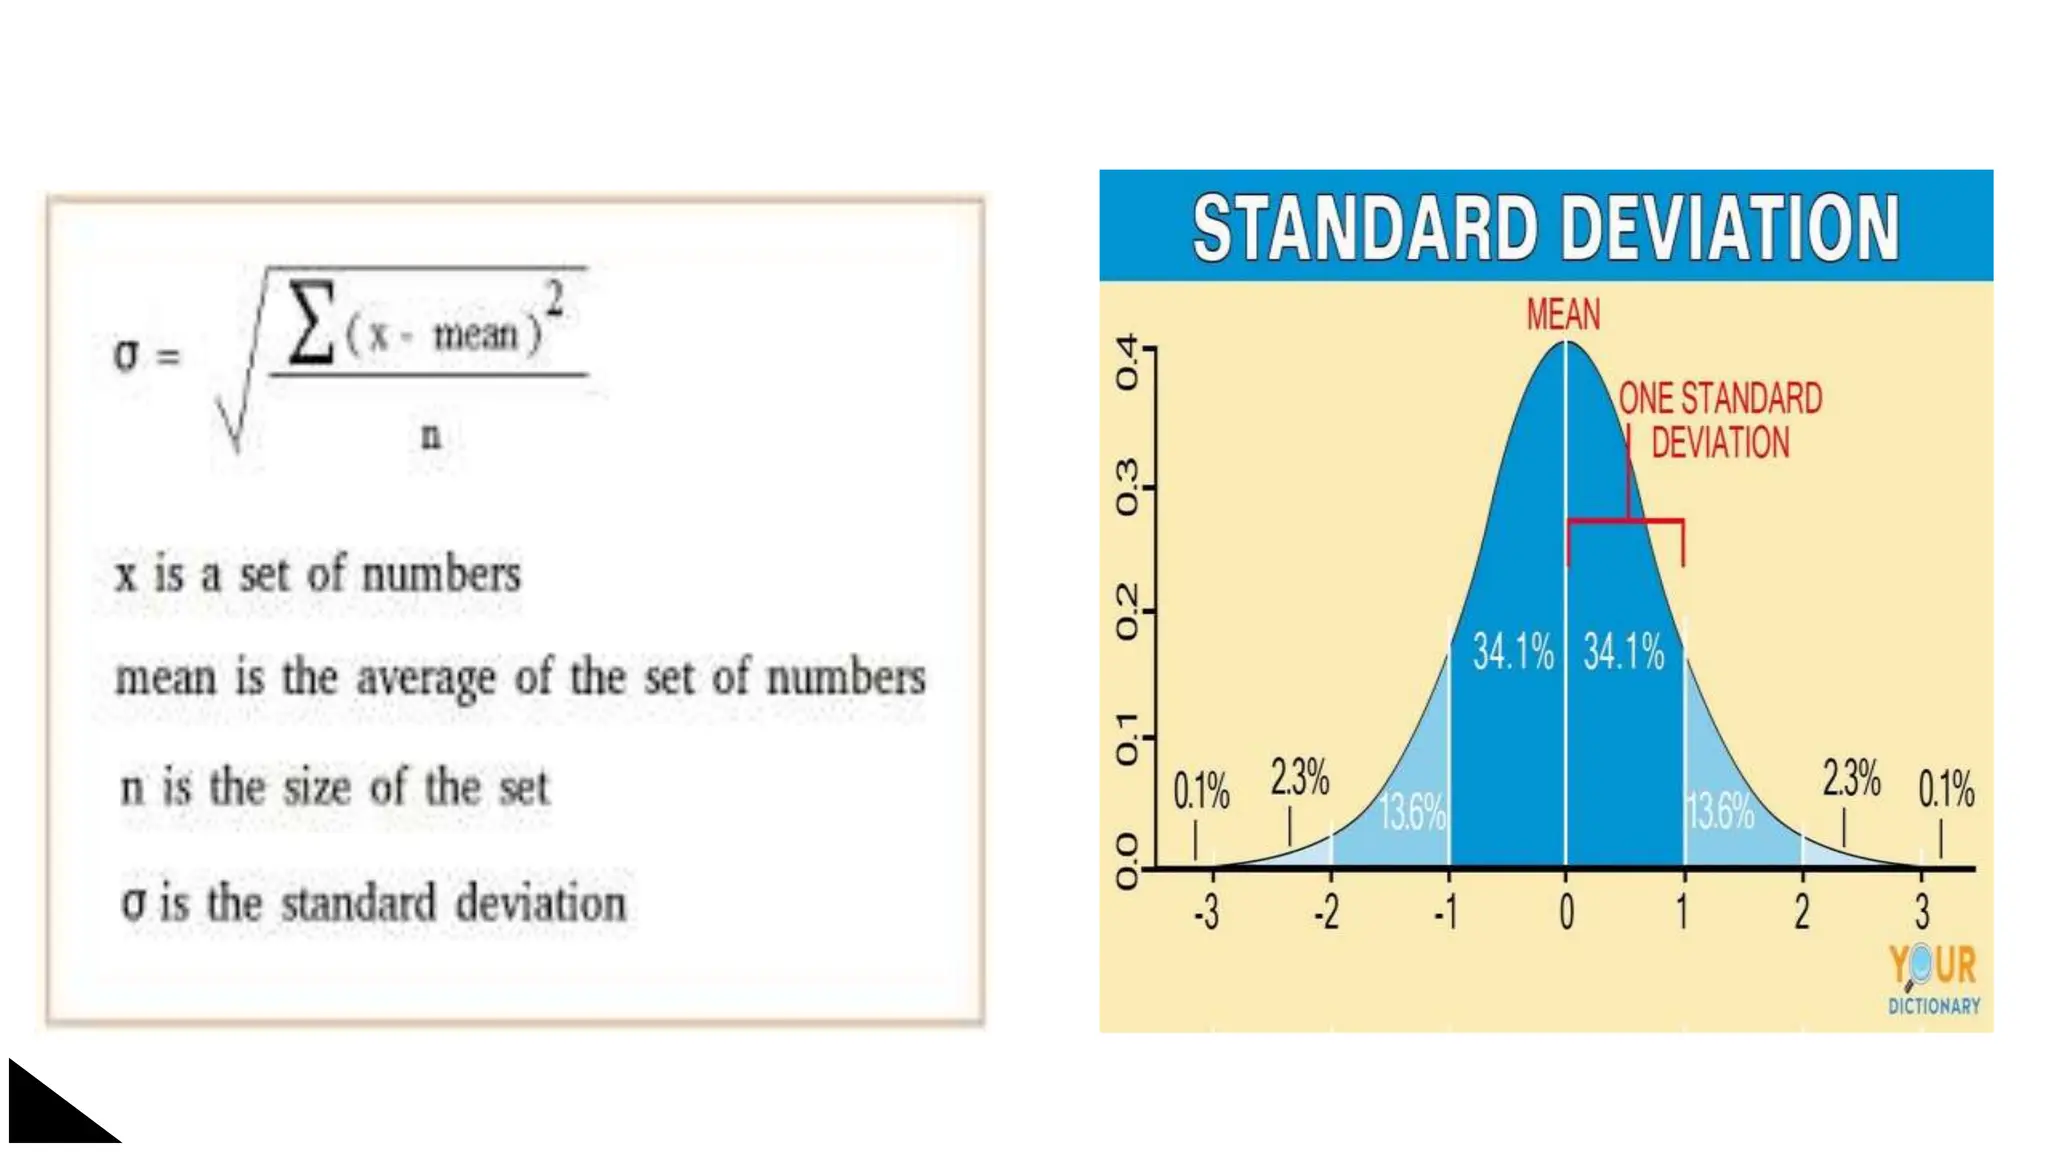
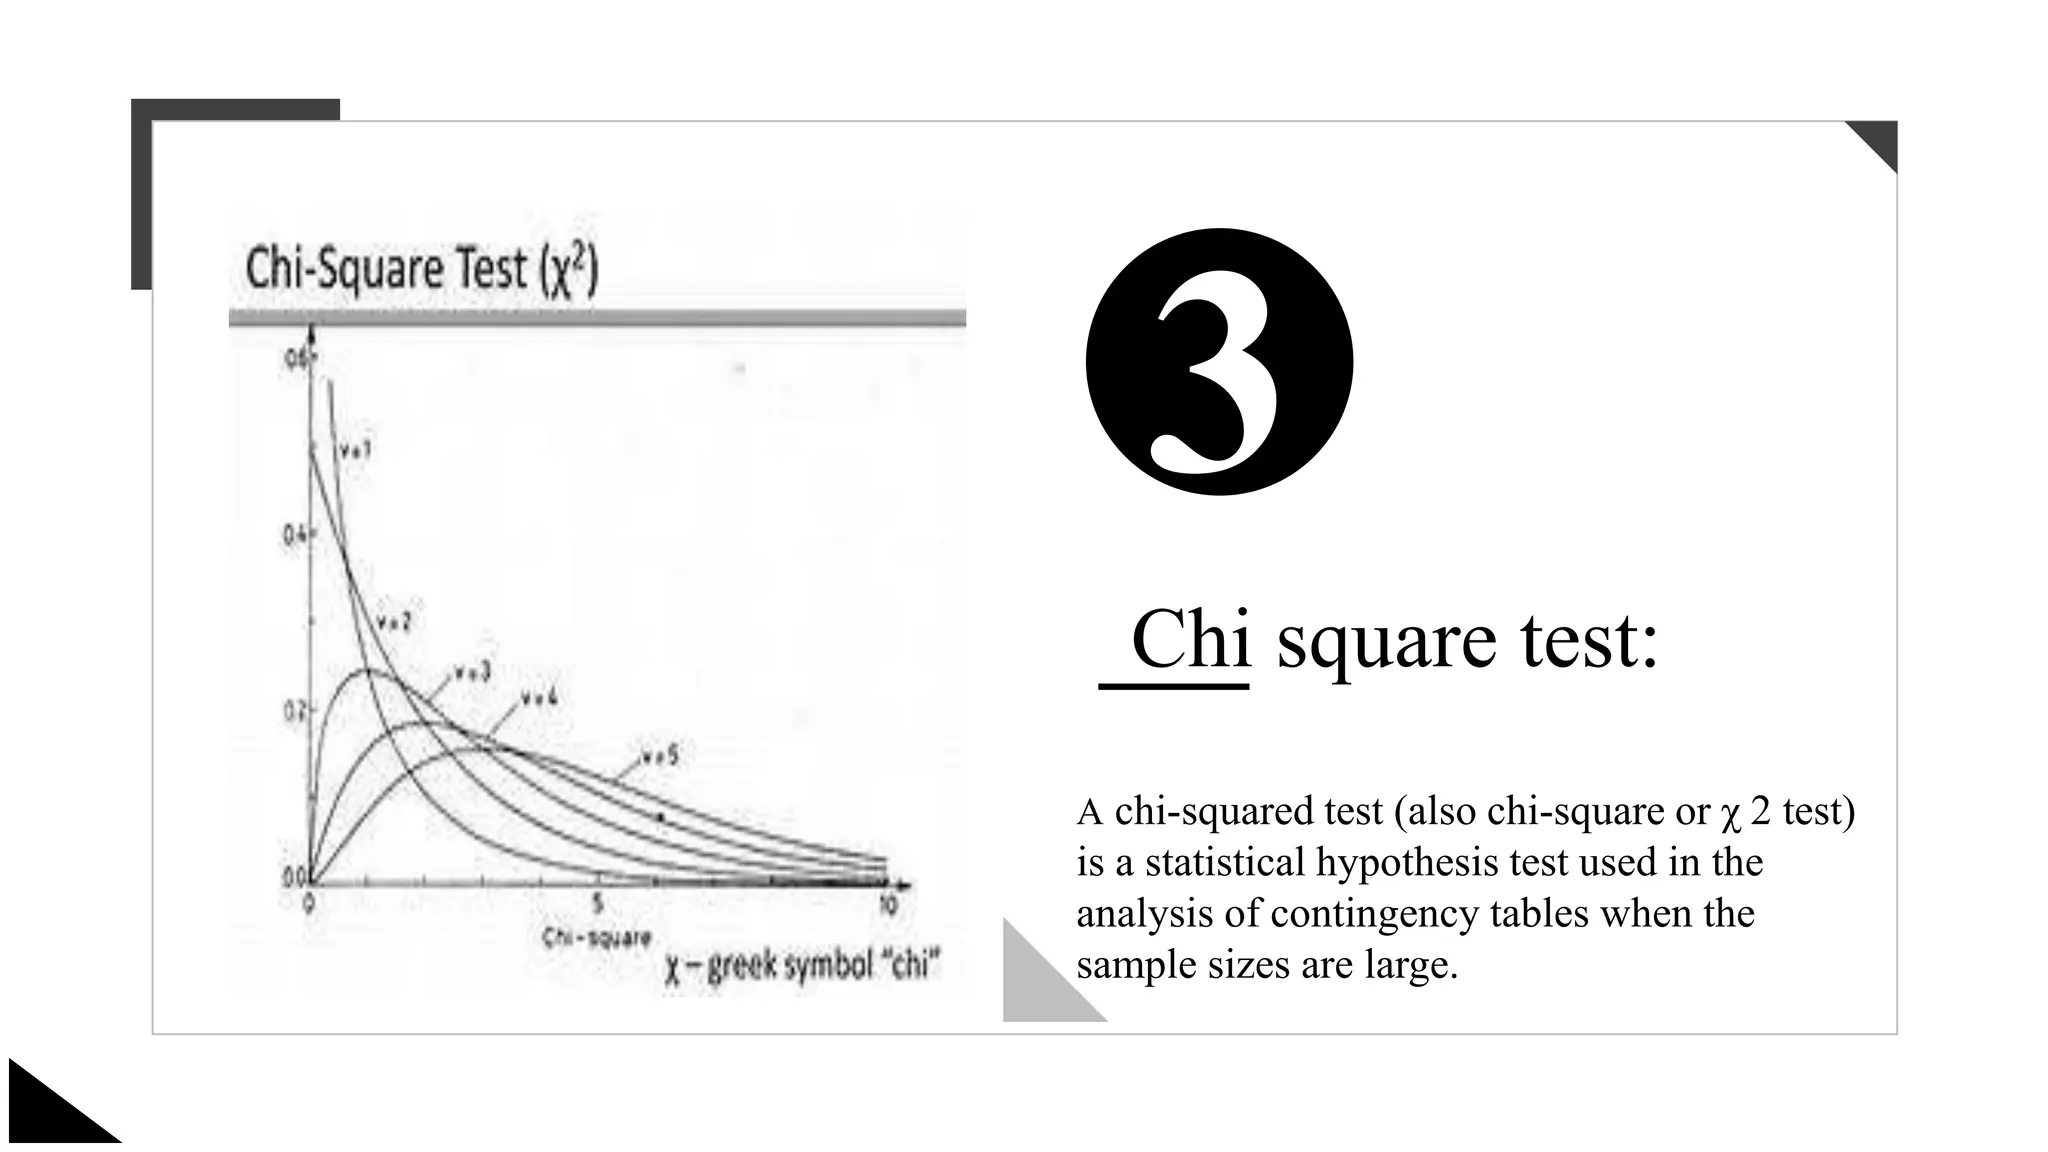
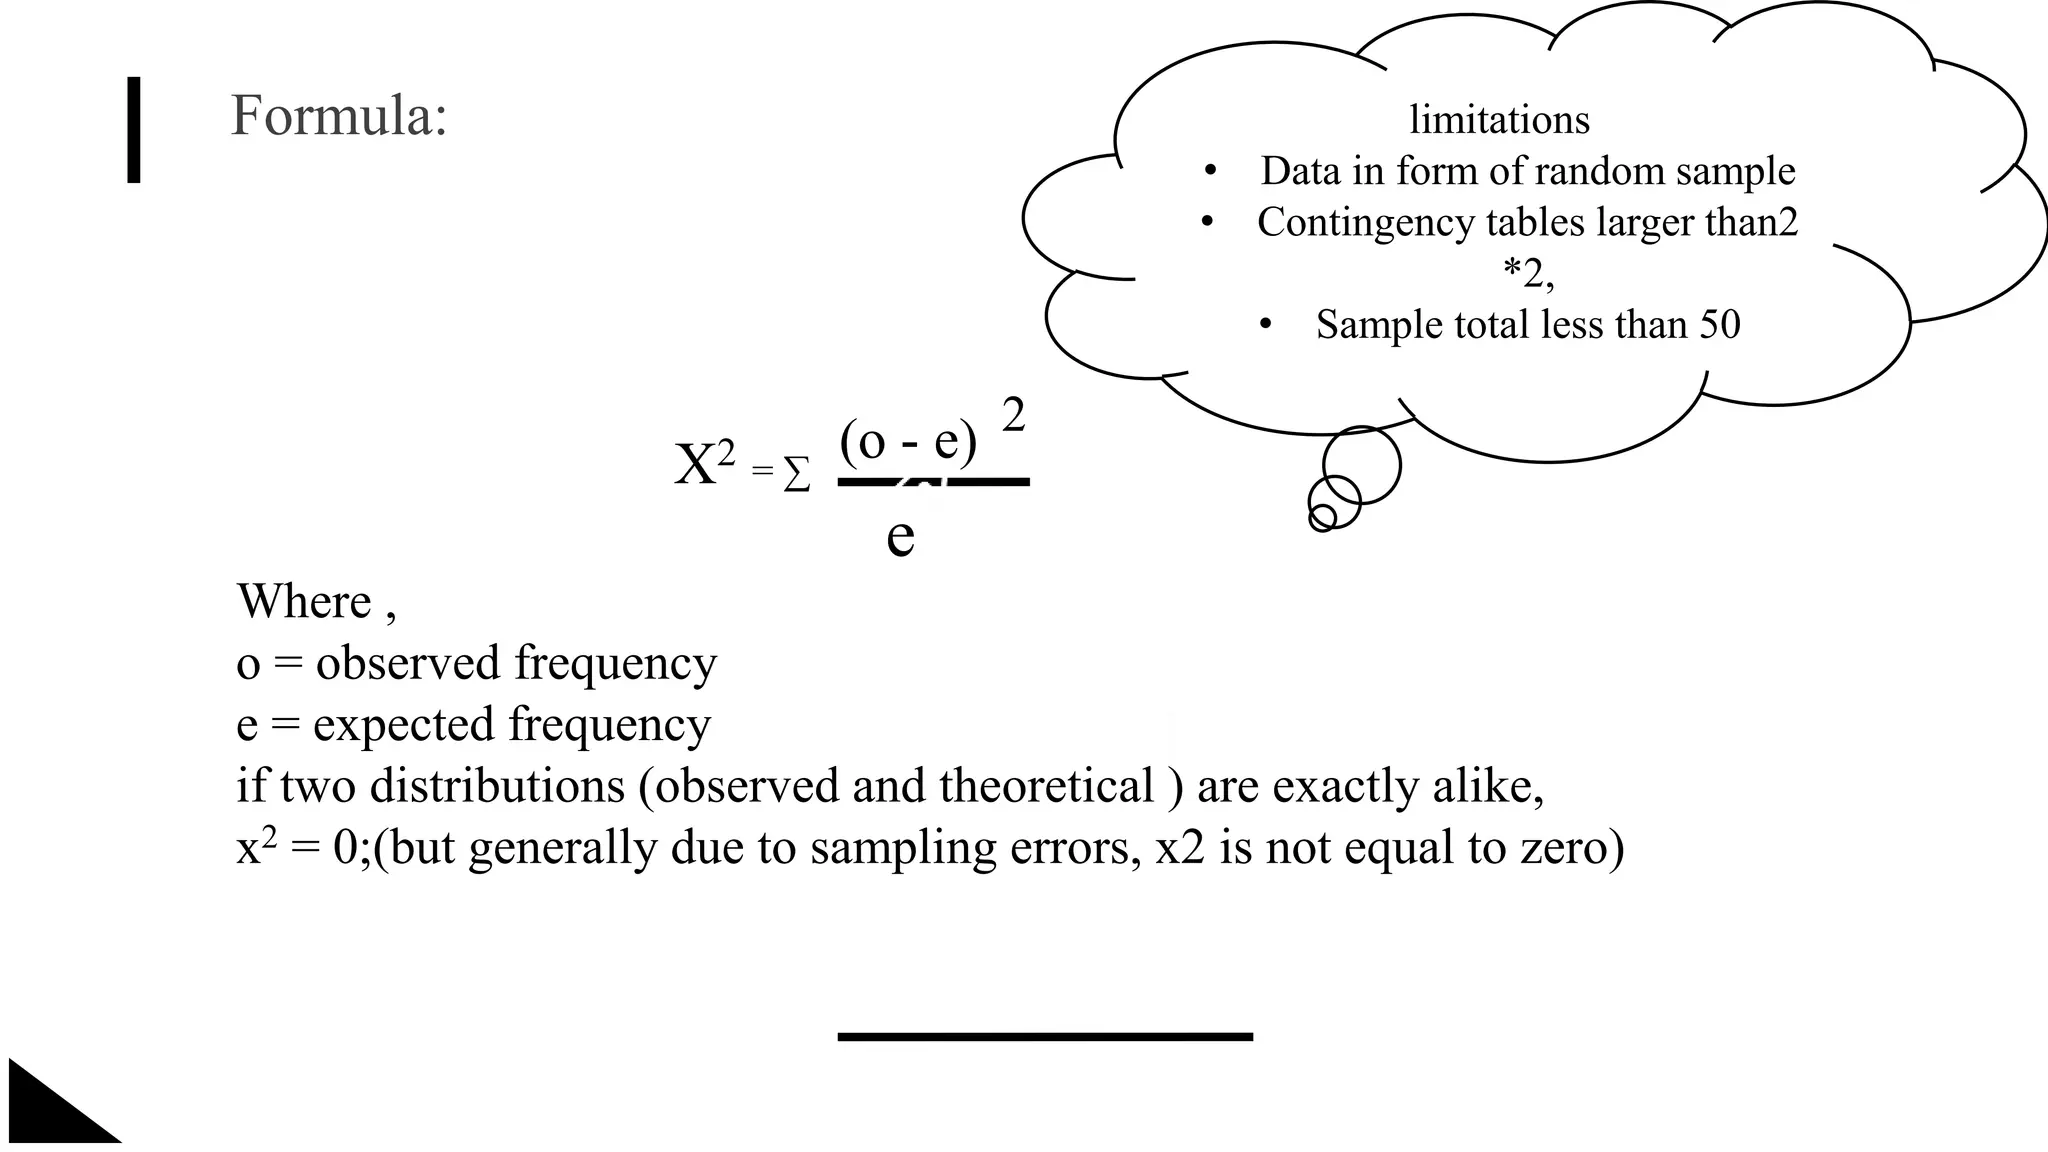
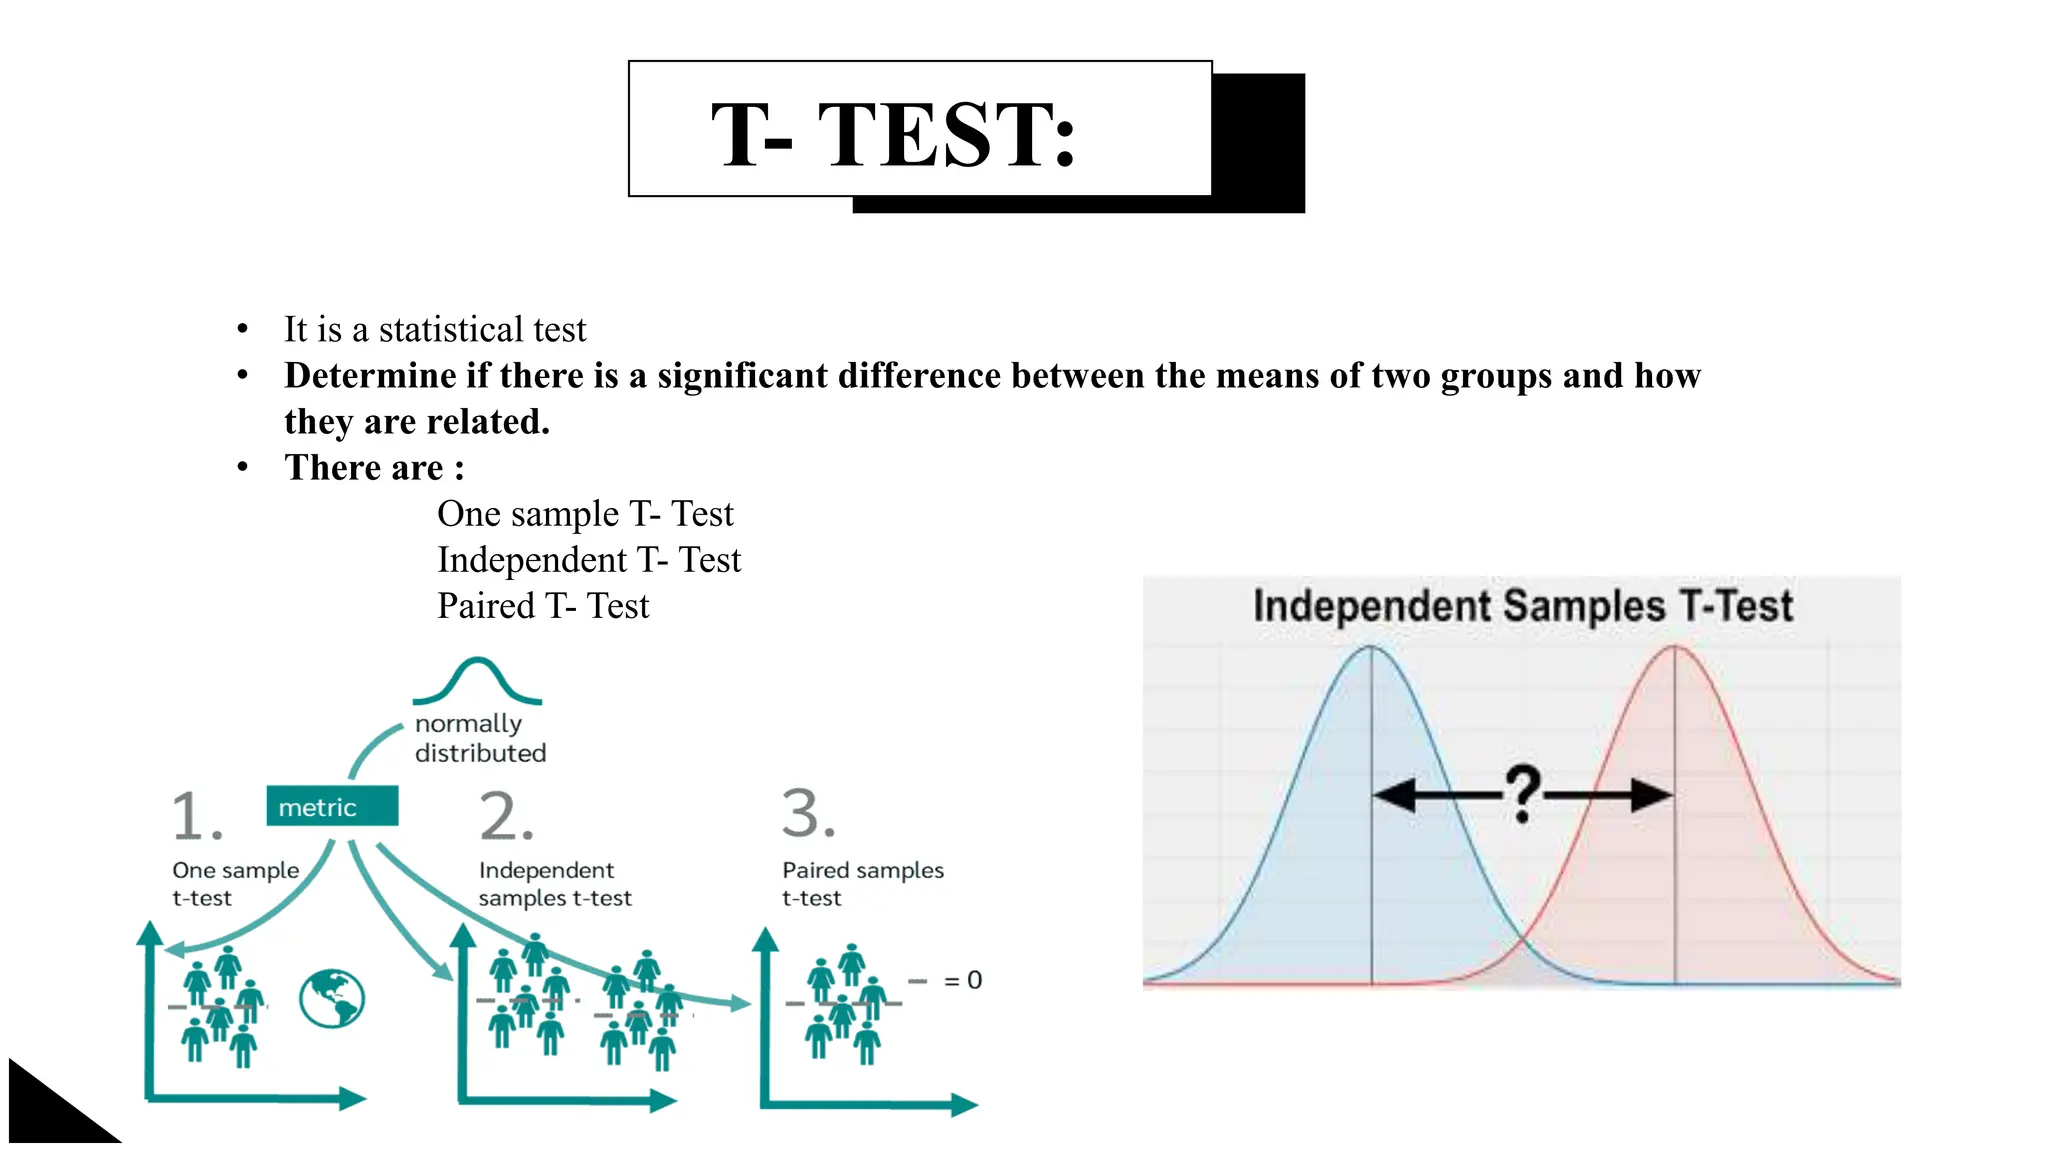
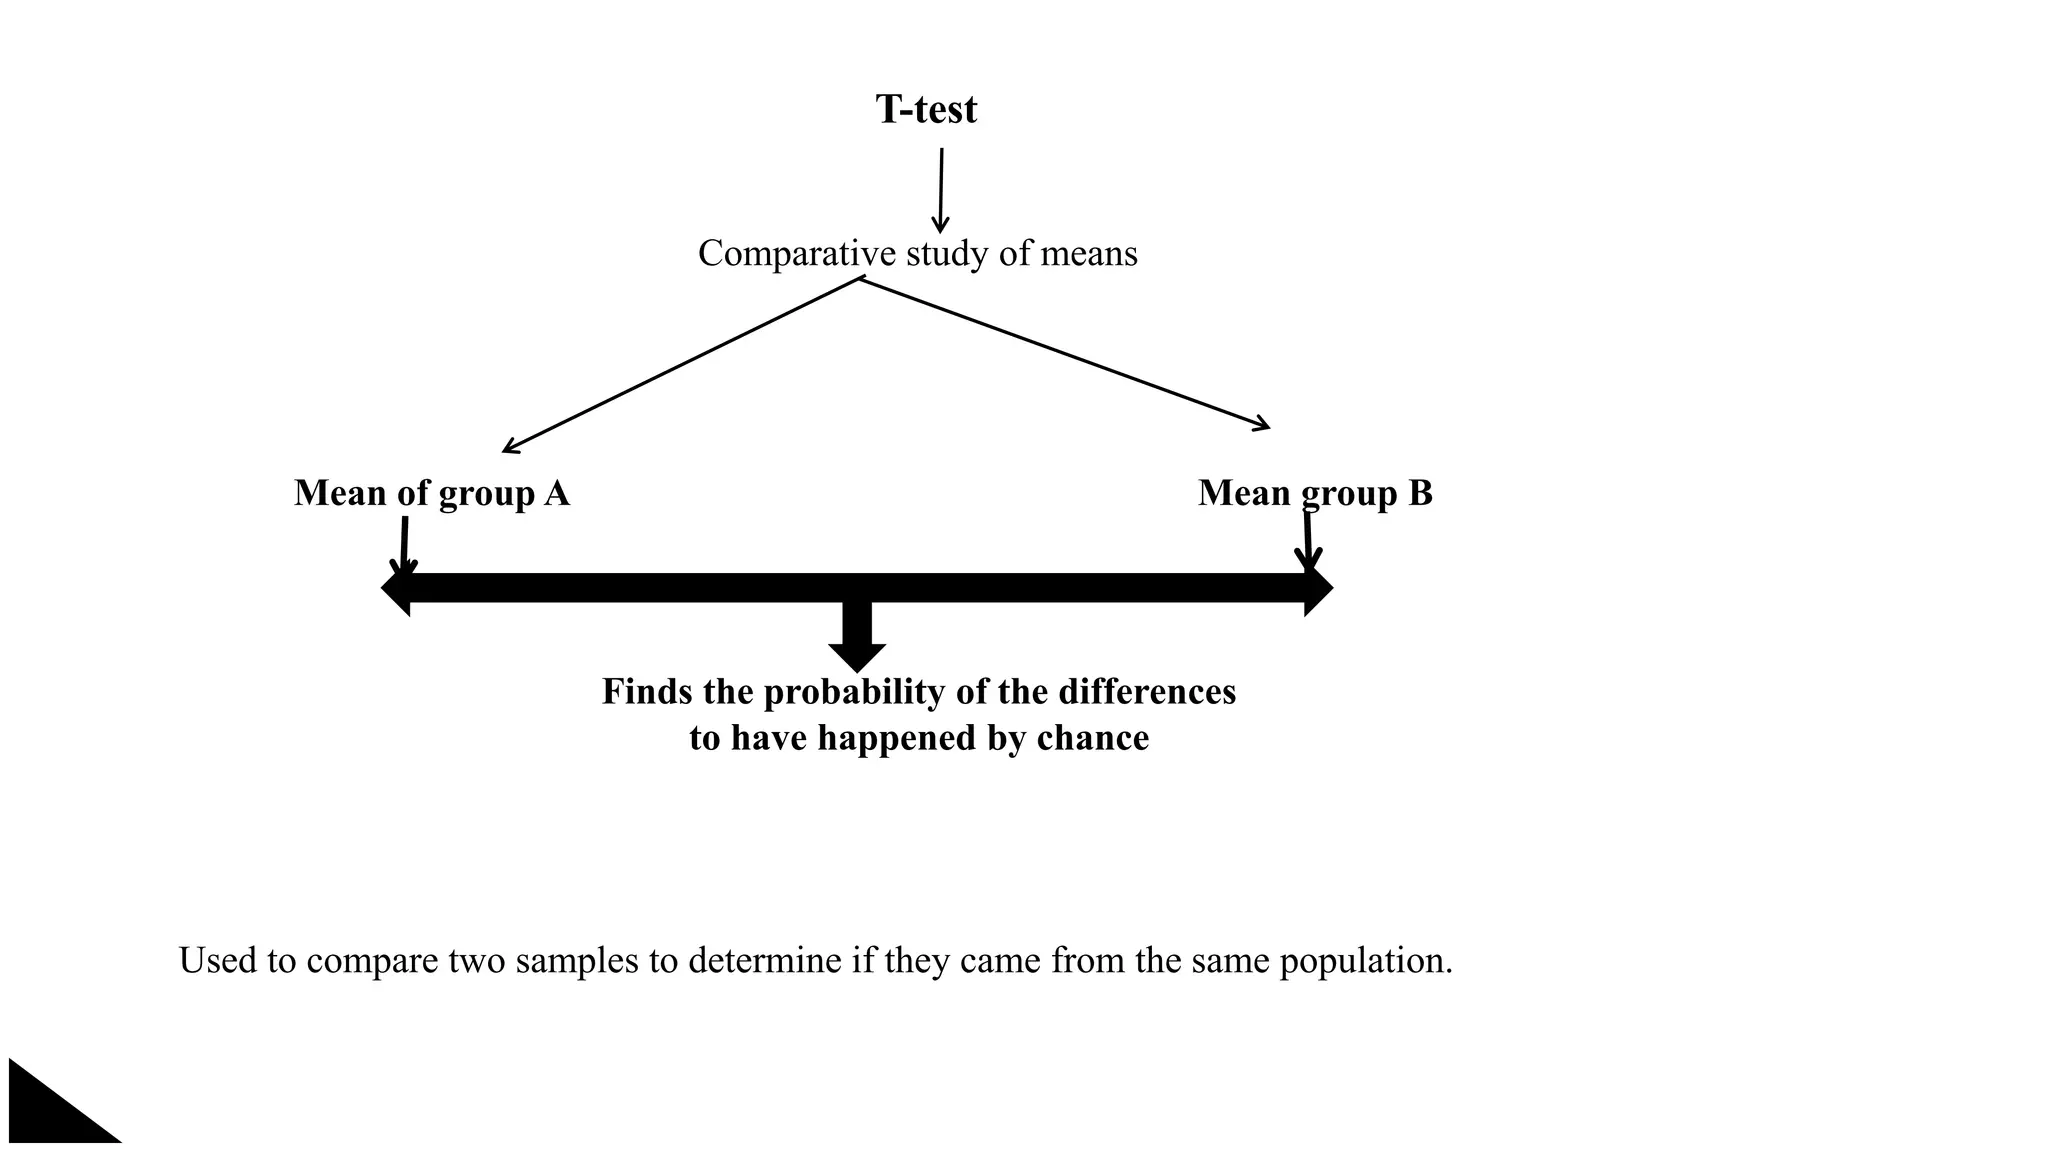
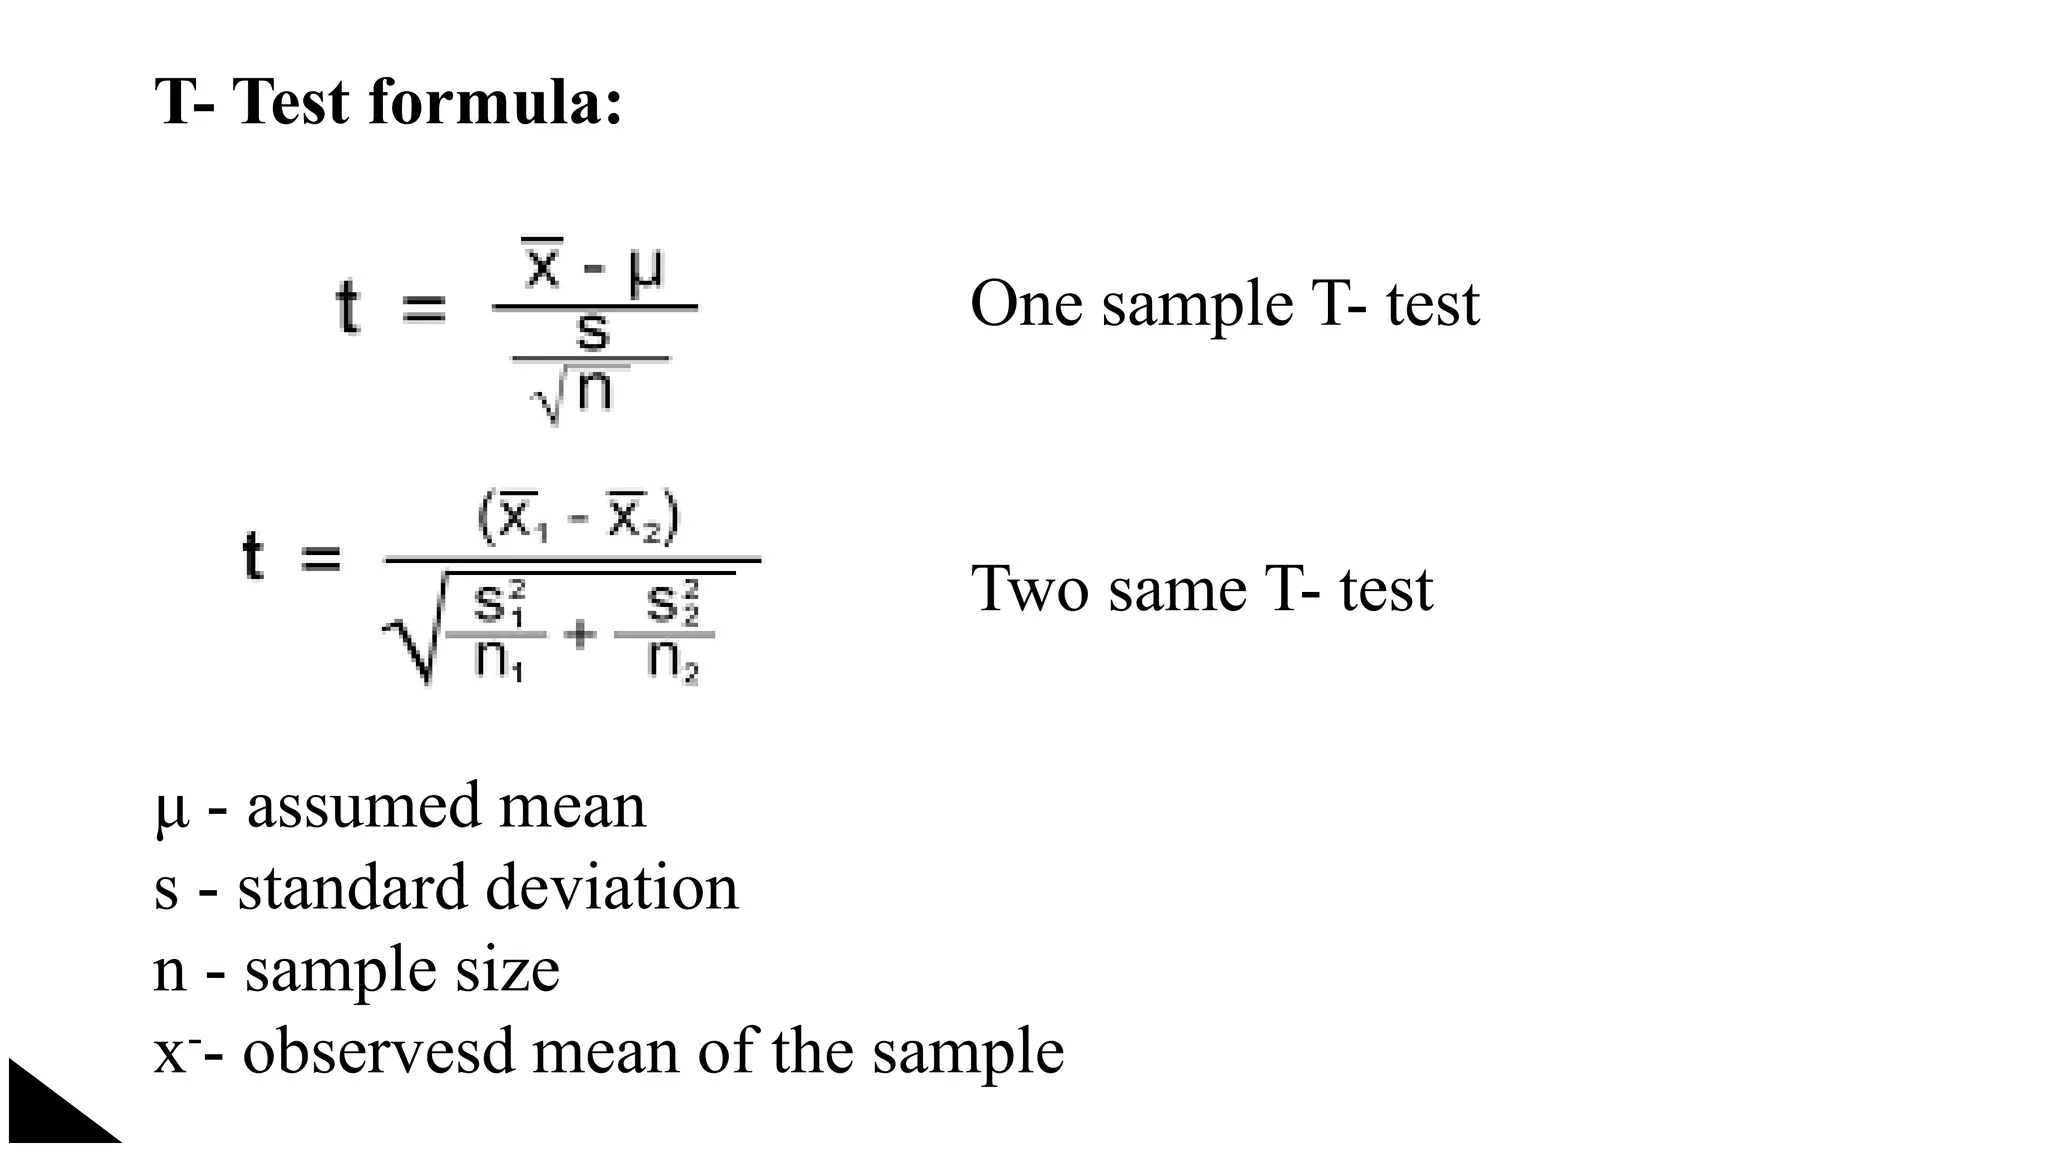
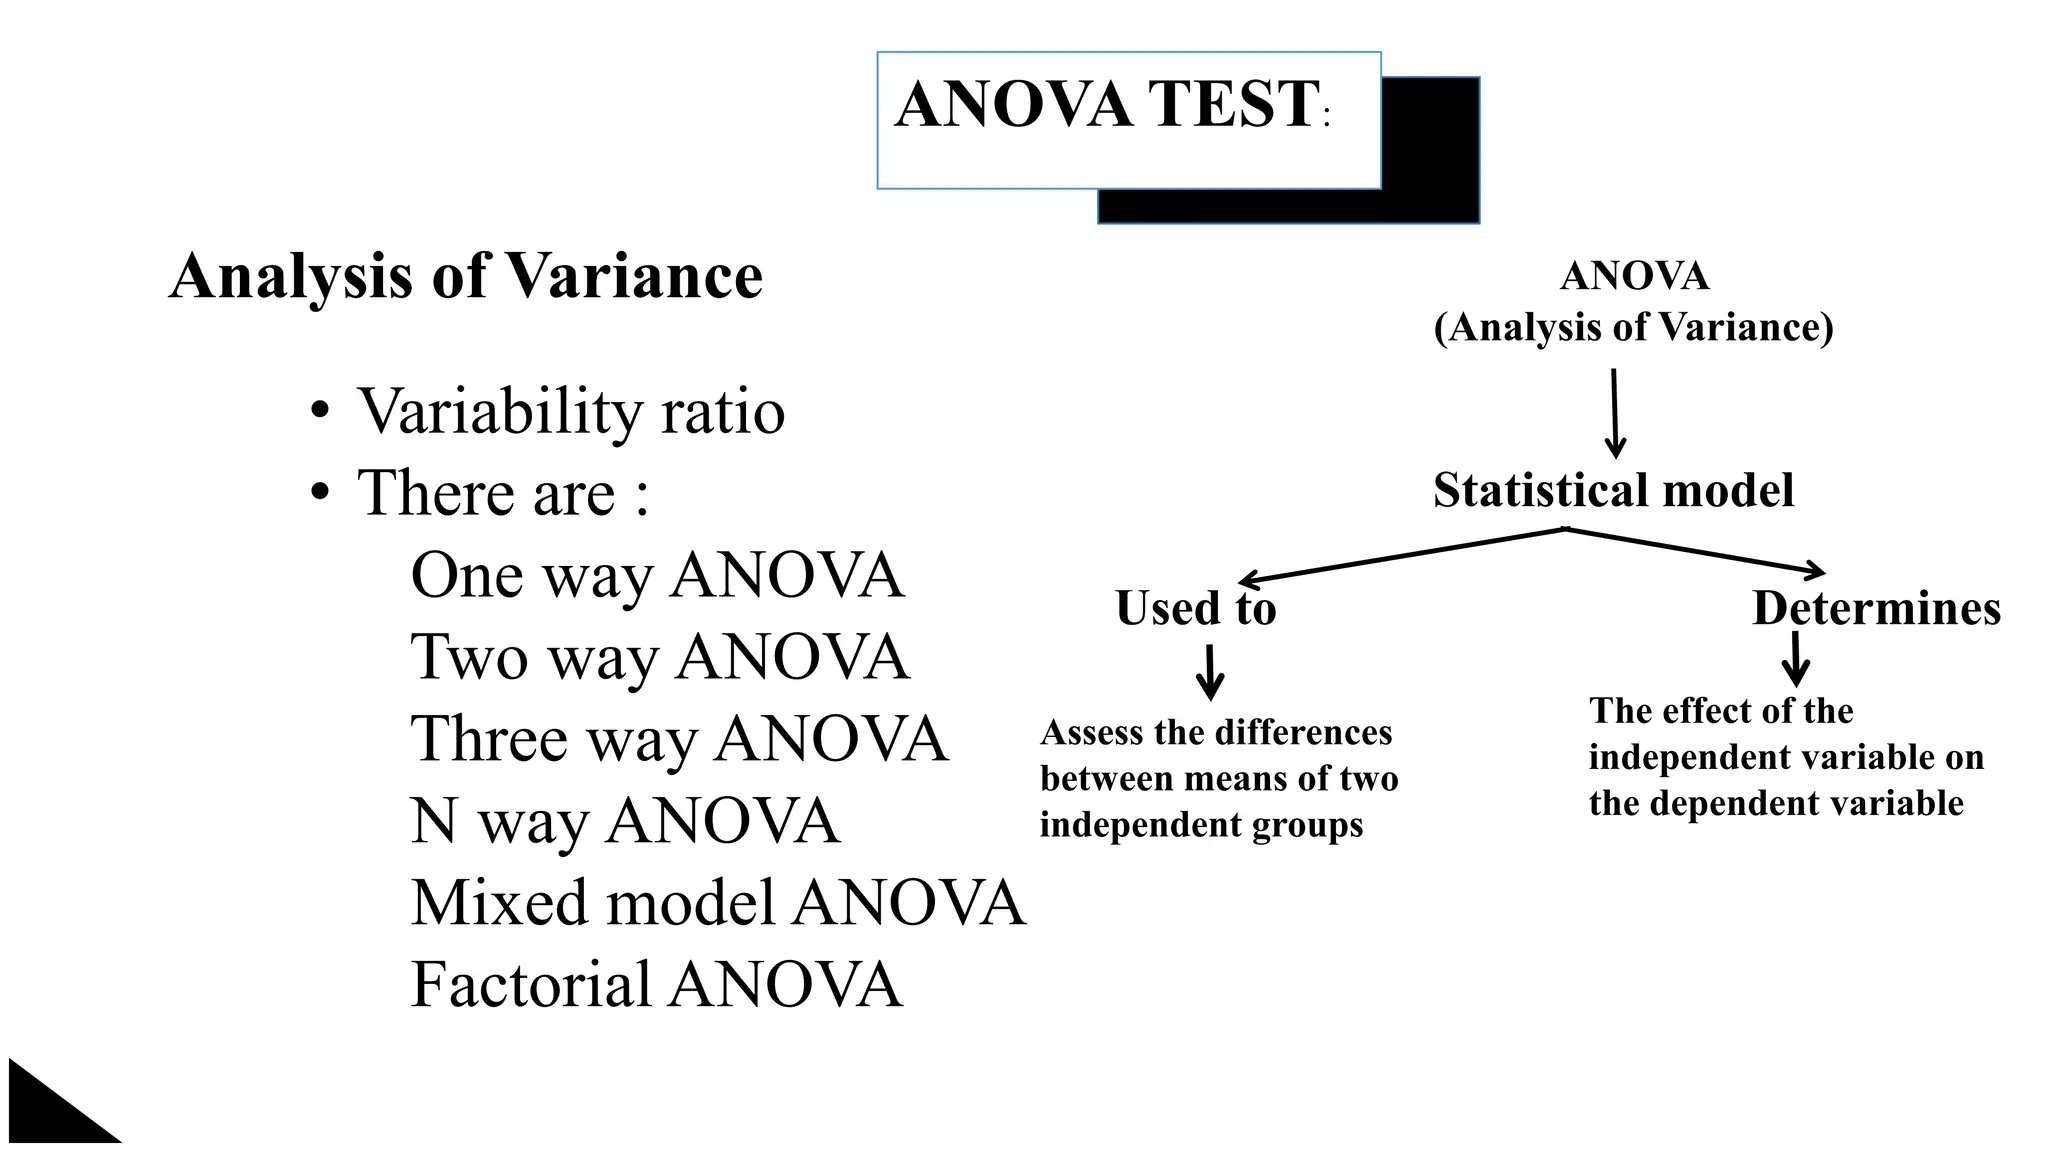
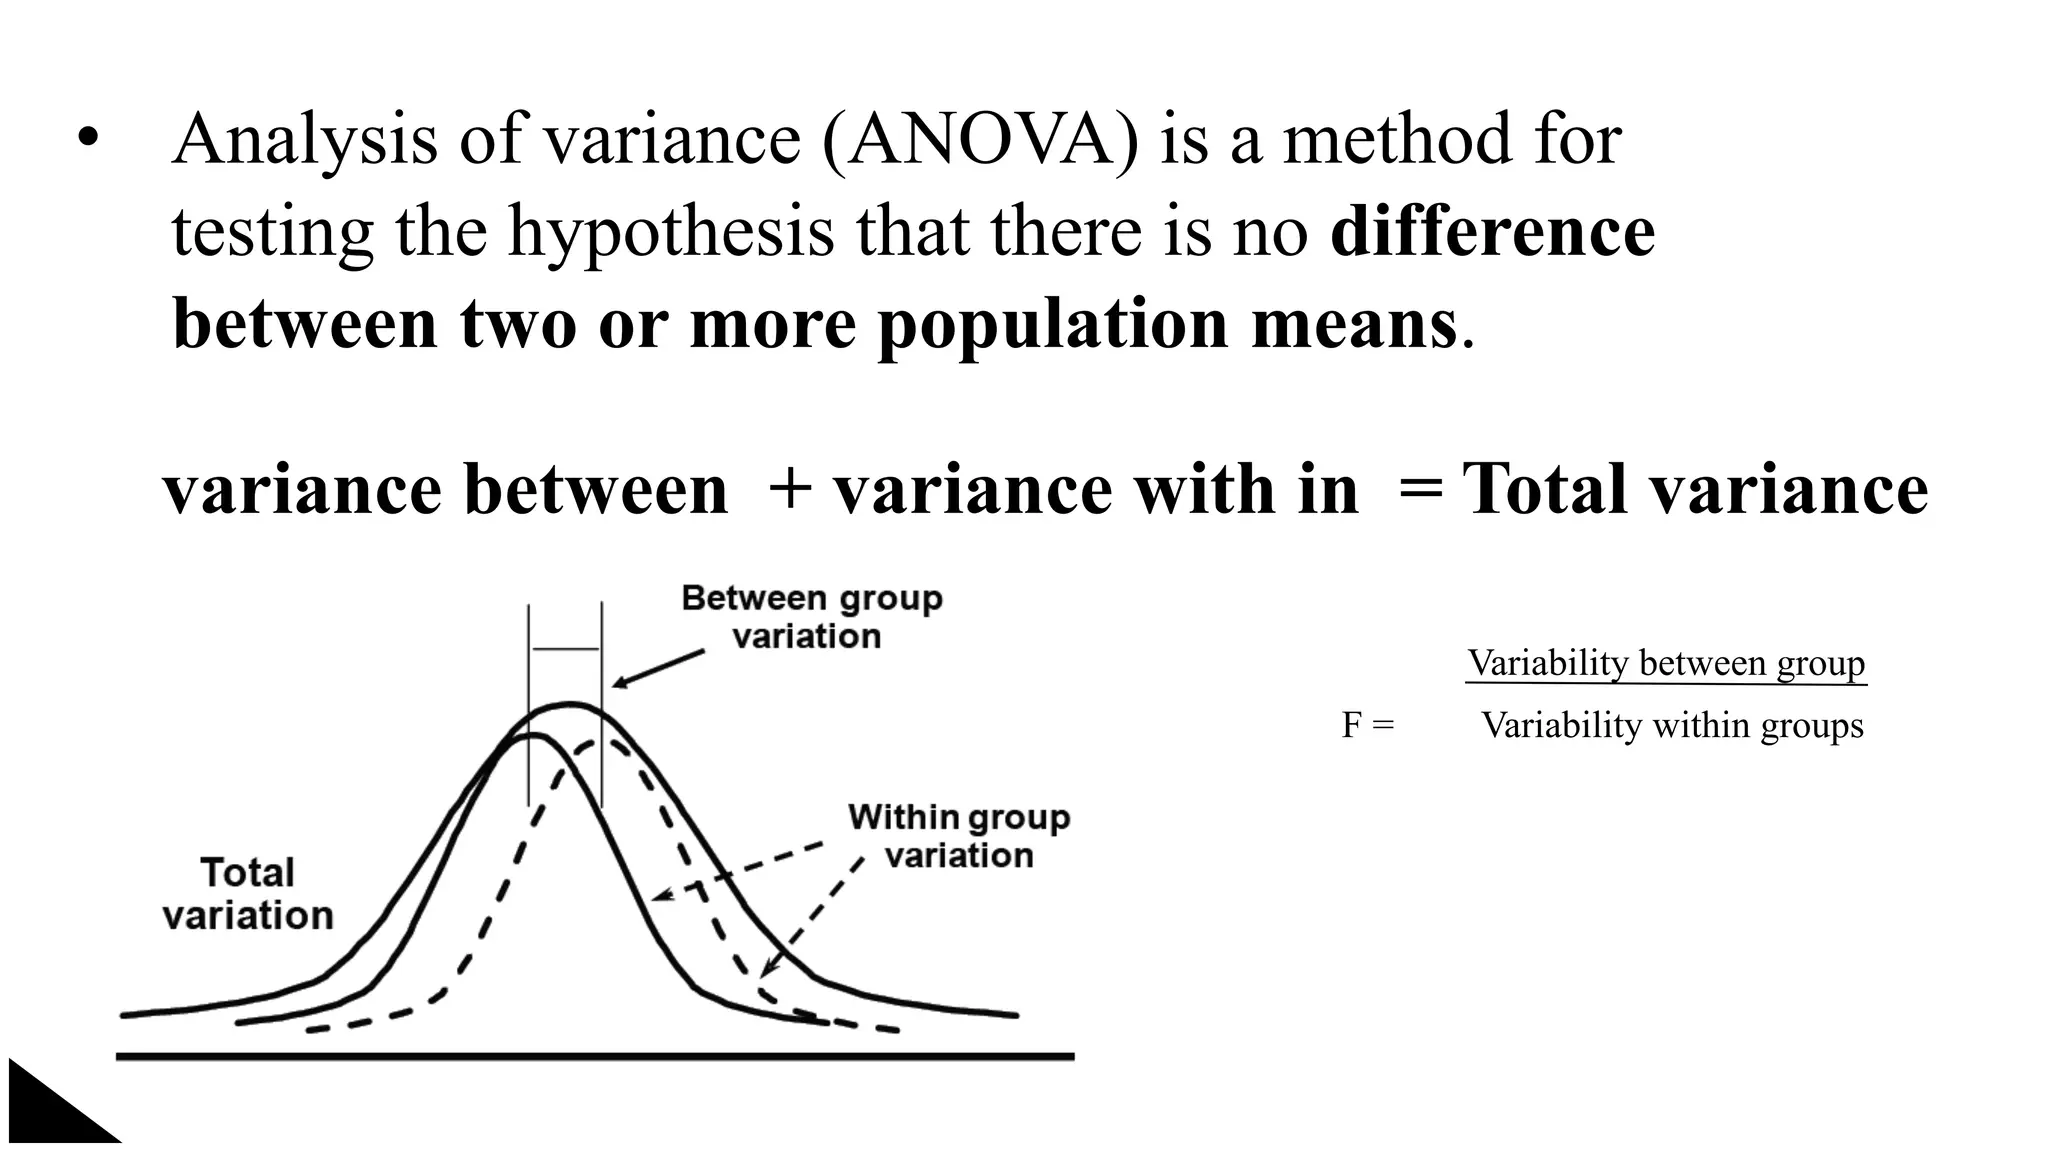
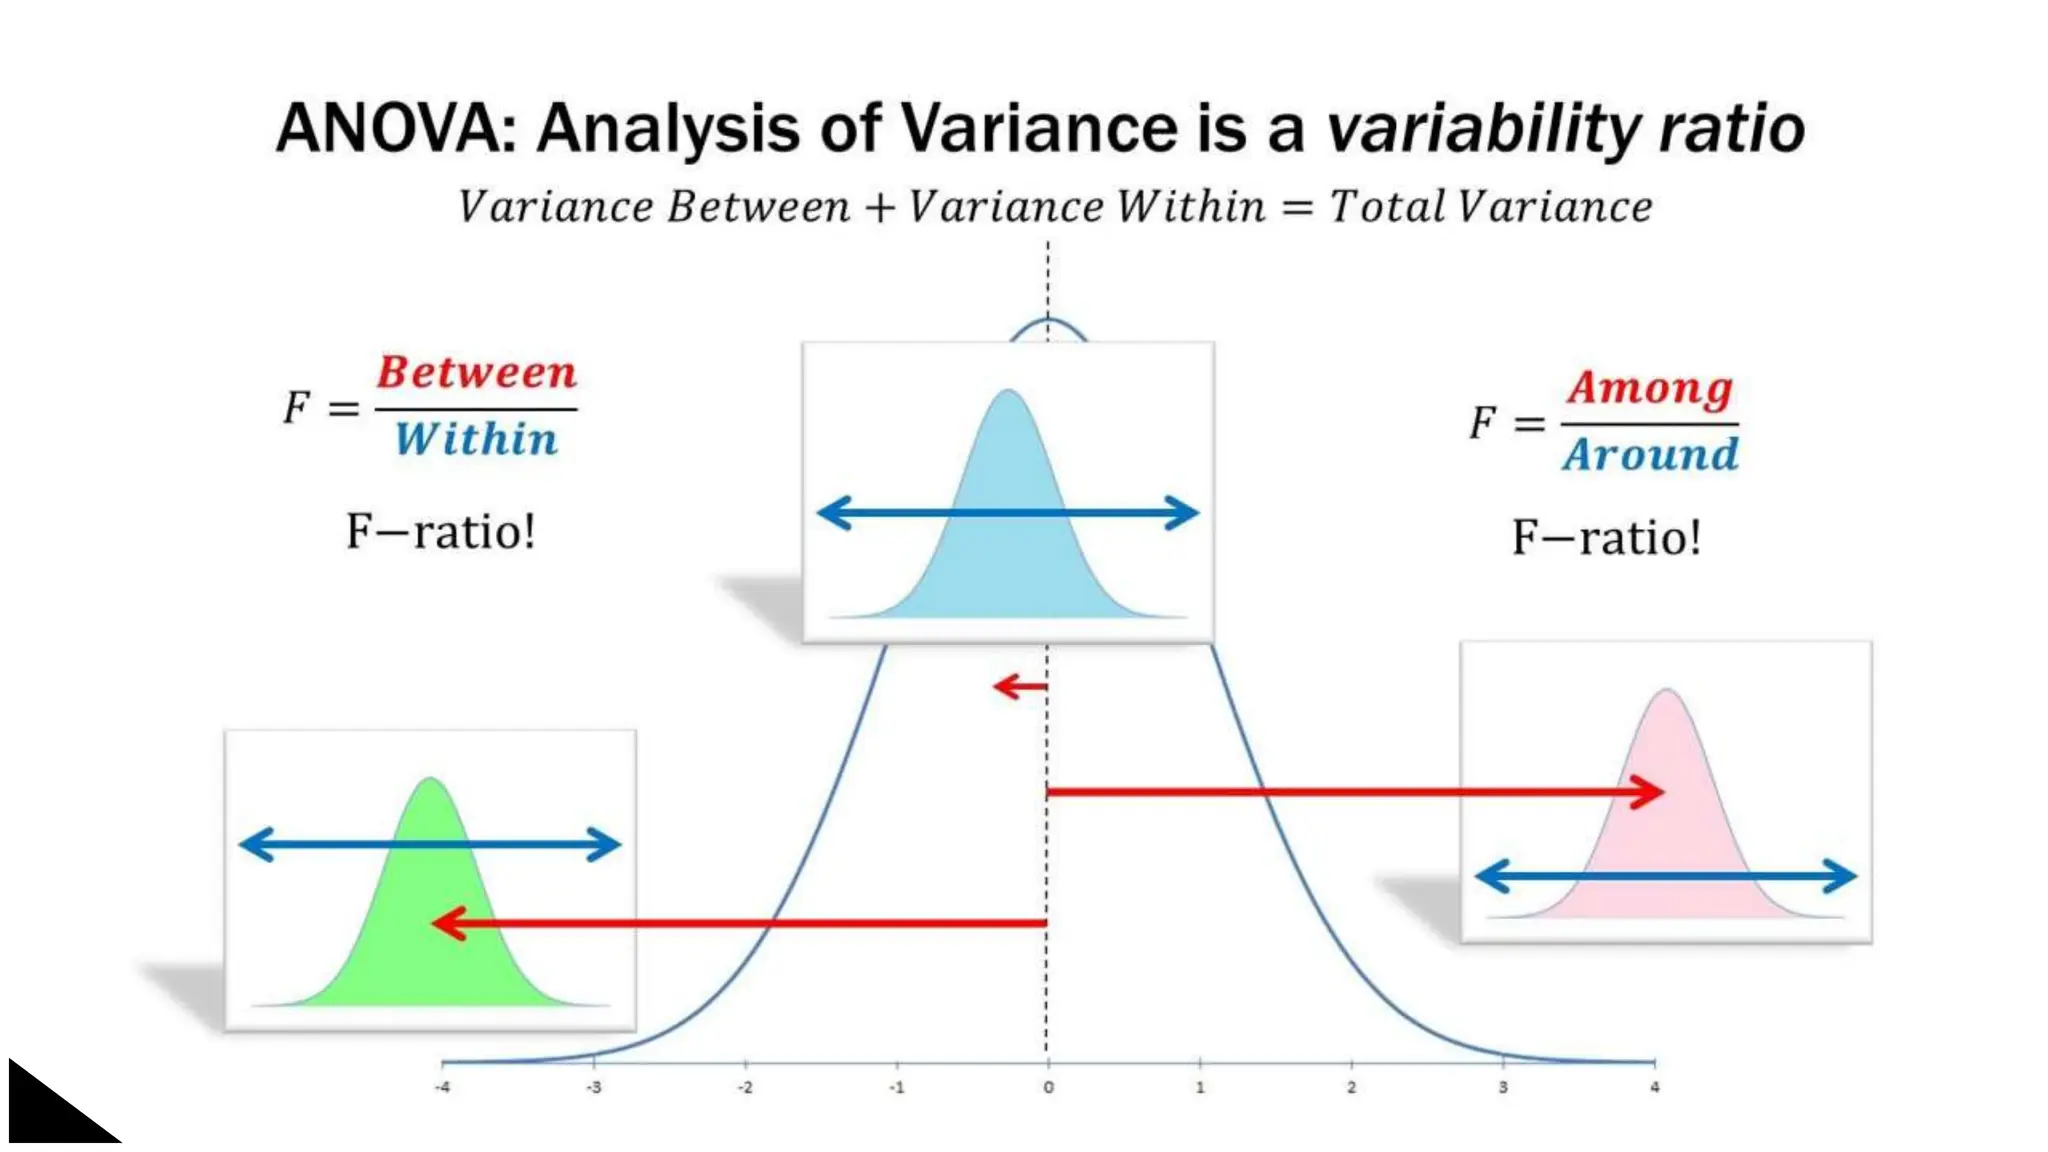
Linearity concept of significance
standard deviation,chi square test,students
T- test ,ANOVA test
Puttamreddy kavyasri
M.pharmacy
C O N T E N T S
01 02
03 04
Introduction Standarrd deviation
Chi square test T -test, ANOVA test
1
Introduction
concept of significance:
Definition of significance testing:
In statistics, it is important to know if the result of an
experiment is significant enough or not.In order to measure the
significance, there are some predefined tests which could be
applied. These tests are called the tests of significance or
simply the significance tests.
A test of significance is a formal procedure for comparing observed data with a claim
(also called a hypothesis), the truth of which is being assessed.
• The claim is a statement about a parameter, like the population proportion p or
the population mean µ.
• The results of a significance test are expressed in terms of a probability that
measures how well the data and the claim agree.
Process of significance testing:
In the process of testing for statistical significance, there are the following steps:
• Stating a hypothesis for reasearch
• Starting a null hypothesis
• Selecting a probability of error level
• Selecting and computing a satistical significance test
• Interpreting the results
• The claim tested by a statistical test is called the null hypothesis(Ho)
• The test is designed to assess the strength of evidence against the null hypothesis. often the null hypothesis
is a statement of “no dofference.”
• The claim about the population that evidence is being sought for is the alternative hypothesis(Ha)
2
Standard deviation:
Statistical measurement of the amount
a number varies from the average
number in a series.
In statistics, the standard deviation is a measure of the amount of variation of a random
variable expected about its mean.
 A low standard deviation means that the data is very closely related to the average,
thus very reliable.
 A high standard deviation means that there is a large variance between the data and the
statistical average, and is not as reliable.
 The square root of the mean of he squares of all the values of a series derived from the
arithematic mean which is also called as the root mean square deviation.
 0 is the smallest value of standard deviation since it cannot be negative.
 Standard deviation measures the dispersion of data.
 it shows the average absolute distance of each point from the mean.
 The greater the value of standard deviation, the further the data tend to be dispersed
from the mean.
 it is most reliable
3
Chi square test:
A chi-squared test (also chi-square or χ 2 test)
is a statistical hypothesis test used in the
analysis of contingency tables when the
sample sizes are large.
 A chi-squared test (symbolically represented as χ2) is basically a
data analysis on the basis of observations of a random set of
variables. Usually, it is a comparison of two statistical data sets.
 This test was introduced by Karl Pearson in 1900 for categorical
data analysis and distribution. So it was mentioned as Pearson’s chi-
squared test.
 The chi-square test is used to estimate how likely the observations
that are made would be, by considering the assumption of the null
hypothesis as true.
CHI SQUARE TEAT is a non parametric test not based on any assumption or
distribution of any variable.
This statistical test follows a specific distribution know as chi square
distribution.
In general the tet we use to measure the differences between what is
observed and what is expected according to an assumed hypothesis is called
the CHI SQUARE TEST.
IMPORTANT CHARECTERISTICS OF CHI SQUARE TEST
• This test (as non parametric test) is based on frequencies and not on the parameters like mean and
standard deviation.
• The test is used for testing the hypothesis and is not useful for estimation.
• This test can also be applied to a complex contingency table with servral classes and suchh is a
very useful test in research work.
• This test is an important npn parametric test as no rigid assumptions are necessary in regarad to
the type of population,no need of parameter values and relatively less mathematical details are
involved.
Chi square Distribution:
If degree of freedom >2 : Distributionis bell shaped
If degree of freddom =2 : Distribution is L shaped with
maximum ordinate at zero
If degree of freedom <2(>0) : Distribution L shaped with
infinite ordinate at the
origin.
Applications of chi square test:
2 . . .
1 . .
.
3 .
. .
Goodness of fit of
distributions
Test of
independence of
attributes
Test of
homoge
nity
Formula:
X2 = ∑
(o - e) 2
e
Where ,
o = observed frequency
e = expected frequency
if two distributions (observed and theoretical ) are exactly alike,
x2 = 0;(but generally due to sampling errors, x2 is not equal to zero)
limitations
• Data in form of random sample
• Contingency tables larger than2
*2,
• Sample total less than 50
T- TEST:
• It is a statistical test
• Determine if there is a significant difference between the means of two groups and how
they are related.
• There are :
One sample T- Test
Independent T- Test
Paired T- Test
T-test
Comparative study of means
Mean of group A Mean group B
Finds the probability of the differences
to have happened by chance
Used to compare two samples to determine if they came from the same population.
T- Test formula:
One sample T- test
Two same T- test
μ - assumed mean
s - standard deviation
n - sample size
x-- observesd mean of the sample
ANOVA TEST:
Analysis of Variance
• Variability ratio
• There are :
One way ANOVA
Two way ANOVA
Three way ANOVA
N way ANOVA
Mixed model ANOVA
Factorial ANOVA
ANOVA
(Analysis of Variance)
Statistical model
Used to Determines
Assess the differences
between means of two
independent groups
The effect of the
independent variable on
the dependent variable
• Analysis of variance (ANOVA) is a method for
testing the hypothesis that there is no difference
between two or more population means.
variance between + variance with in = Total variance
F =
Variability between group
Variability within groups
linearity concept of significance, standard deviation, chi square test, students T- test, ANOVA test

linearity concept of significance, standard deviation, chi square test, students T- test, ANOVA test

  • 1.
    Linearity concept ofsignificance standard deviation,chi square test,students T- test ,ANOVA test Puttamreddy kavyasri M.pharmacy
  • 2.
    C O NT E N T S 01 02 03 04 Introduction Standarrd deviation Chi square test T -test, ANOVA test
  • 3.
  • 4.
    Definition of significancetesting: In statistics, it is important to know if the result of an experiment is significant enough or not.In order to measure the significance, there are some predefined tests which could be applied. These tests are called the tests of significance or simply the significance tests. A test of significance is a formal procedure for comparing observed data with a claim (also called a hypothesis), the truth of which is being assessed. • The claim is a statement about a parameter, like the population proportion p or the population mean µ. • The results of a significance test are expressed in terms of a probability that measures how well the data and the claim agree.
  • 5.
    Process of significancetesting: In the process of testing for statistical significance, there are the following steps: • Stating a hypothesis for reasearch • Starting a null hypothesis • Selecting a probability of error level • Selecting and computing a satistical significance test • Interpreting the results • The claim tested by a statistical test is called the null hypothesis(Ho) • The test is designed to assess the strength of evidence against the null hypothesis. often the null hypothesis is a statement of “no dofference.” • The claim about the population that evidence is being sought for is the alternative hypothesis(Ha)
  • 6.
    2 Standard deviation: Statistical measurementof the amount a number varies from the average number in a series.
  • 7.
    In statistics, thestandard deviation is a measure of the amount of variation of a random variable expected about its mean.  A low standard deviation means that the data is very closely related to the average, thus very reliable.  A high standard deviation means that there is a large variance between the data and the statistical average, and is not as reliable.  The square root of the mean of he squares of all the values of a series derived from the arithematic mean which is also called as the root mean square deviation.  0 is the smallest value of standard deviation since it cannot be negative.  Standard deviation measures the dispersion of data.  it shows the average absolute distance of each point from the mean.  The greater the value of standard deviation, the further the data tend to be dispersed from the mean.  it is most reliable
  • 9.
    3 Chi square test: Achi-squared test (also chi-square or χ 2 test) is a statistical hypothesis test used in the analysis of contingency tables when the sample sizes are large.
  • 10.
     A chi-squaredtest (symbolically represented as χ2) is basically a data analysis on the basis of observations of a random set of variables. Usually, it is a comparison of two statistical data sets.  This test was introduced by Karl Pearson in 1900 for categorical data analysis and distribution. So it was mentioned as Pearson’s chi- squared test.  The chi-square test is used to estimate how likely the observations that are made would be, by considering the assumption of the null hypothesis as true.
  • 11.
    CHI SQUARE TEATis a non parametric test not based on any assumption or distribution of any variable. This statistical test follows a specific distribution know as chi square distribution. In general the tet we use to measure the differences between what is observed and what is expected according to an assumed hypothesis is called the CHI SQUARE TEST. IMPORTANT CHARECTERISTICS OF CHI SQUARE TEST • This test (as non parametric test) is based on frequencies and not on the parameters like mean and standard deviation. • The test is used for testing the hypothesis and is not useful for estimation. • This test can also be applied to a complex contingency table with servral classes and suchh is a very useful test in research work. • This test is an important npn parametric test as no rigid assumptions are necessary in regarad to the type of population,no need of parameter values and relatively less mathematical details are involved.
  • 12.
    Chi square Distribution: Ifdegree of freedom >2 : Distributionis bell shaped If degree of freddom =2 : Distribution is L shaped with maximum ordinate at zero If degree of freedom <2(>0) : Distribution L shaped with infinite ordinate at the origin.
  • 13.
    Applications of chisquare test: 2 . . . 1 . . . 3 . . . Goodness of fit of distributions Test of independence of attributes Test of homoge nity
  • 14.
    Formula: X2 = ∑ (o- e) 2 e Where , o = observed frequency e = expected frequency if two distributions (observed and theoretical ) are exactly alike, x2 = 0;(but generally due to sampling errors, x2 is not equal to zero) limitations • Data in form of random sample • Contingency tables larger than2 *2, • Sample total less than 50
  • 15.
    T- TEST: • Itis a statistical test • Determine if there is a significant difference between the means of two groups and how they are related. • There are : One sample T- Test Independent T- Test Paired T- Test
  • 16.
    T-test Comparative study ofmeans Mean of group A Mean group B Finds the probability of the differences to have happened by chance Used to compare two samples to determine if they came from the same population.
  • 17.
    T- Test formula: Onesample T- test Two same T- test μ - assumed mean s - standard deviation n - sample size x-- observesd mean of the sample
  • 18.
    ANOVA TEST: Analysis ofVariance • Variability ratio • There are : One way ANOVA Two way ANOVA Three way ANOVA N way ANOVA Mixed model ANOVA Factorial ANOVA ANOVA (Analysis of Variance) Statistical model Used to Determines Assess the differences between means of two independent groups The effect of the independent variable on the dependent variable
  • 19.
    • Analysis ofvariance (ANOVA) is a method for testing the hypothesis that there is no difference between two or more population means. variance between + variance with in = Total variance F = Variability between group Variability within groups