Downloaded 1,811 times

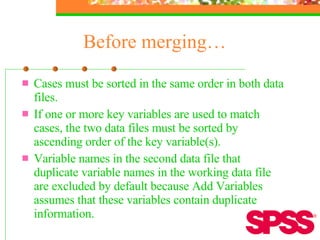
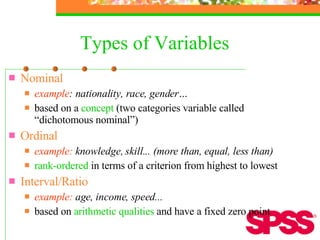
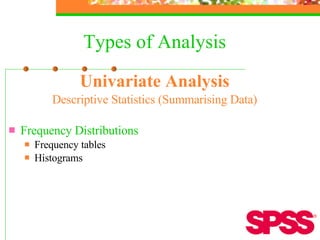

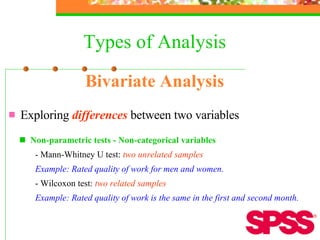
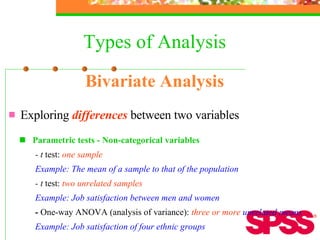
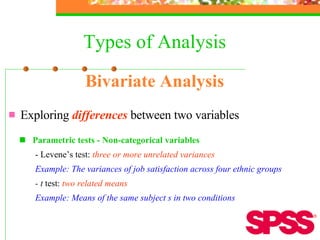
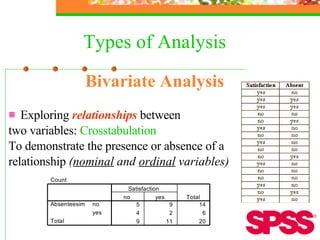


This document provides an overview of quantitative analysis techniques using SPSS, including data manipulation, transformation, and cleaning methods. It also covers univariate, bivariate, and other statistical analysis methods for exploring relationships between variables and differences between groups. Specific techniques discussed include computing new variables, recoding, selecting cases, imputing missing values, aggregating data, sorting, merging files, descriptive statistics, correlations, regressions, t-tests, ANOVA, non-parametric tests, and more.


![Getting Started with Apache Spark: Big Data Made Simple [Free Meetup]](https://cdn.slidesharecdn.com/ss_thumbnails/apachesparkgettingstarted-260203175547-8361bcc3-thumbnail.jpg?width=640&height=640&fit=bounds)


