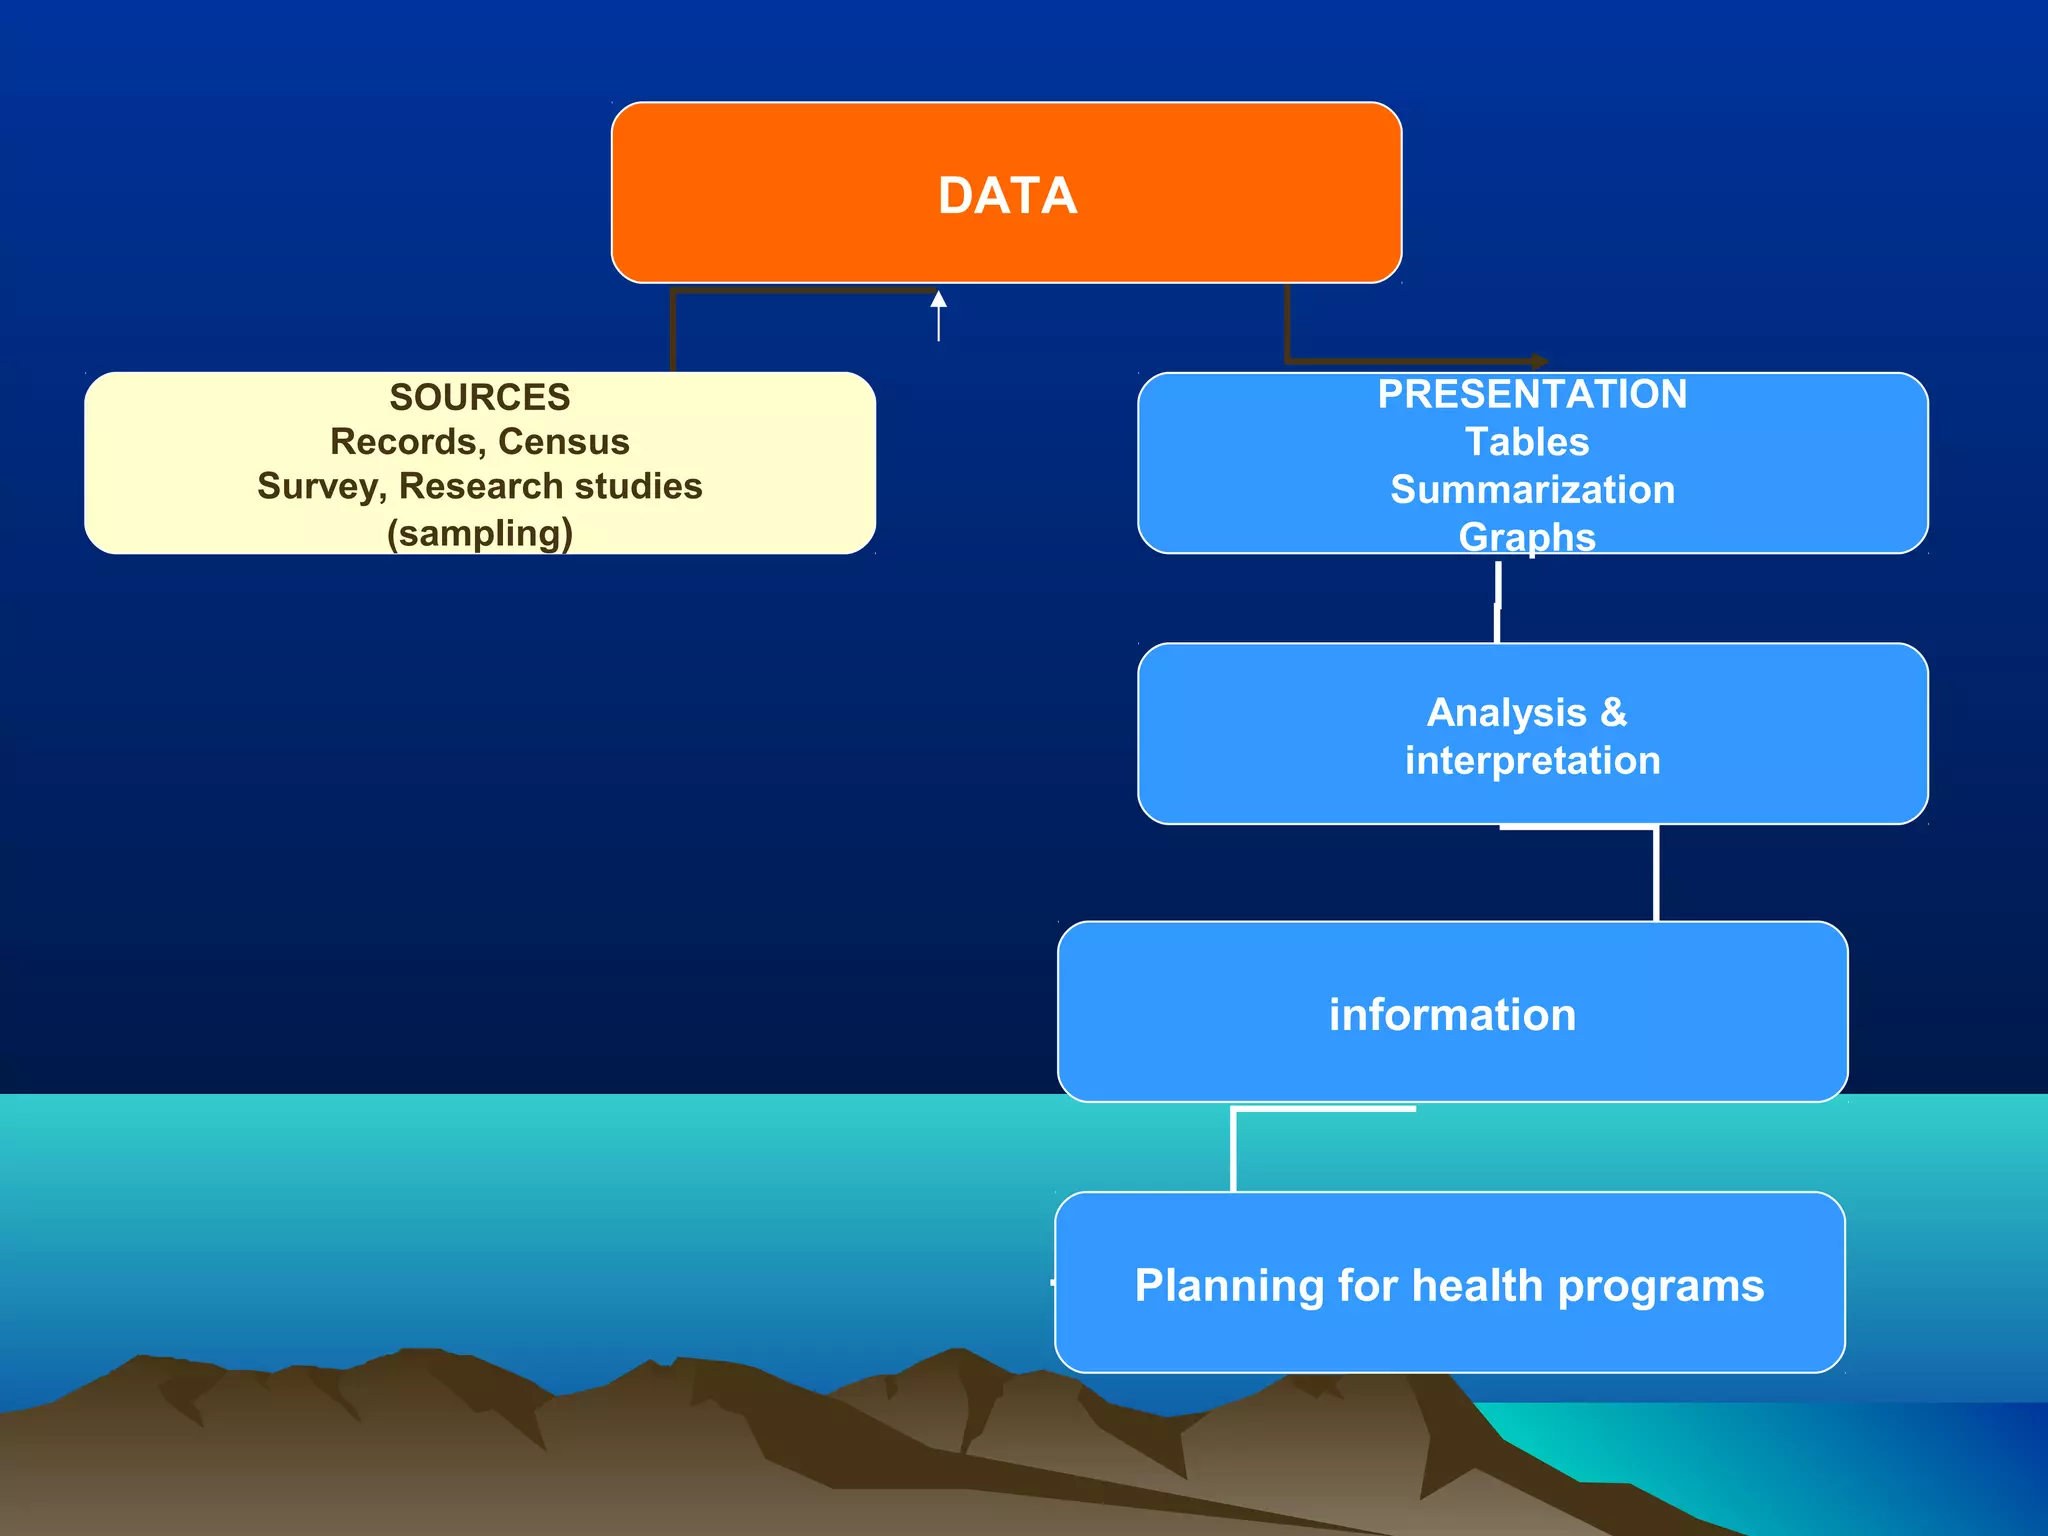
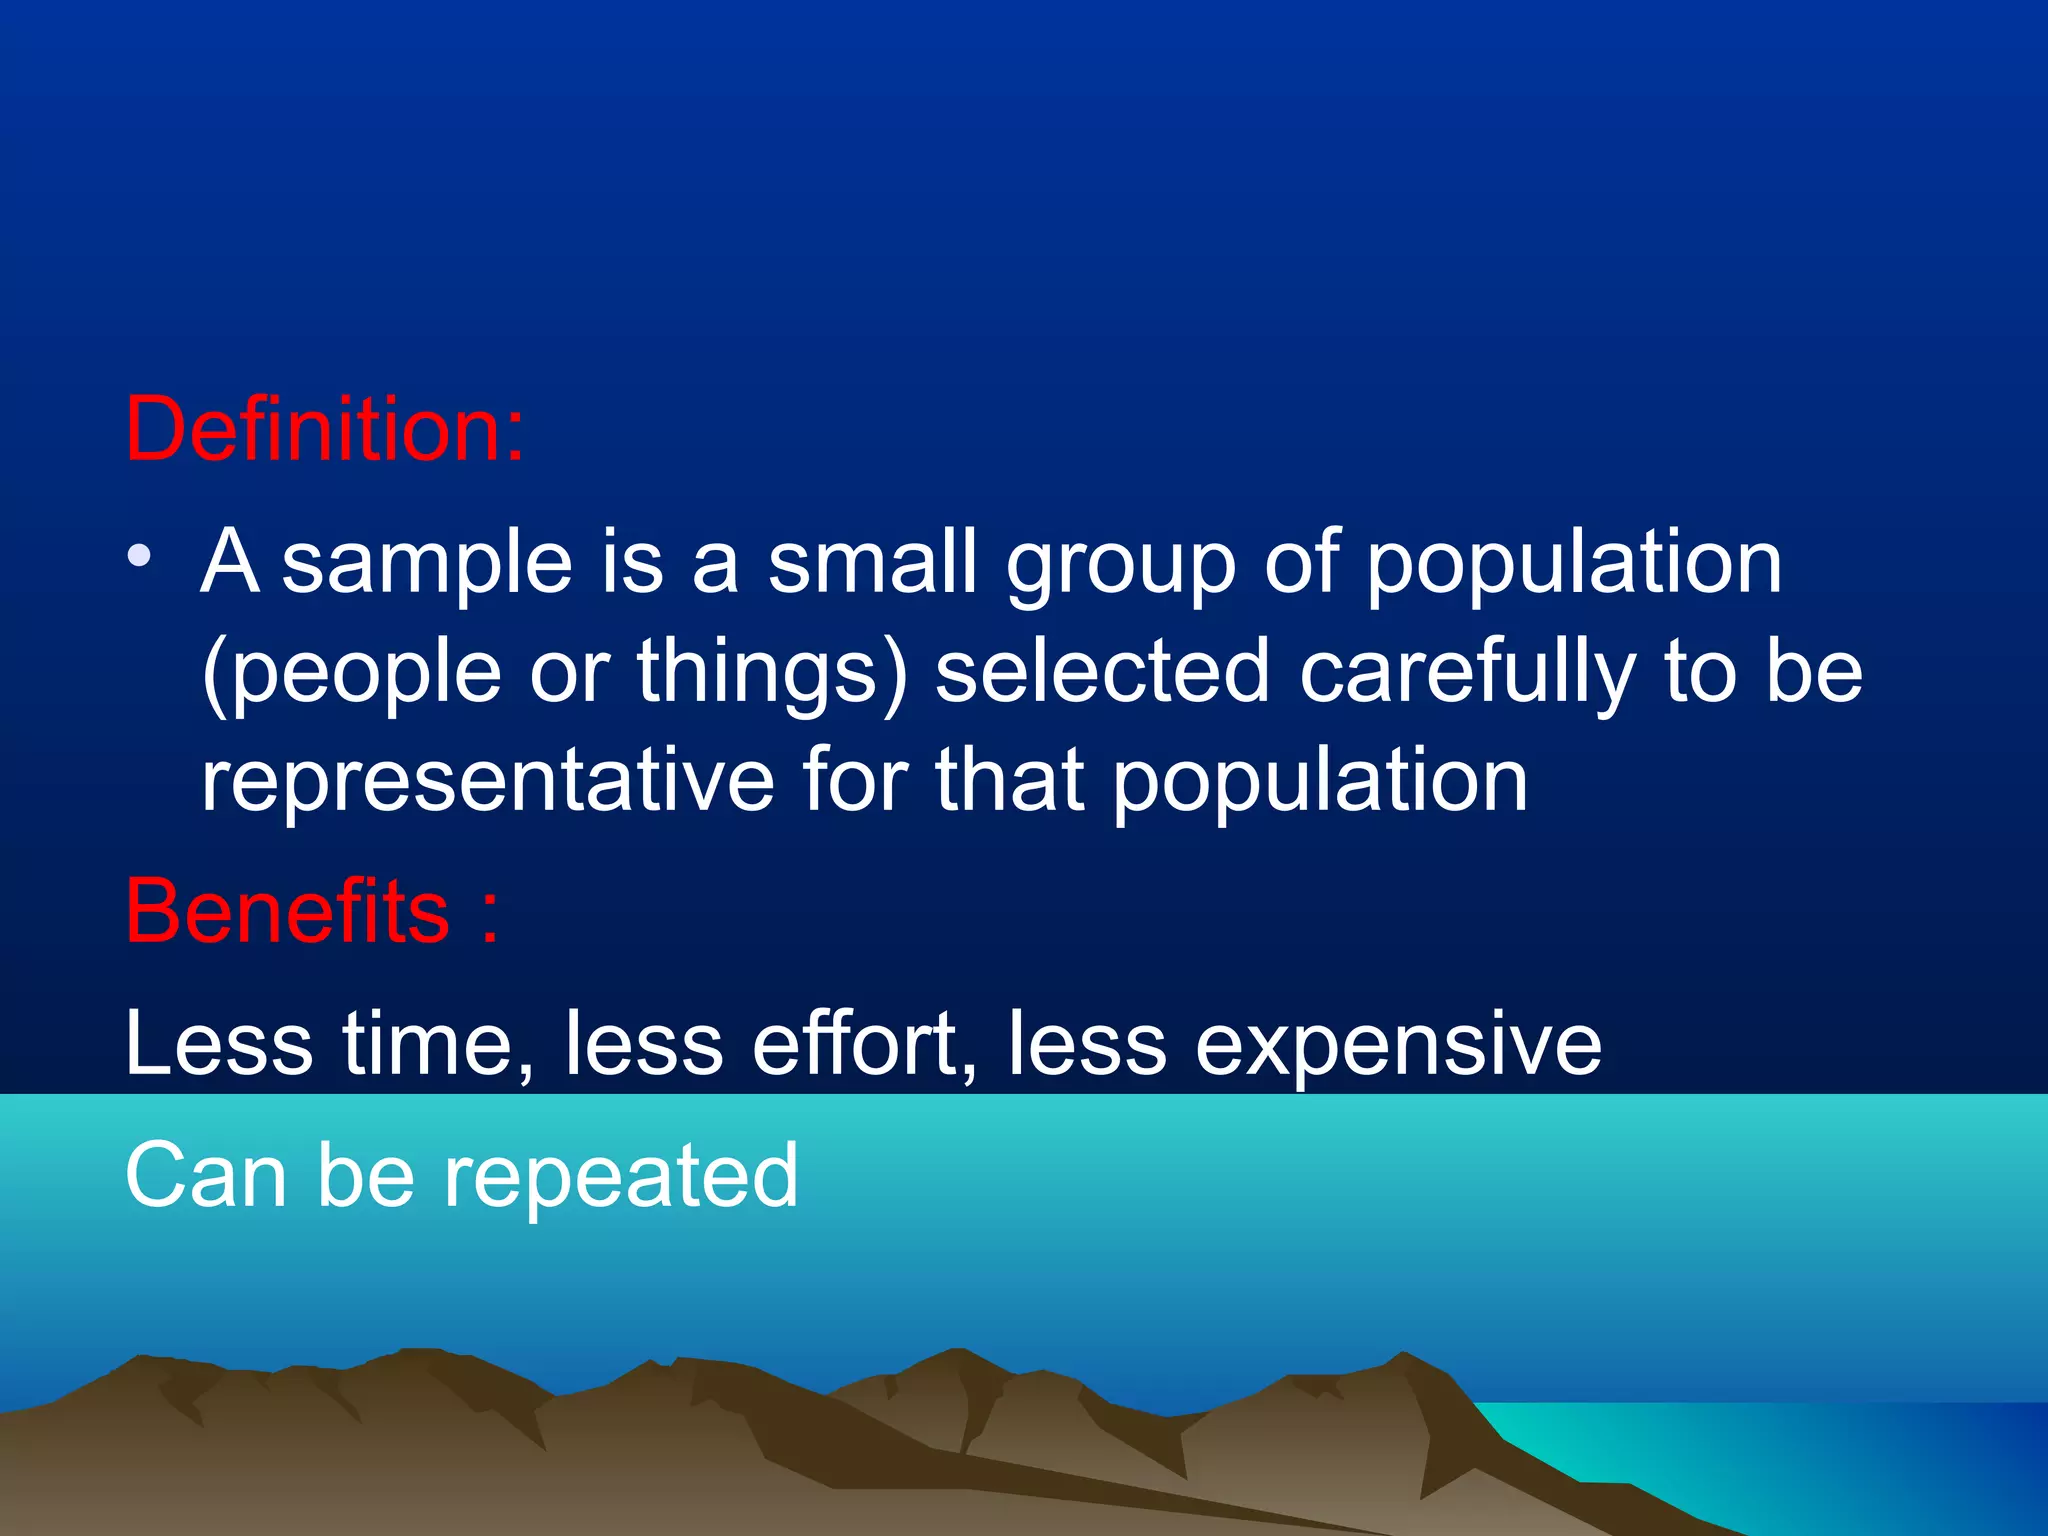
- A sample is a small group selected from a population to represent that population. Sampling provides benefits like being less time-consuming, less expensive, and allowing results to be repeated.
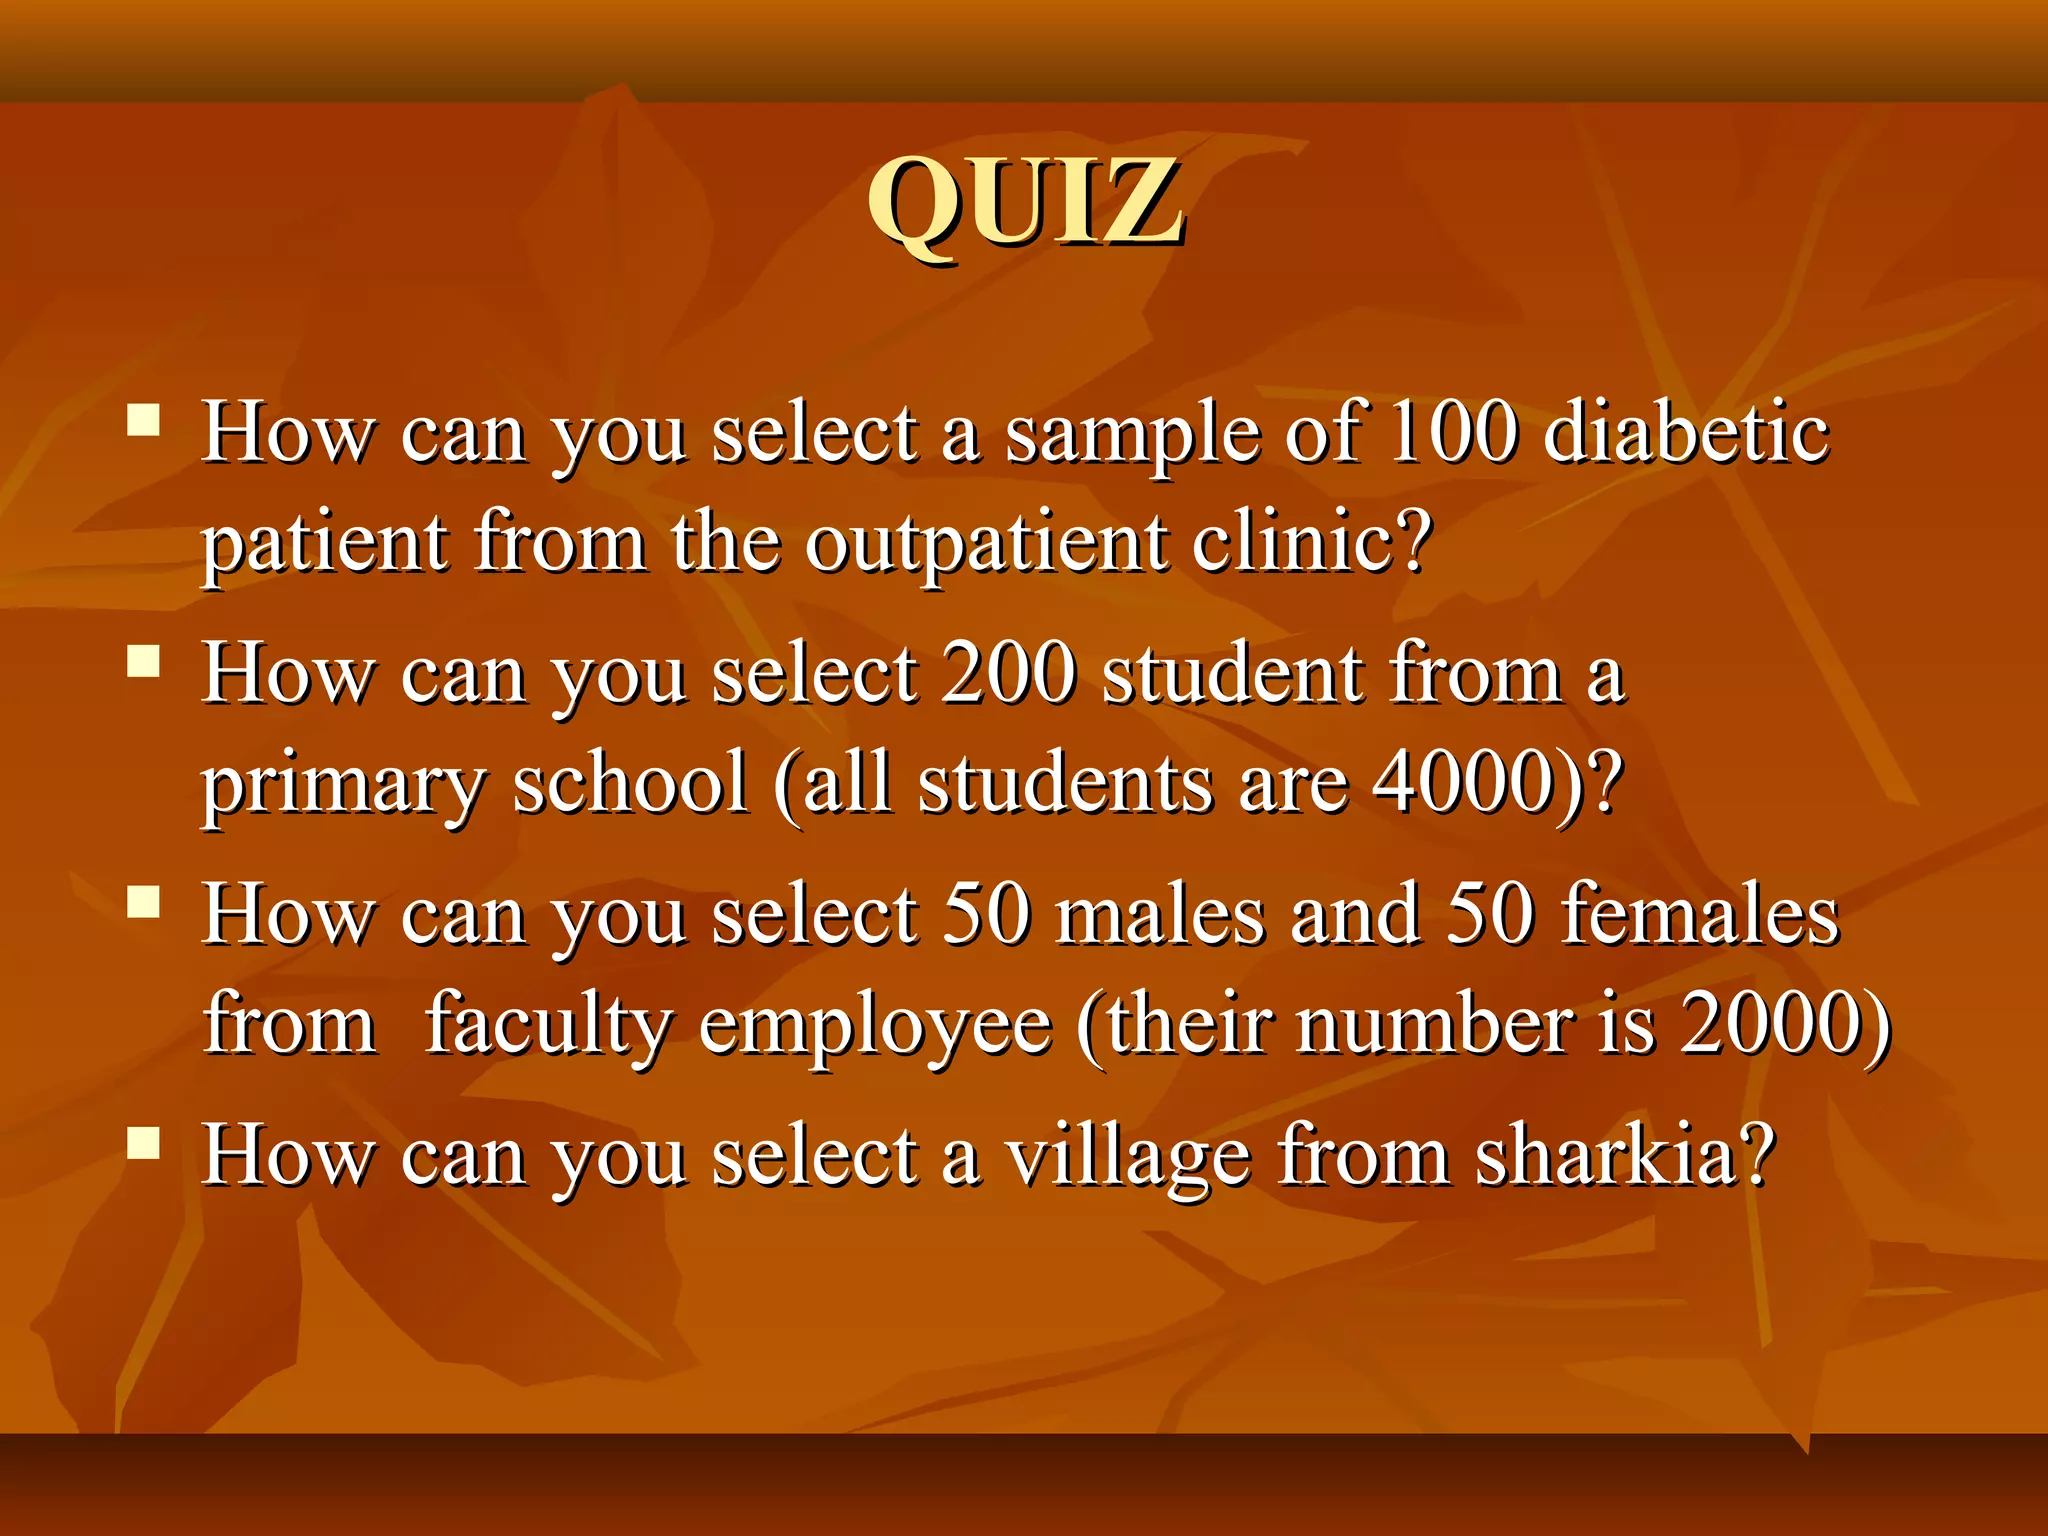
- There are two main types of samples: probability and non-probability. Probability samples include simple random, systematic, stratified, and cluster samples. Sample size is determined based on factors like the type of study, expected results, costs, and available resources.
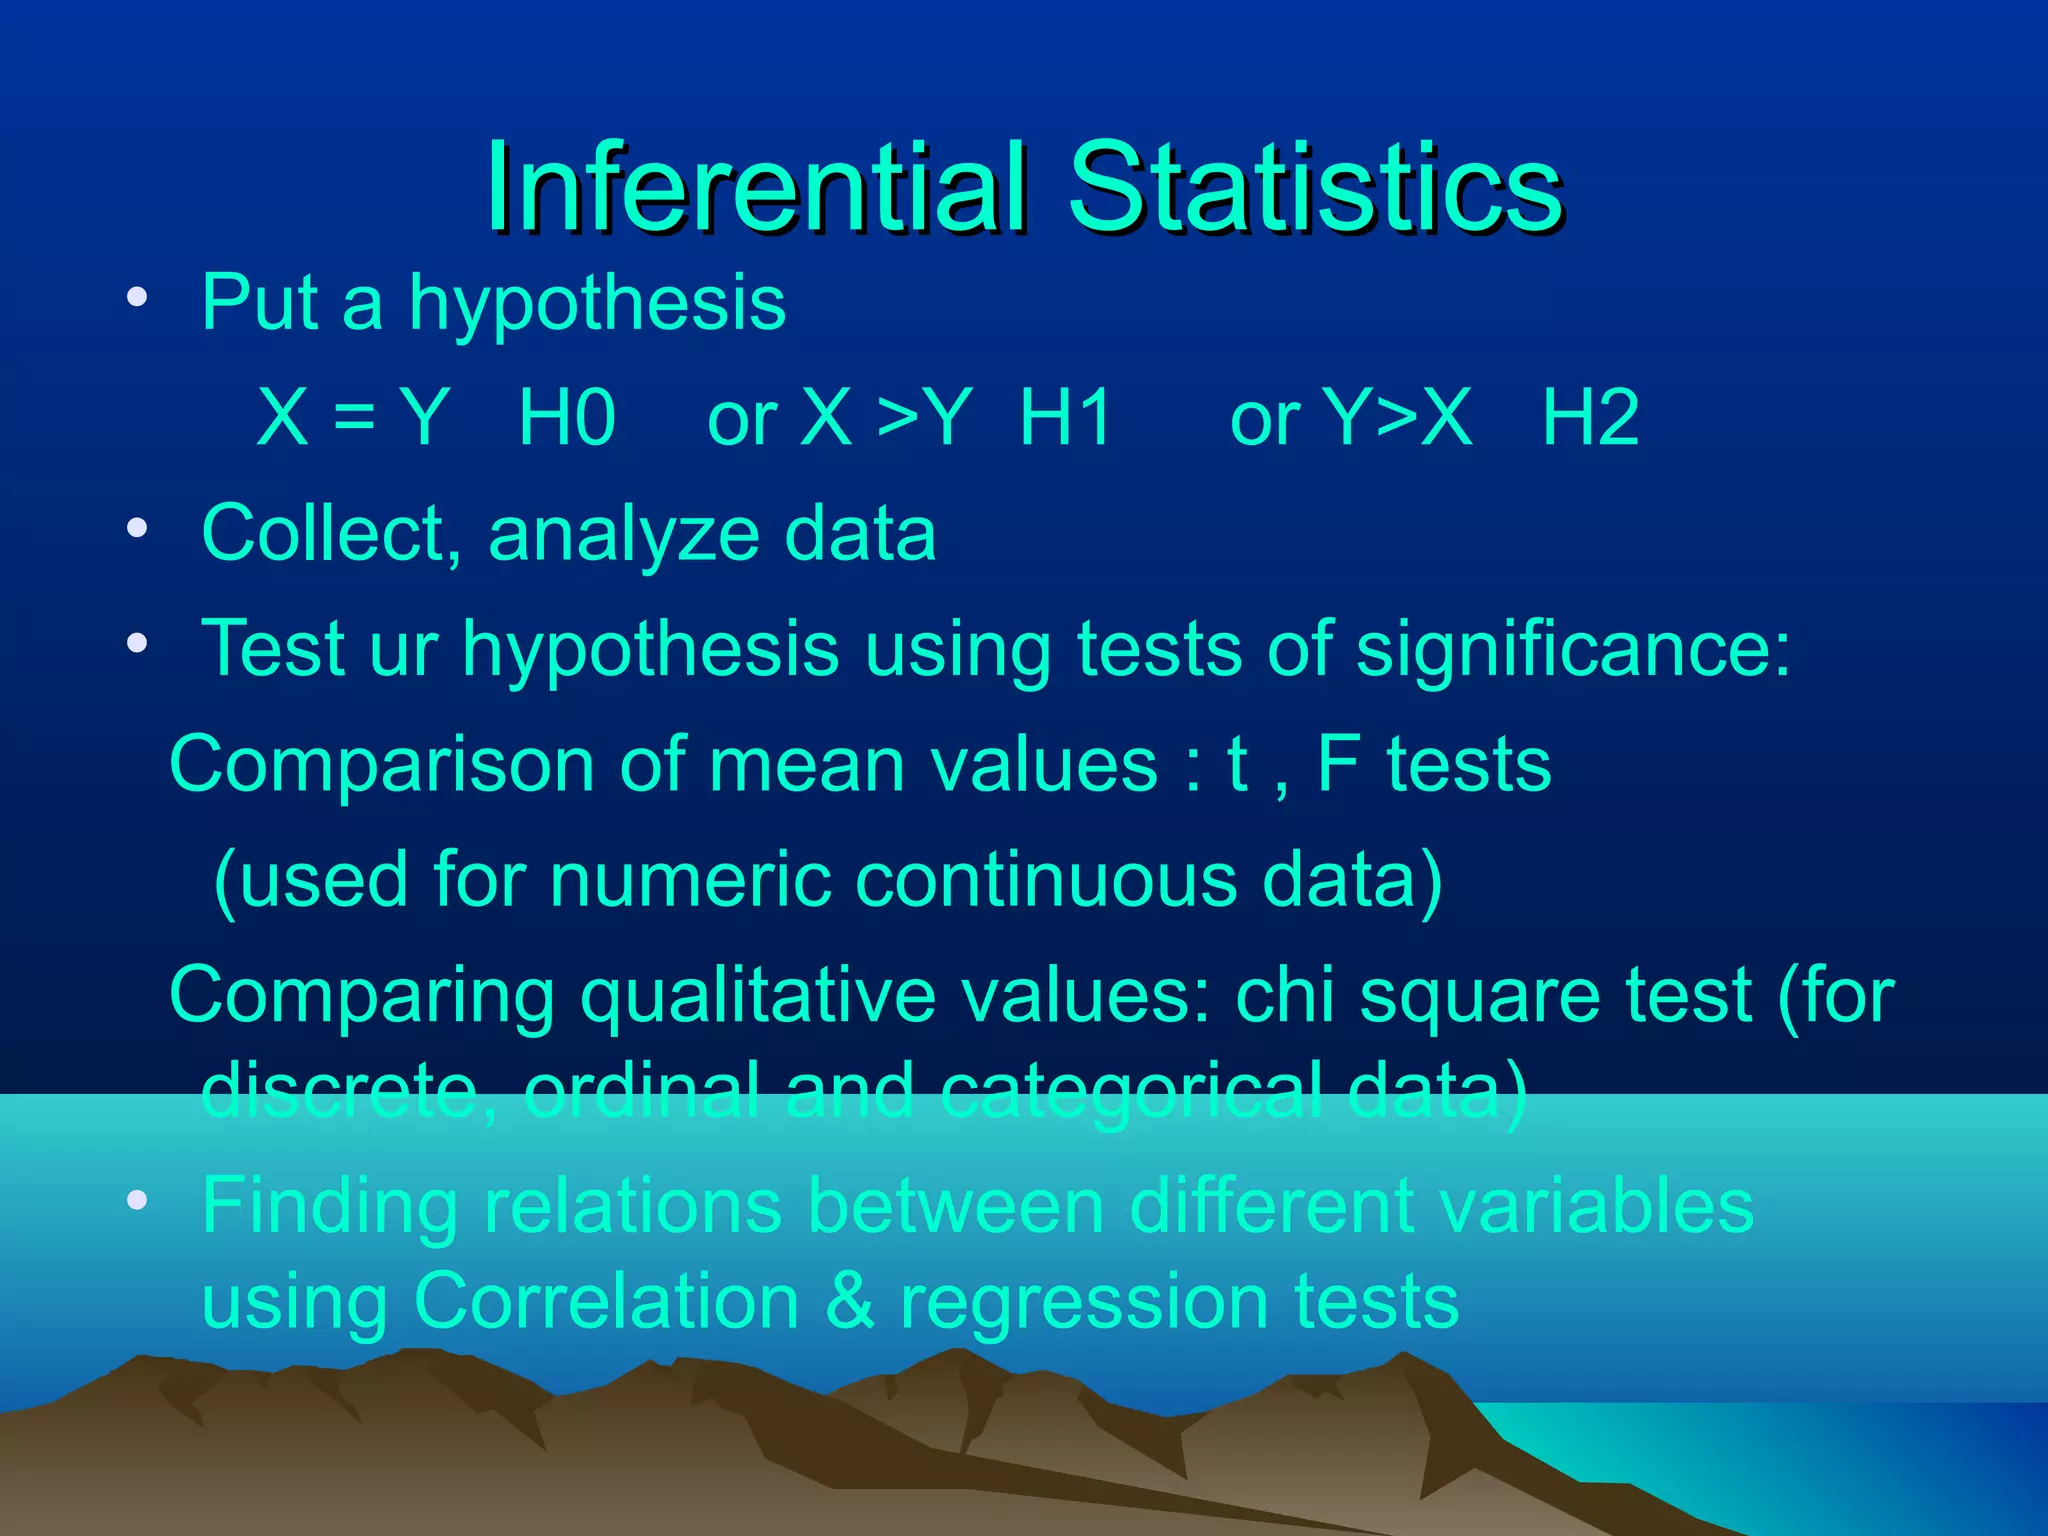
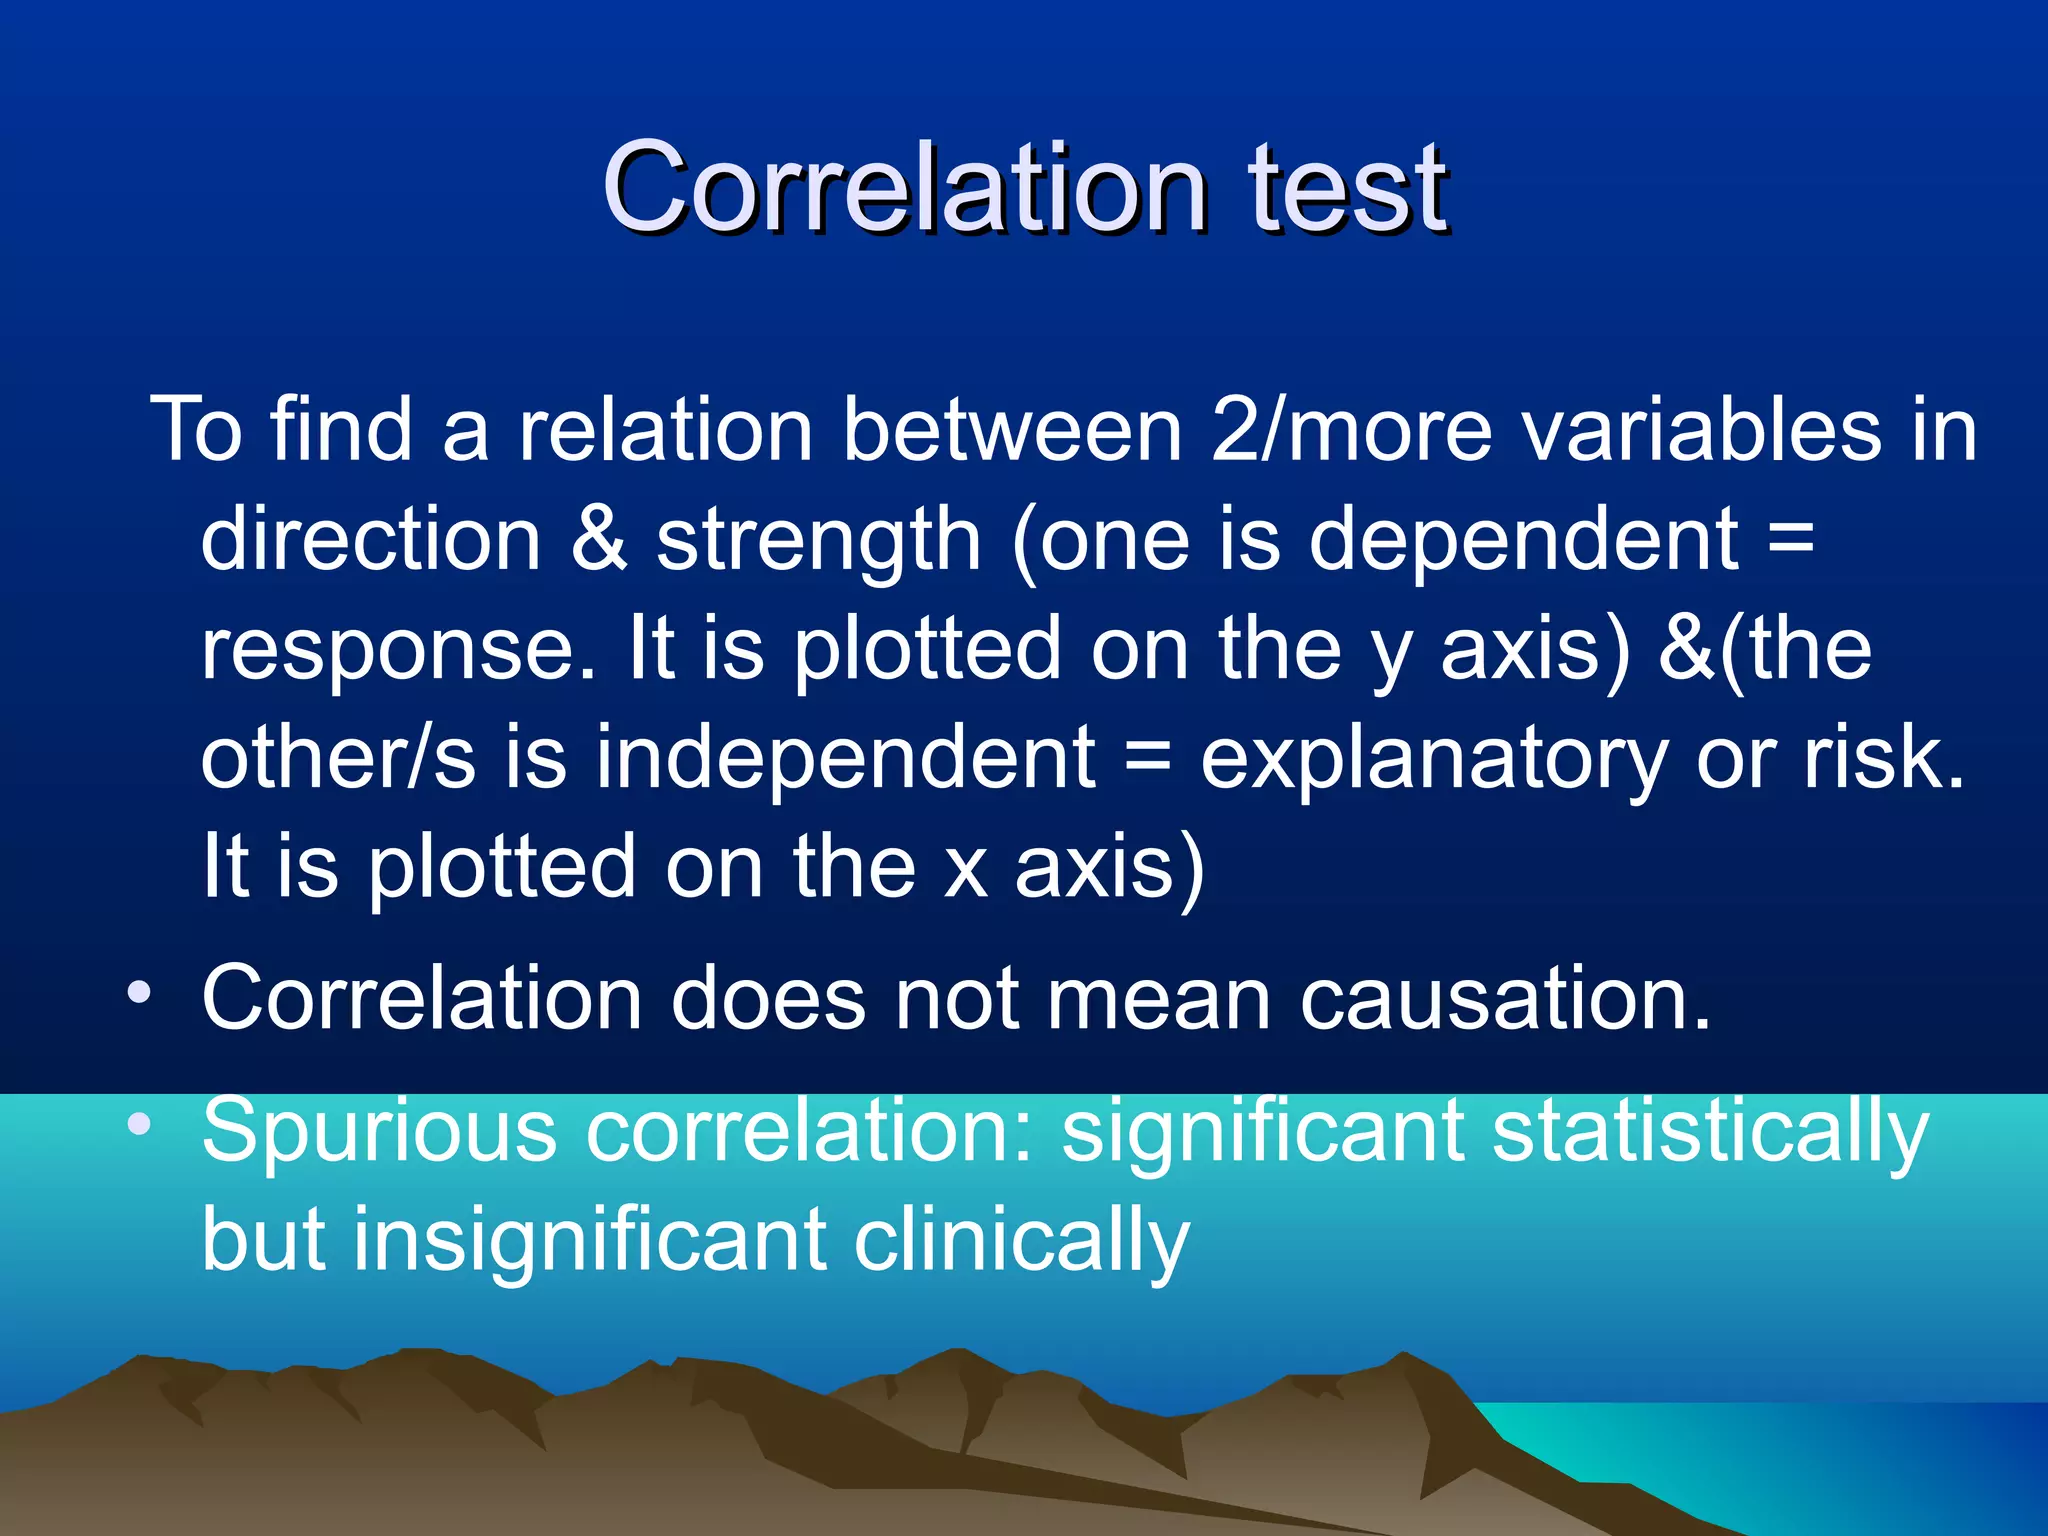
- Inferential statistics allow generalization from a sample to a population through hypothesis testing and significance tests. Tests include t-tests, F-tests, chi-squared tests, and correlation/regression to analyze relationships between variables. Significant results suggest differences are likely not due to chance


![Medical statistics Basic concept and applications [Square one]](https://cdn.slidesharecdn.com/ss_thumbnails/medicalstatisticsl123m-131208222631-phpapp02-thumbnail.jpg?width=640&height=640&fit=bounds)


