Downloaded 764 times
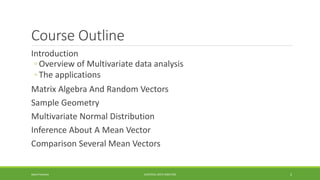


This document outlines a course on multivariate data analysis. It introduces key topics that will be covered, including matrix algebra, the multivariate normal distribution, principal component analysis, factor analysis, cluster analysis, discriminant analysis, and canonical correlations. The course workload consists of 40% theory and 60% practice, including a group project and weekly presentations. R will be the main software used. Examples of multivariate data and applications in various fields like business, health, and education are also provided.