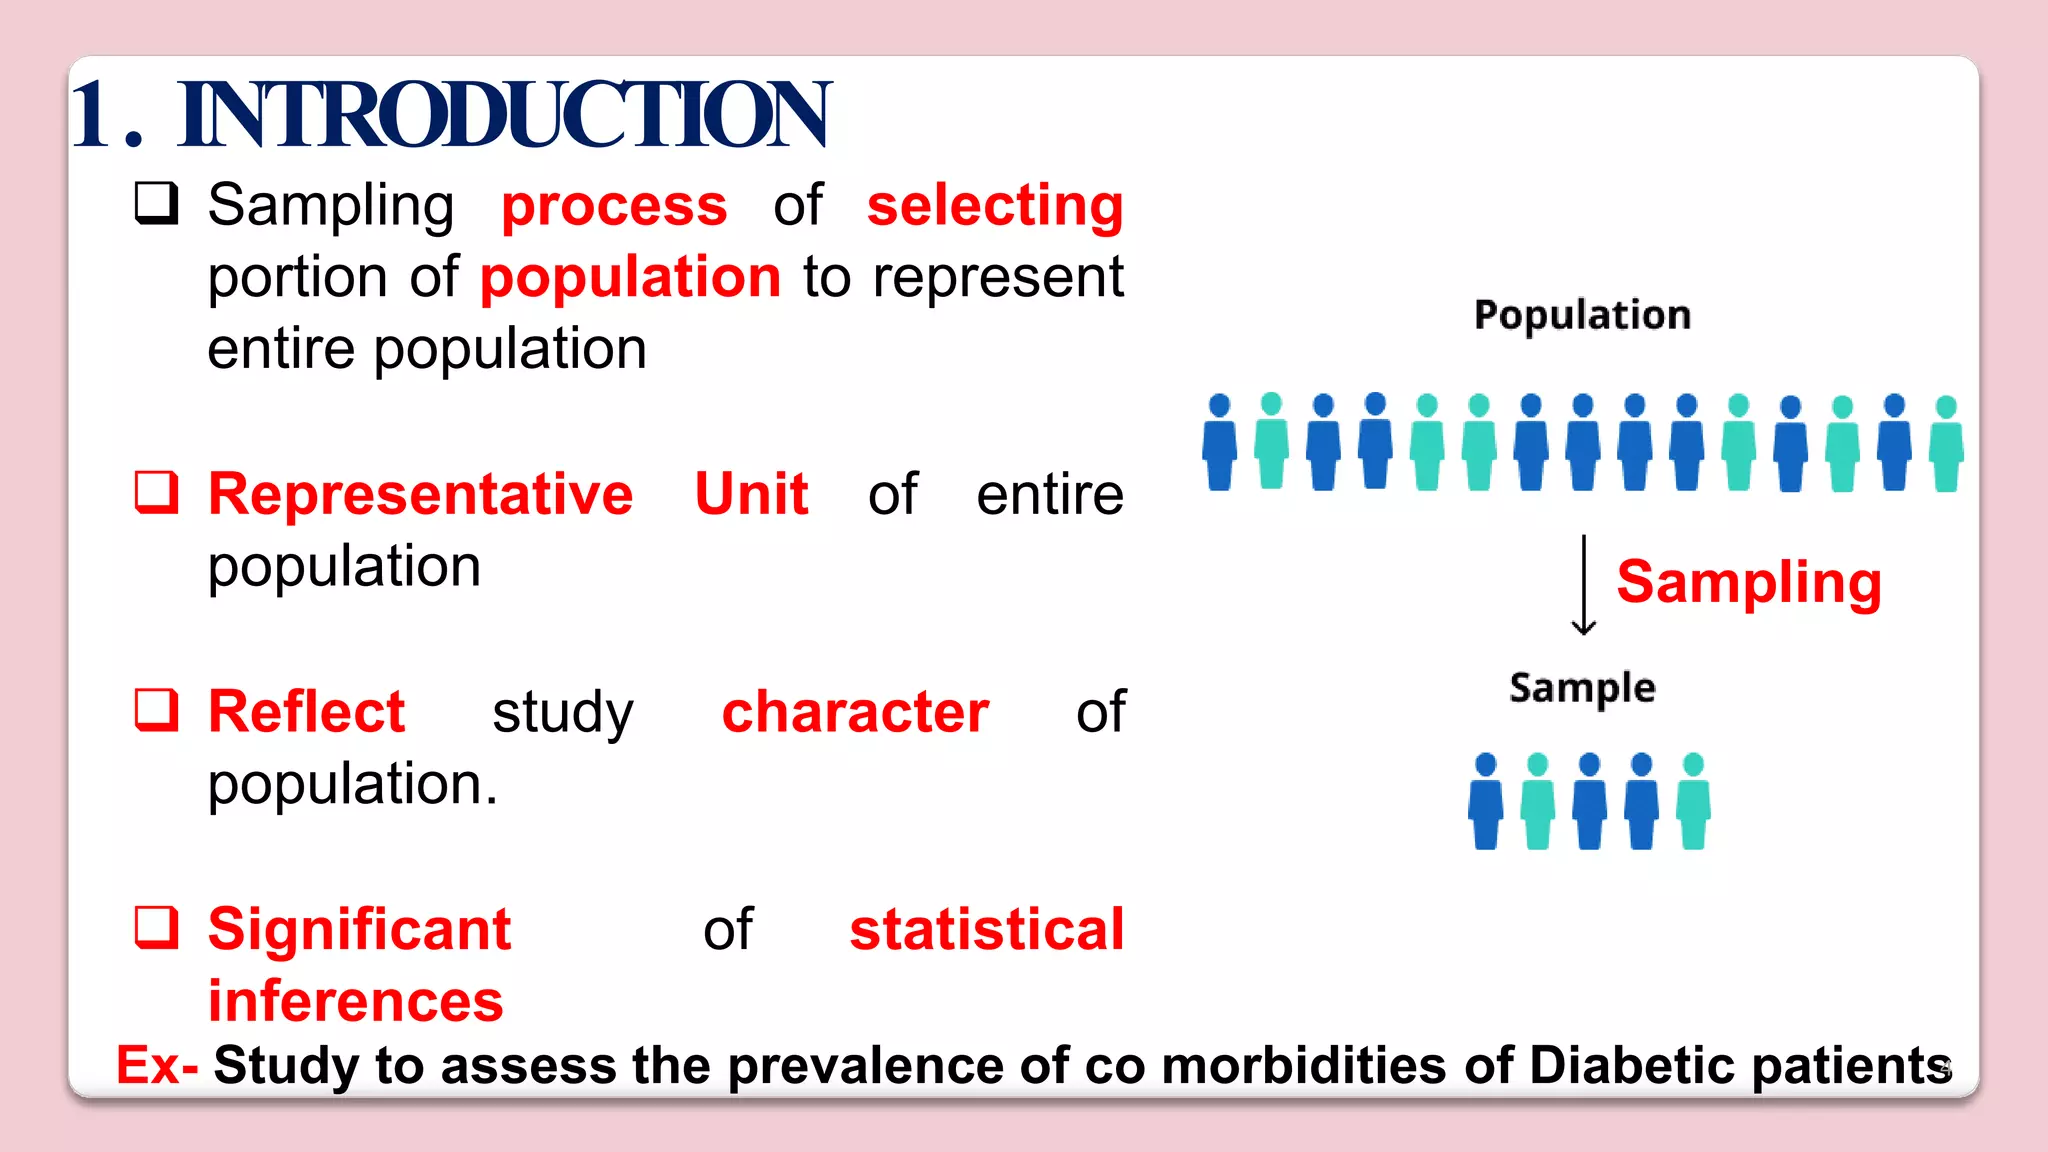
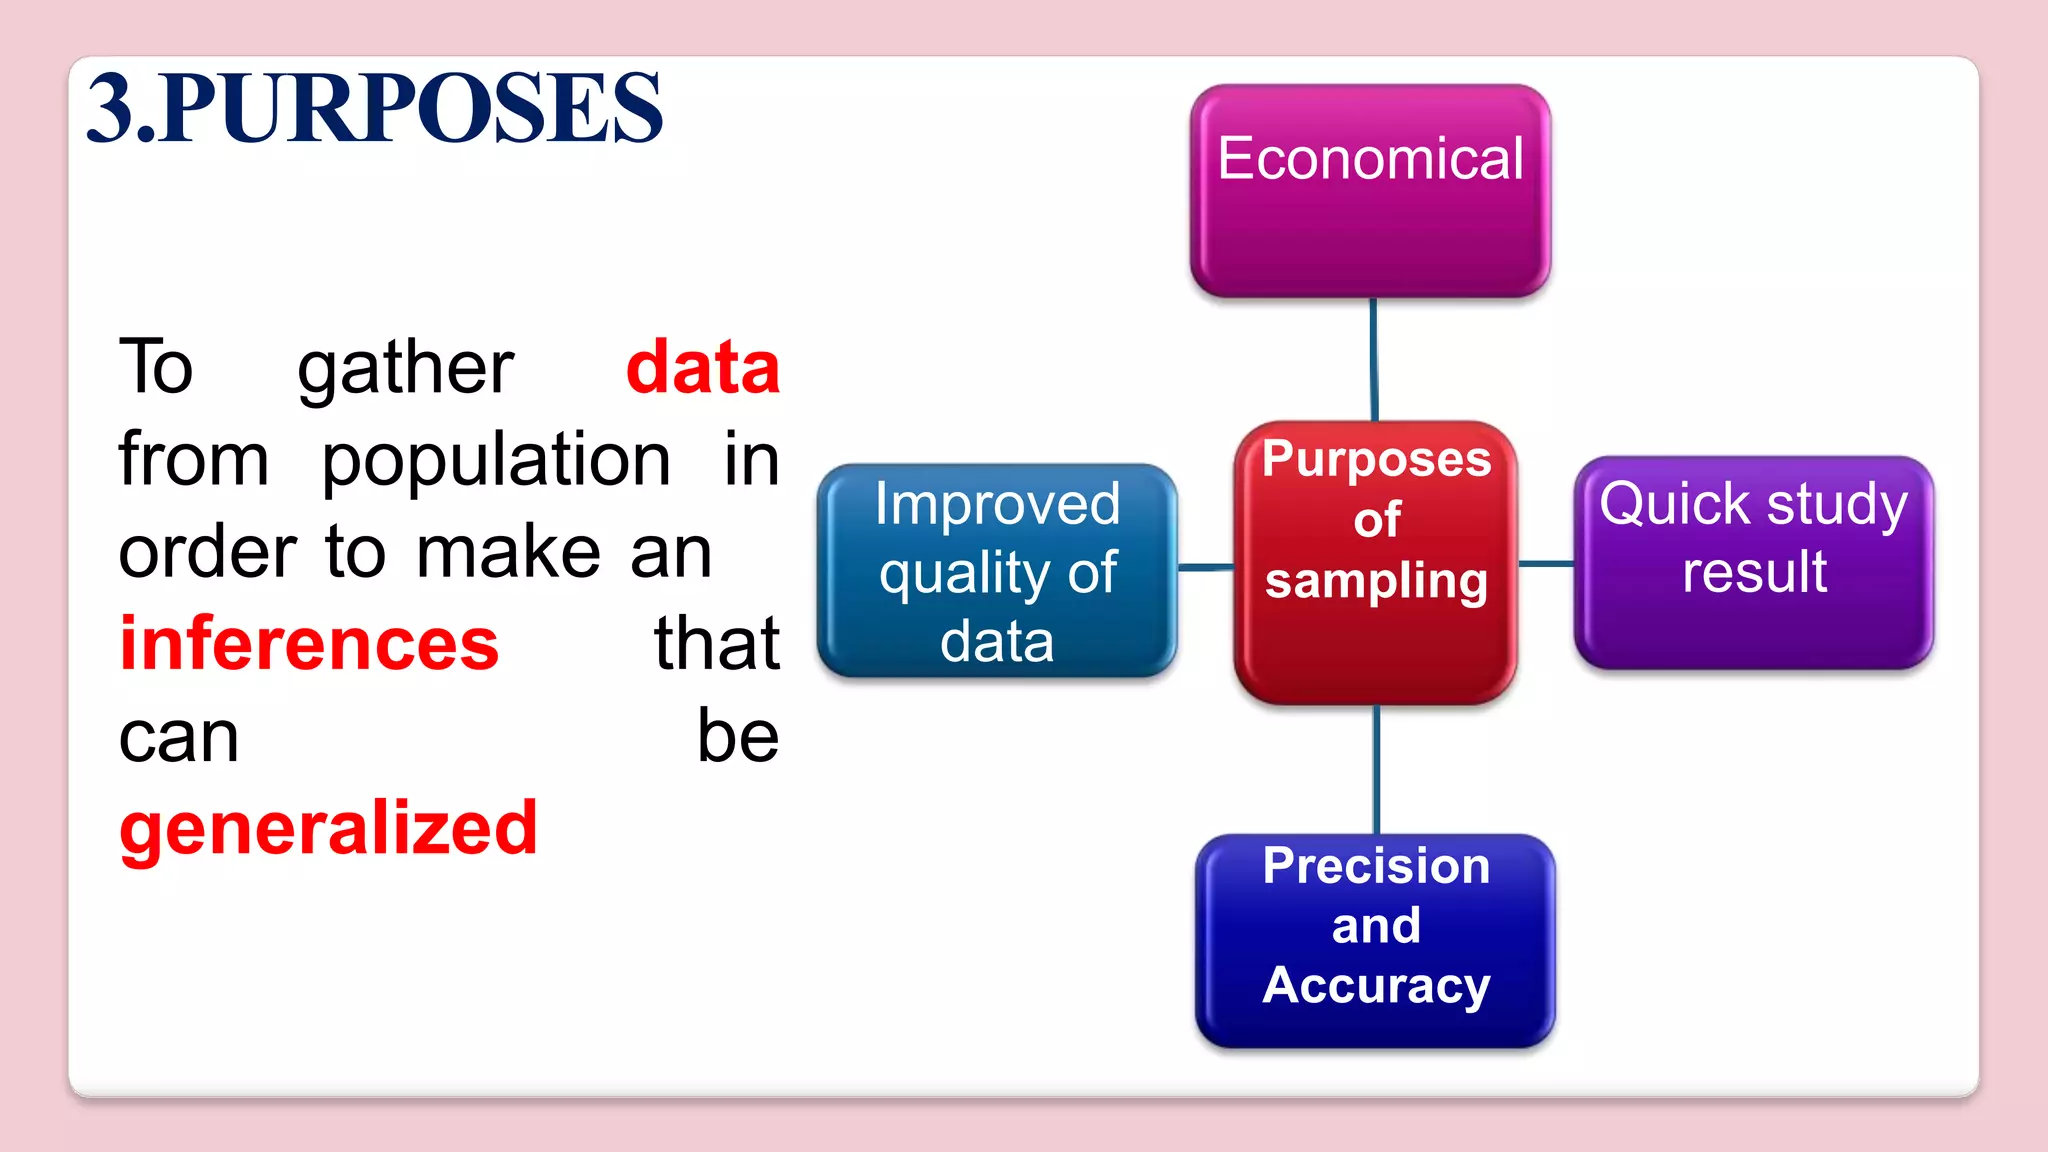
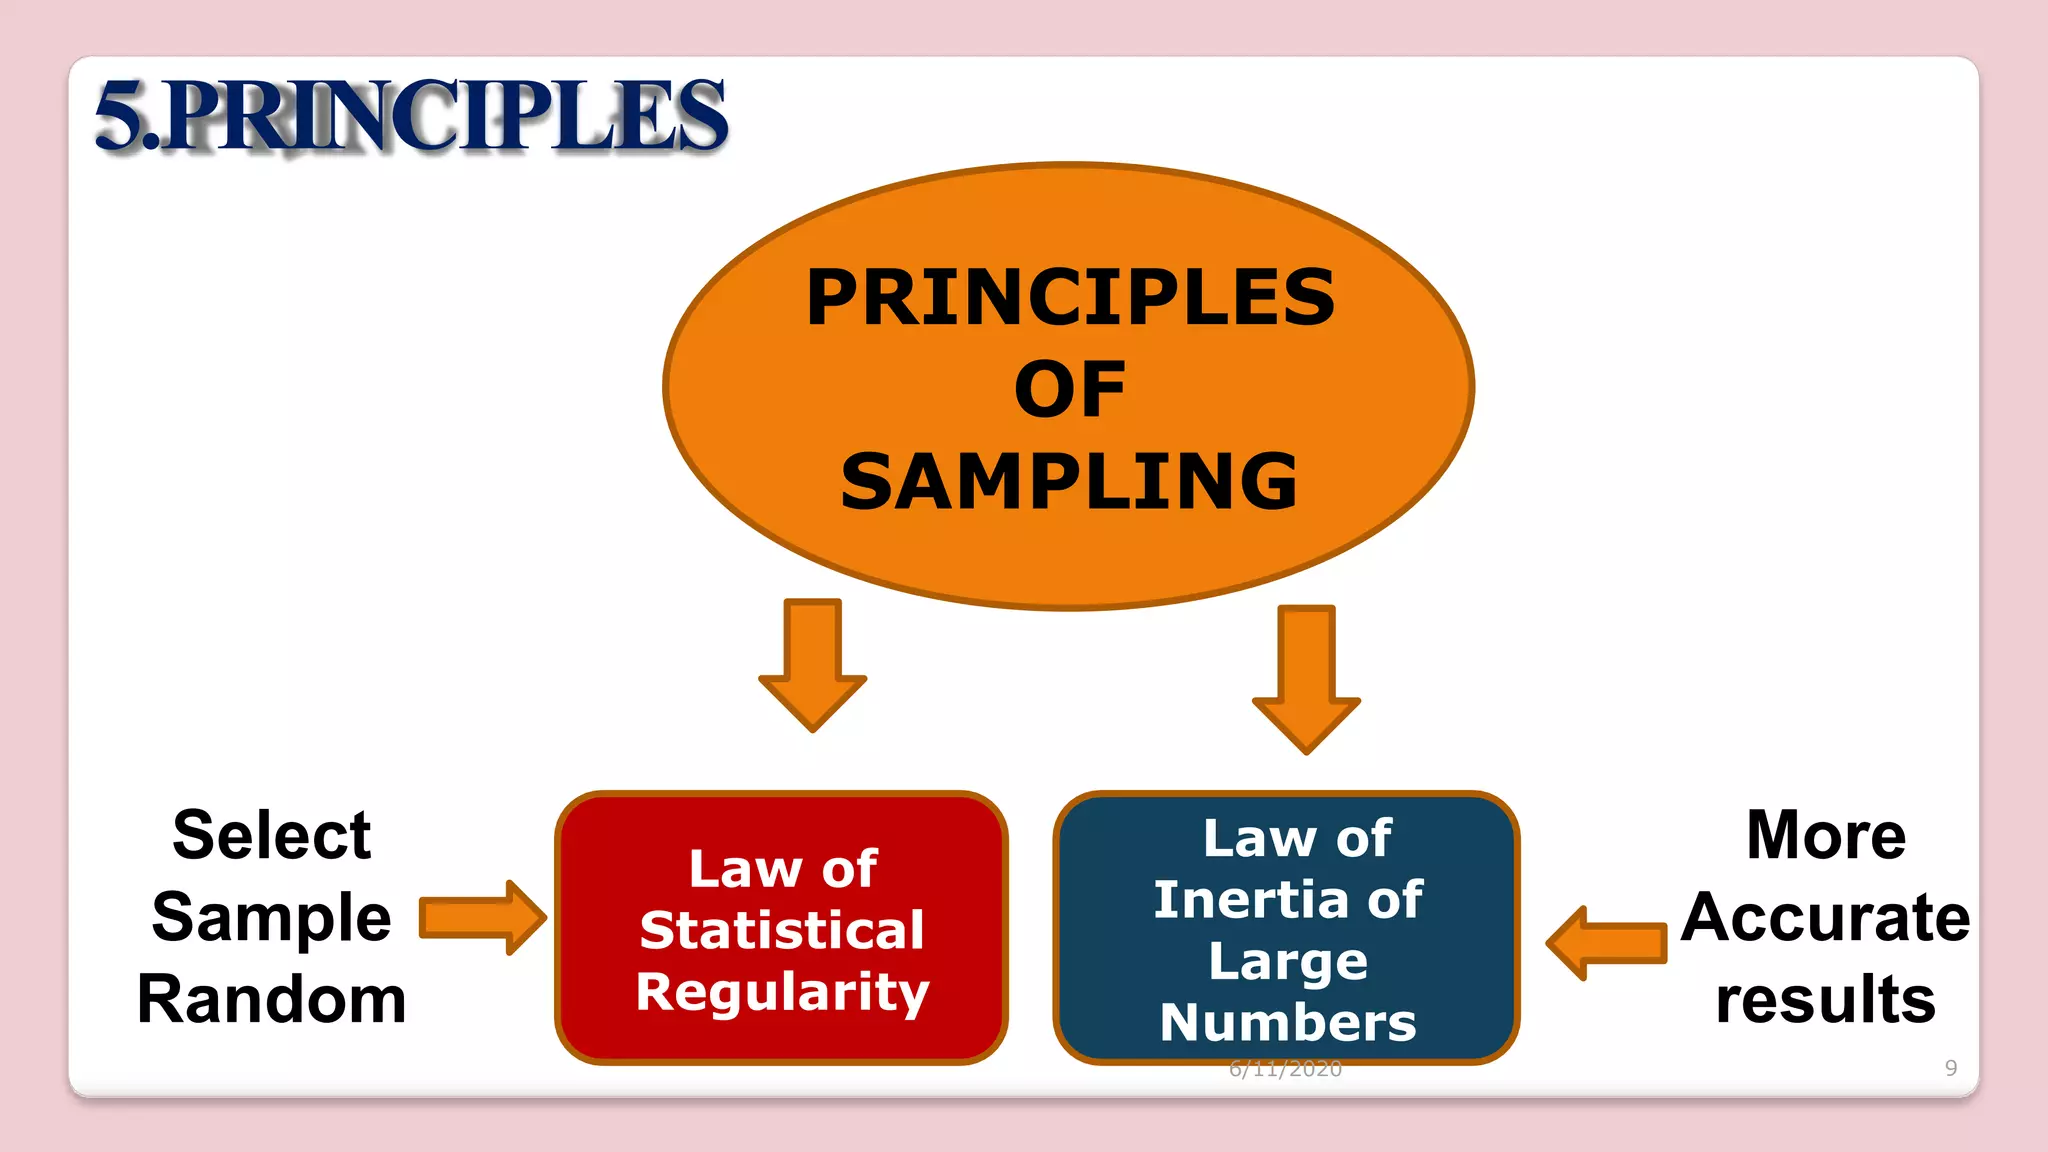
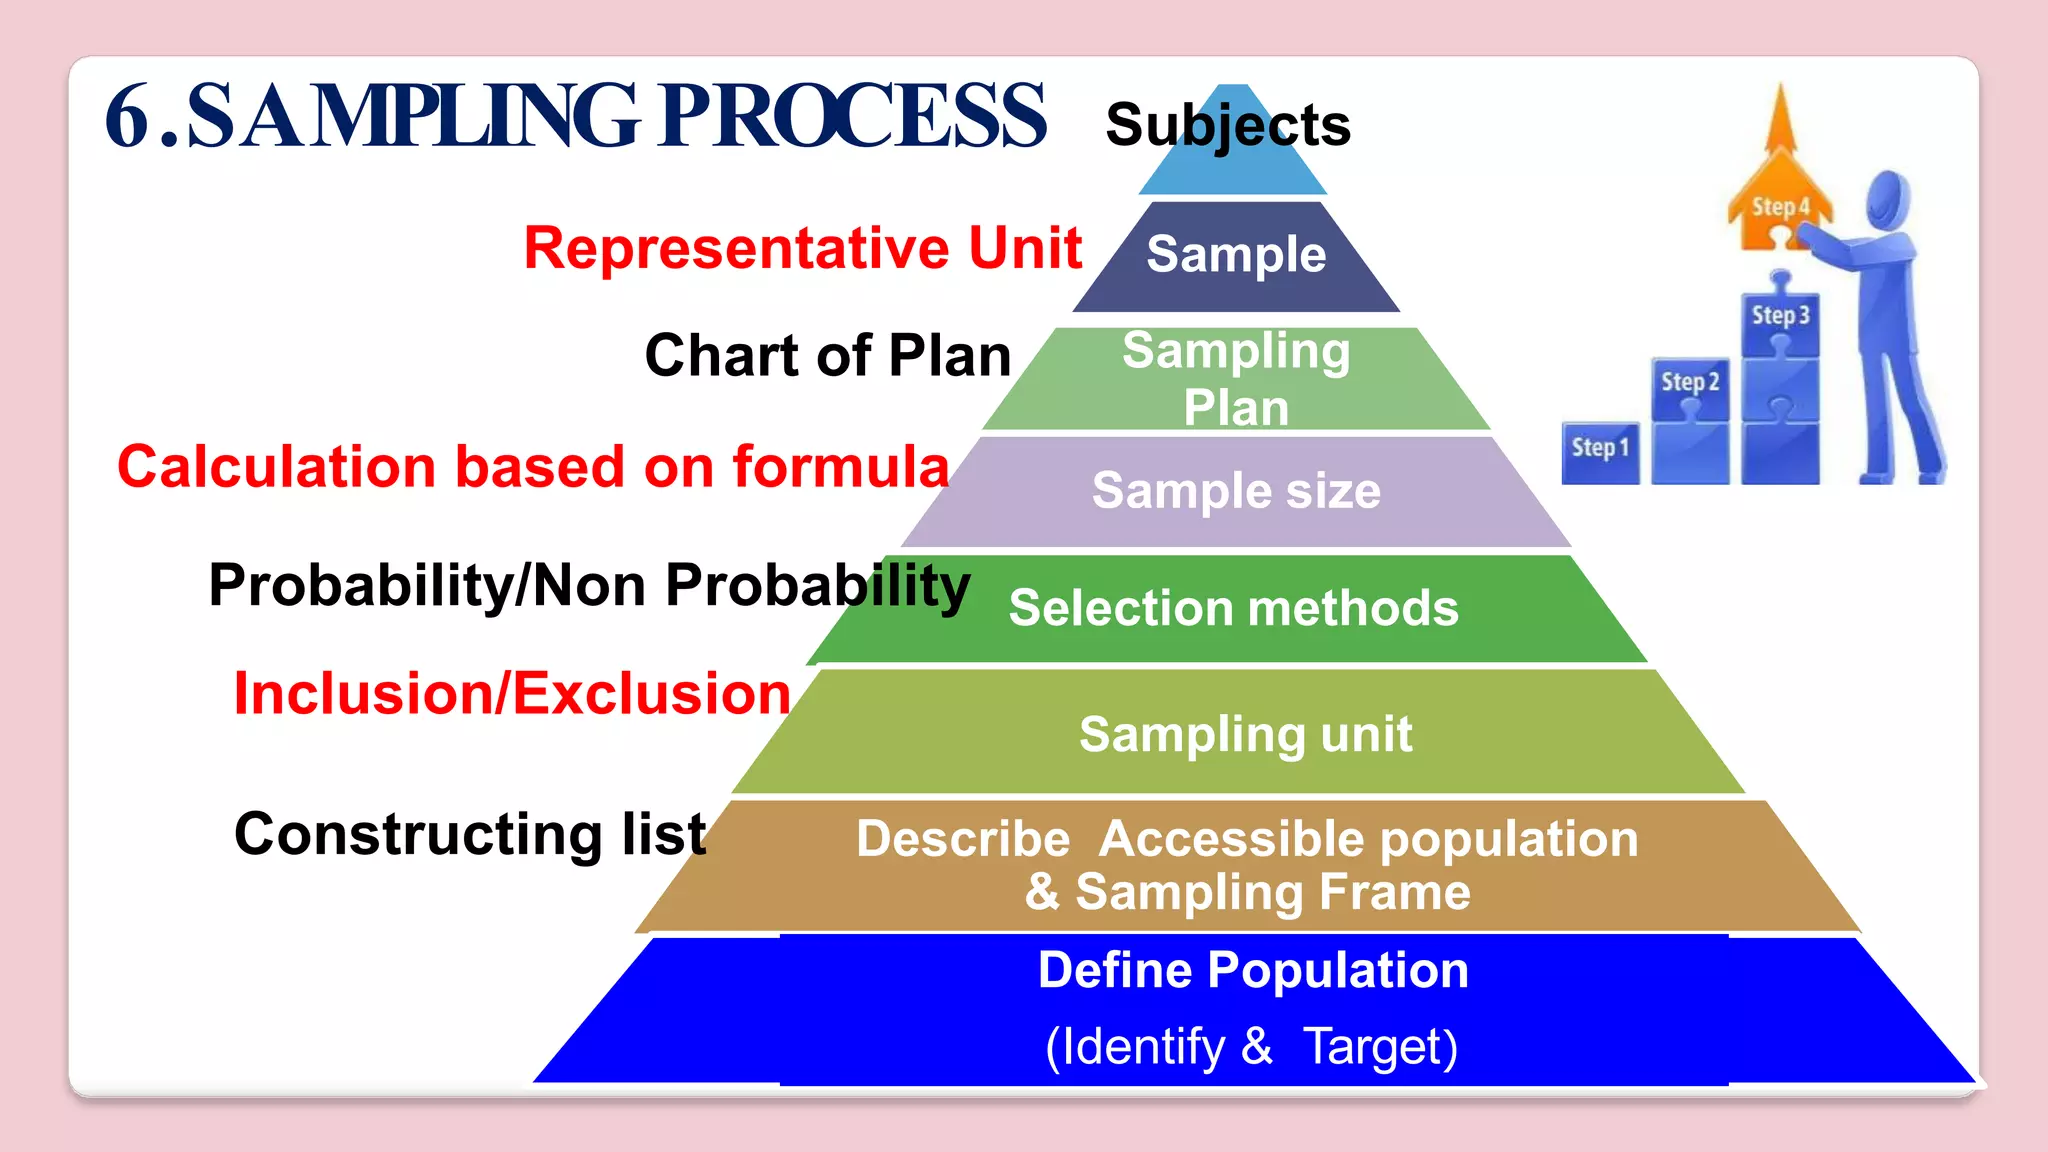
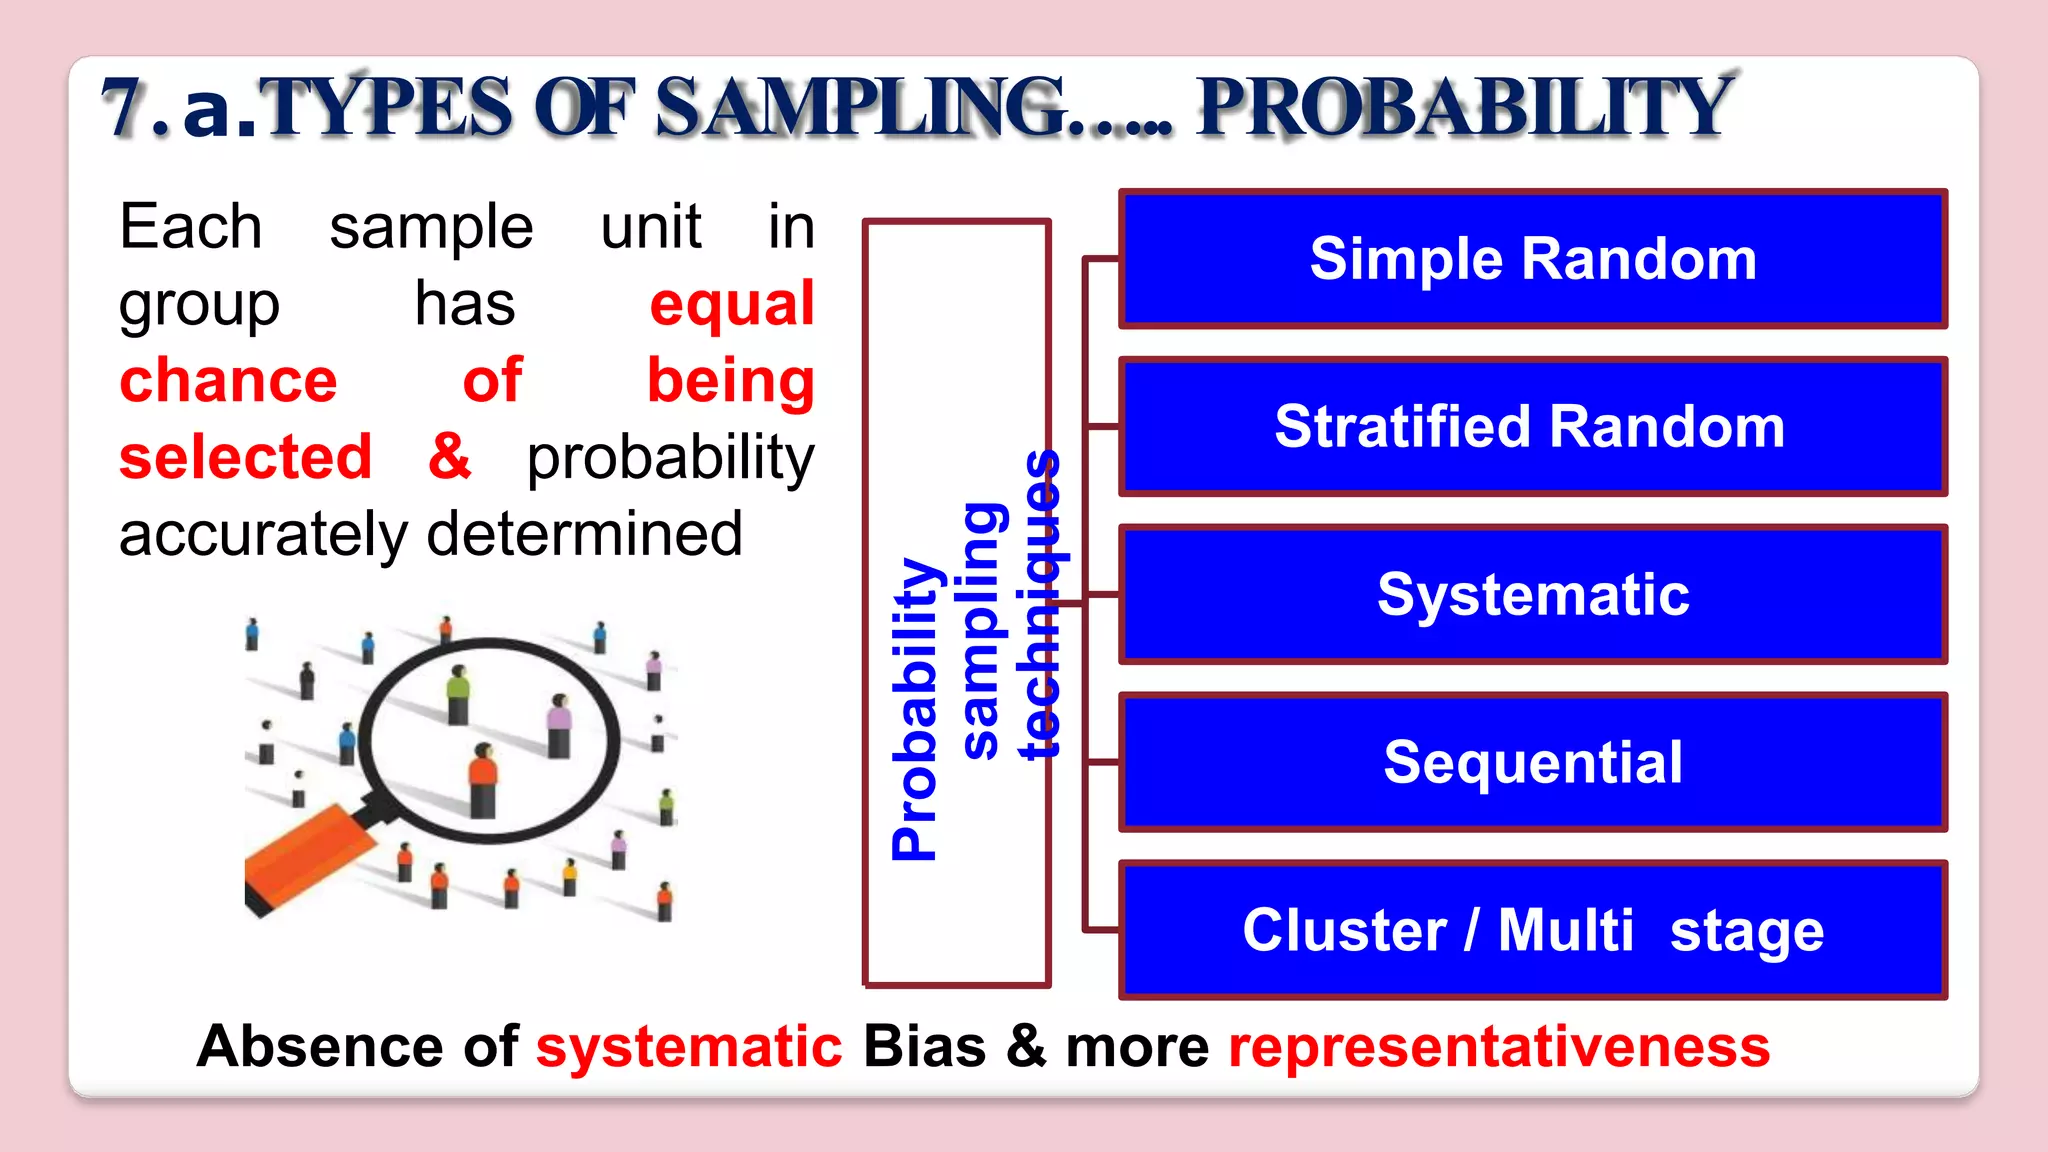
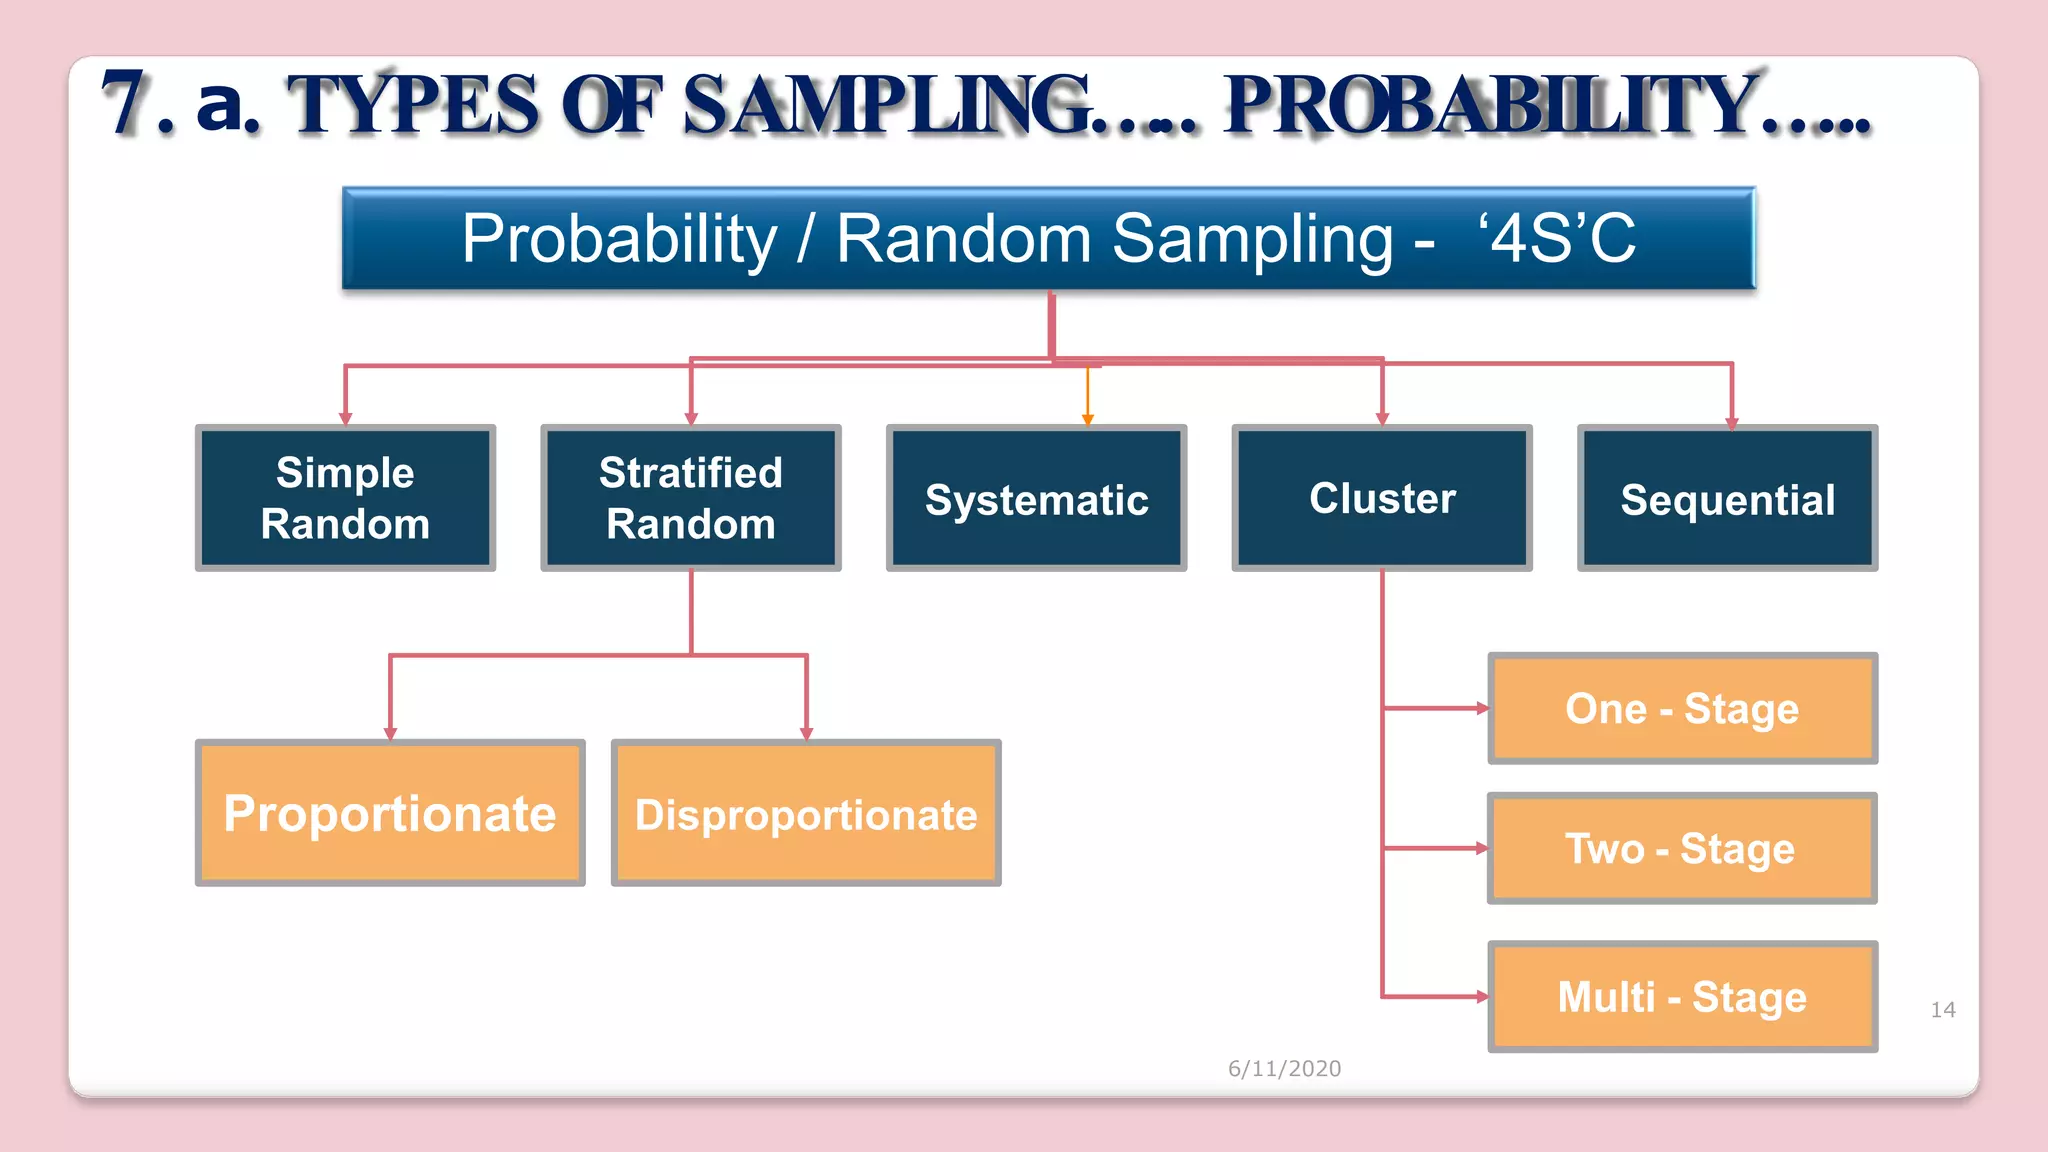
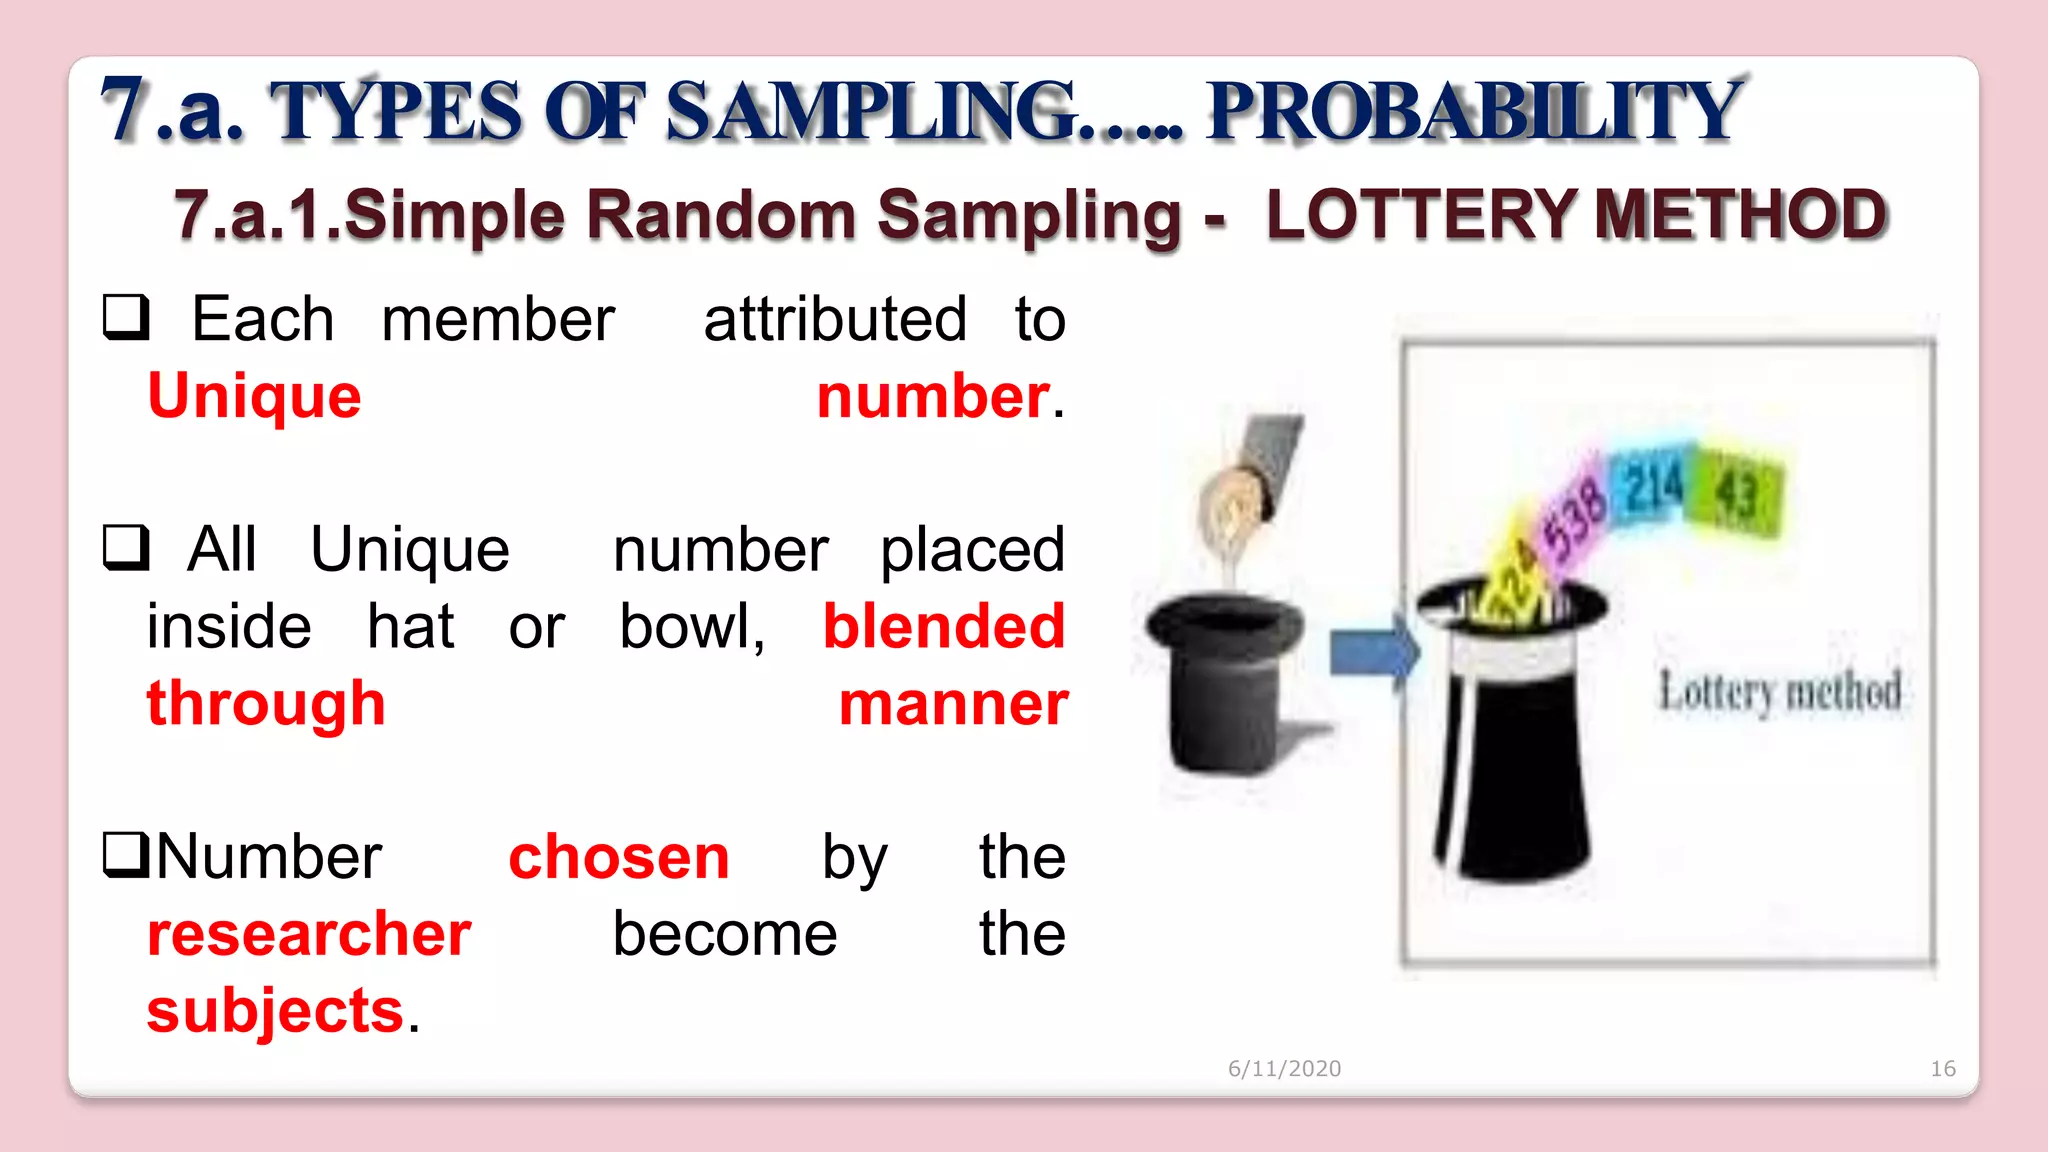
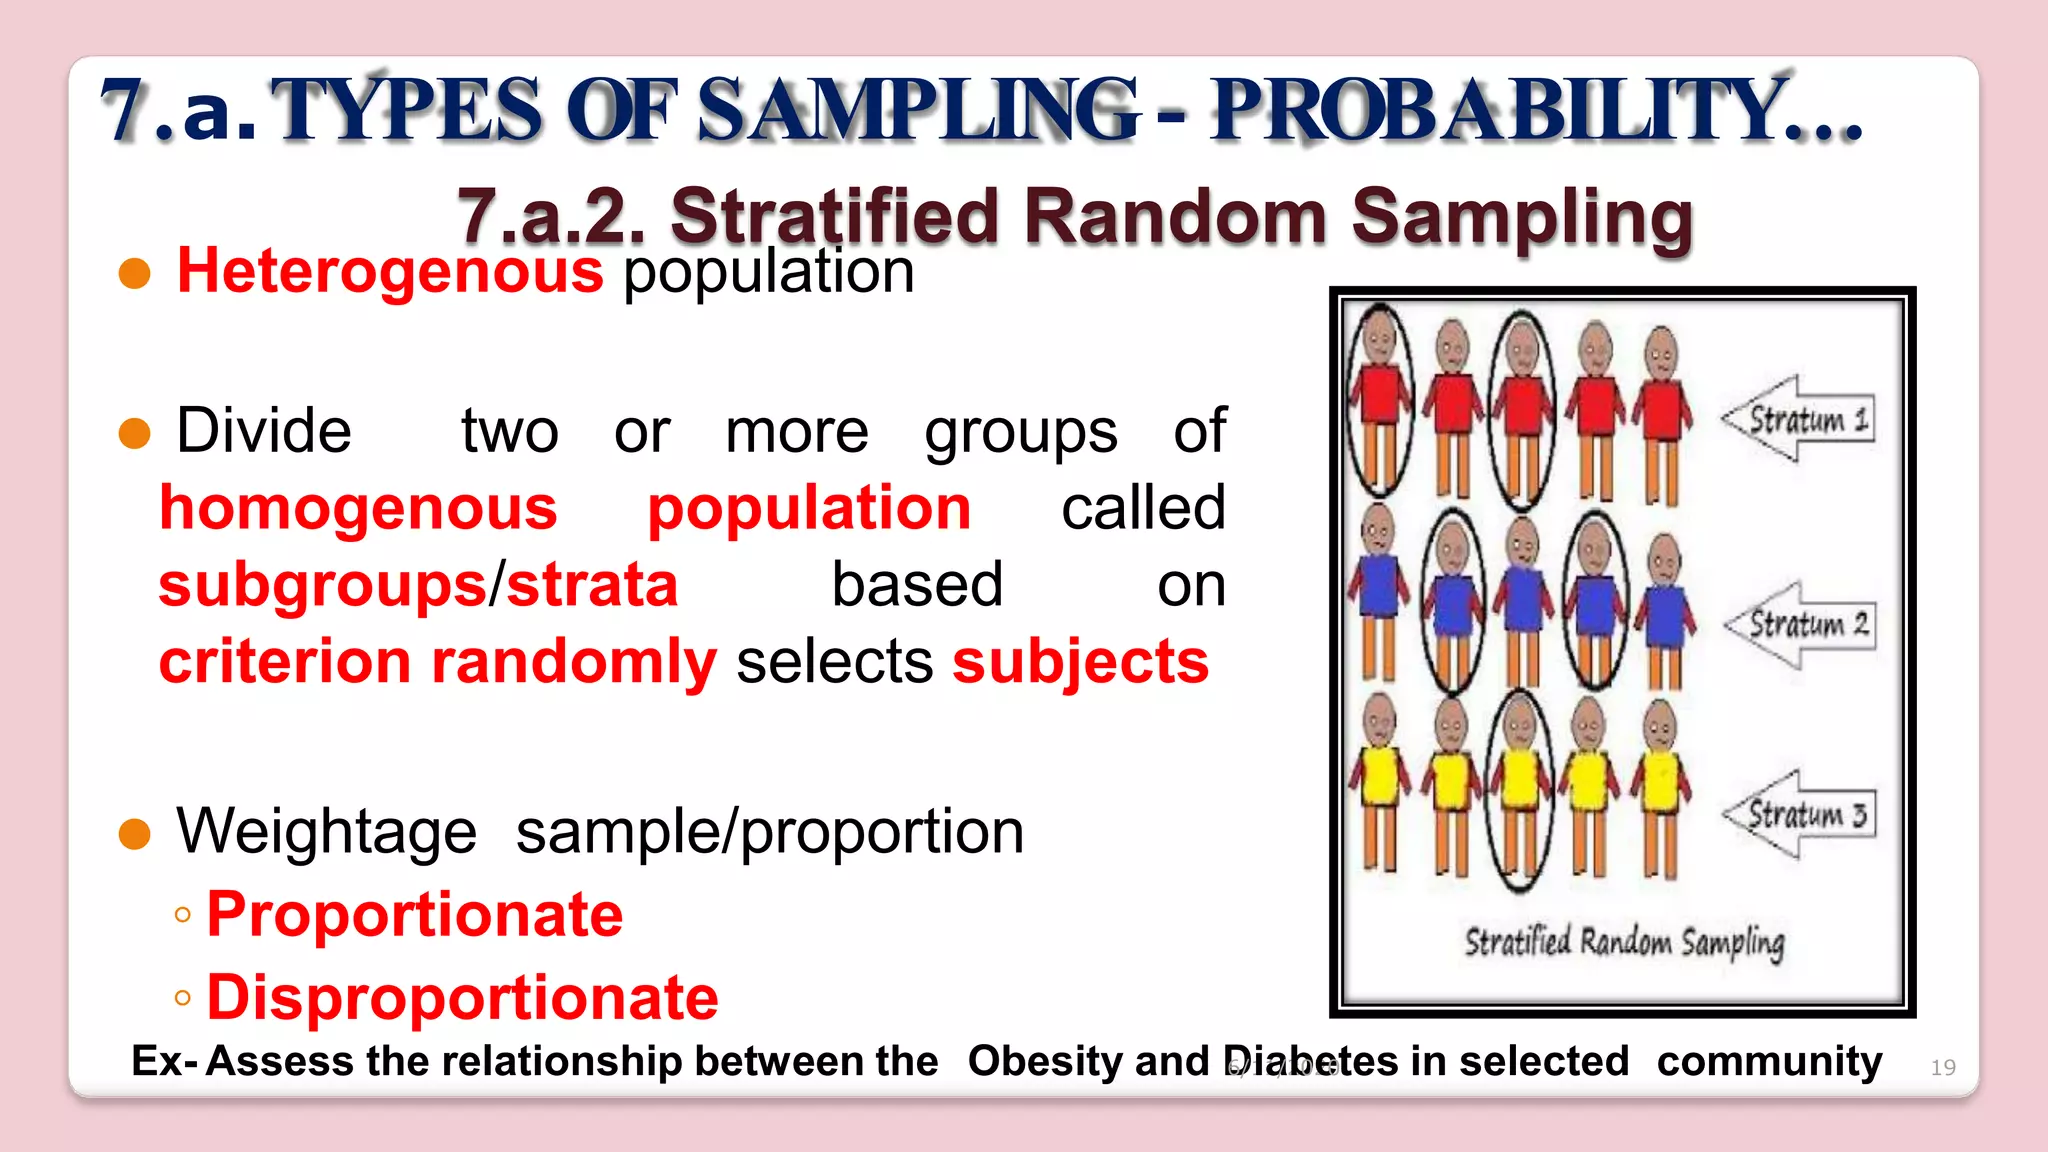
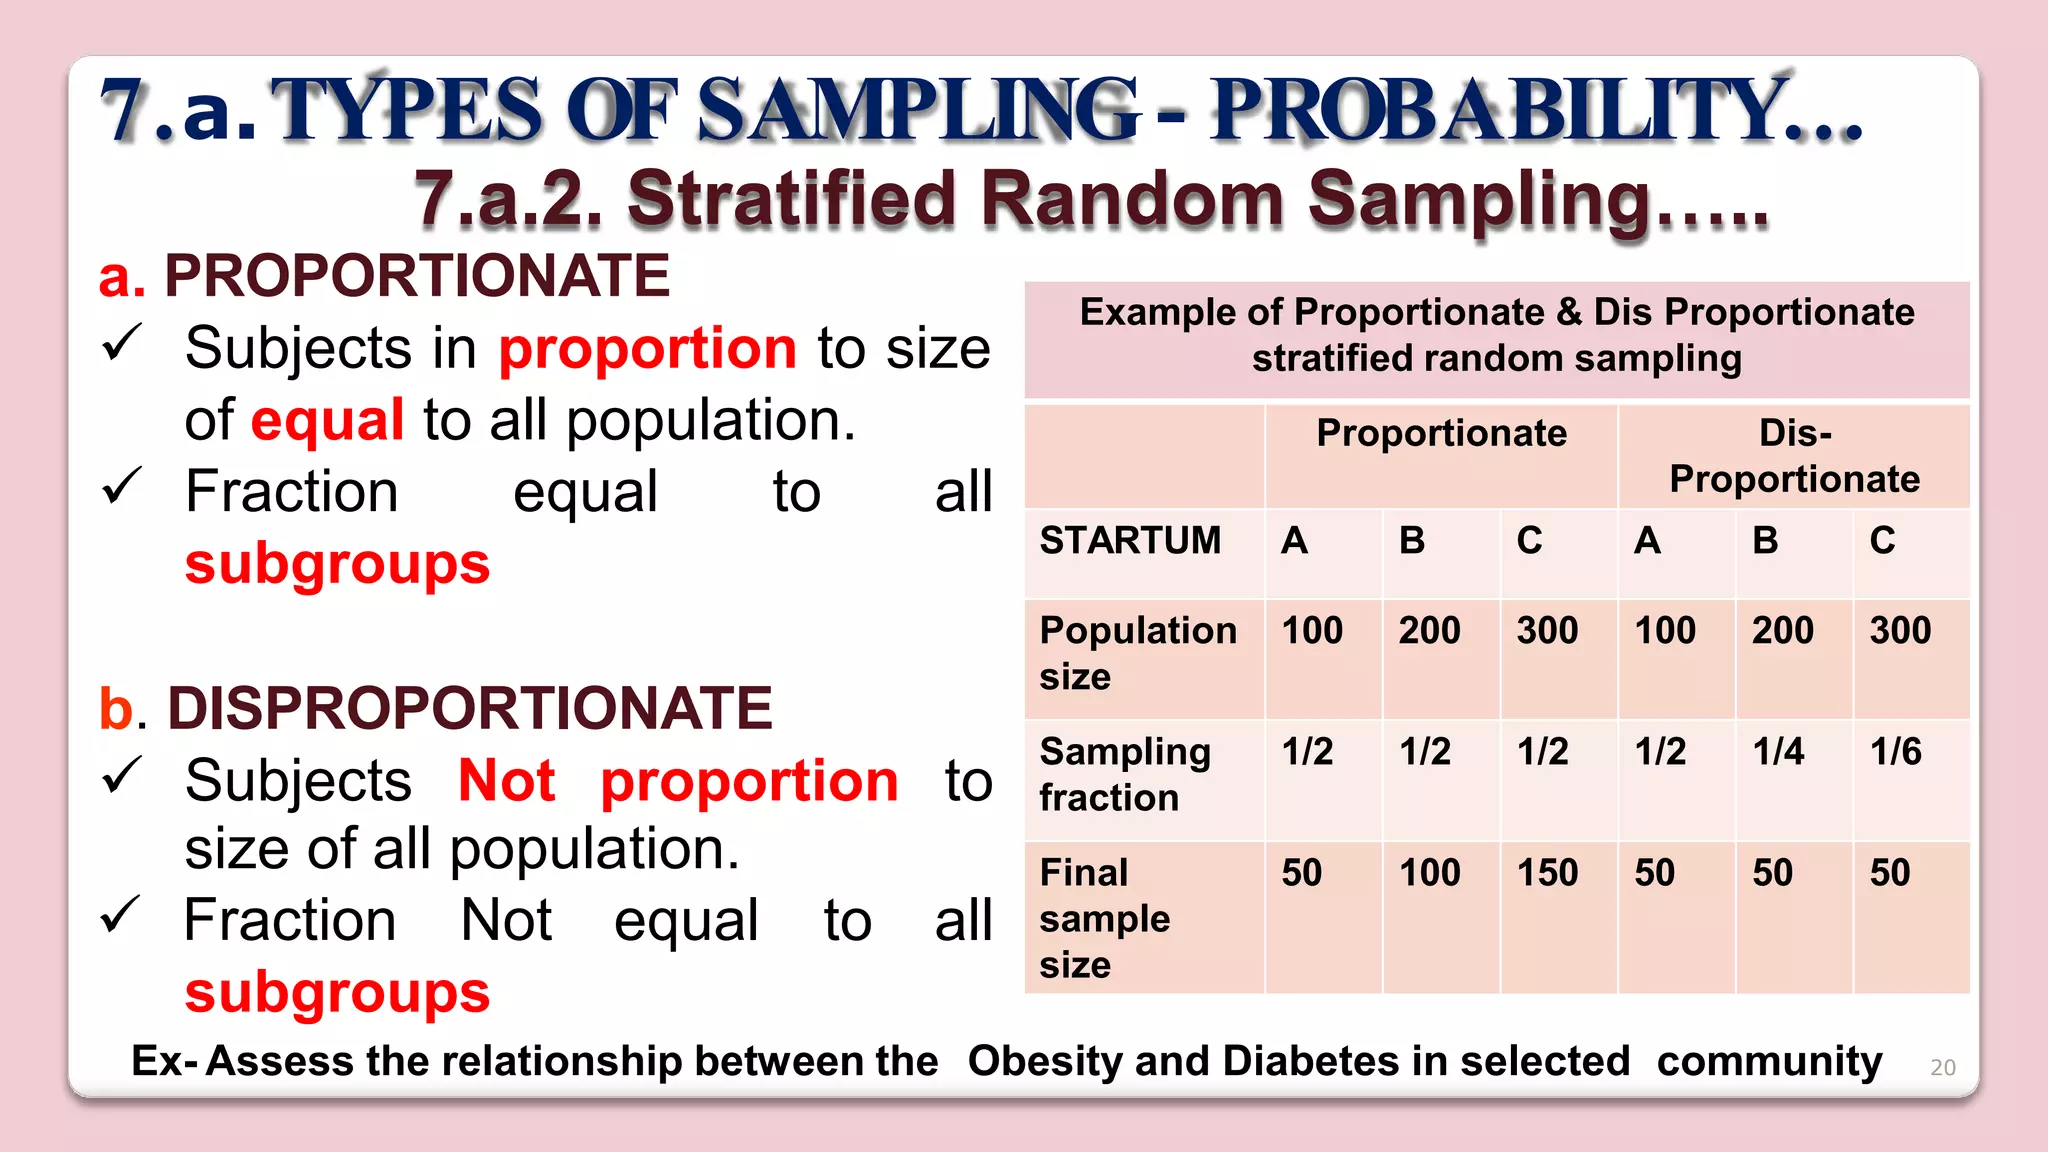
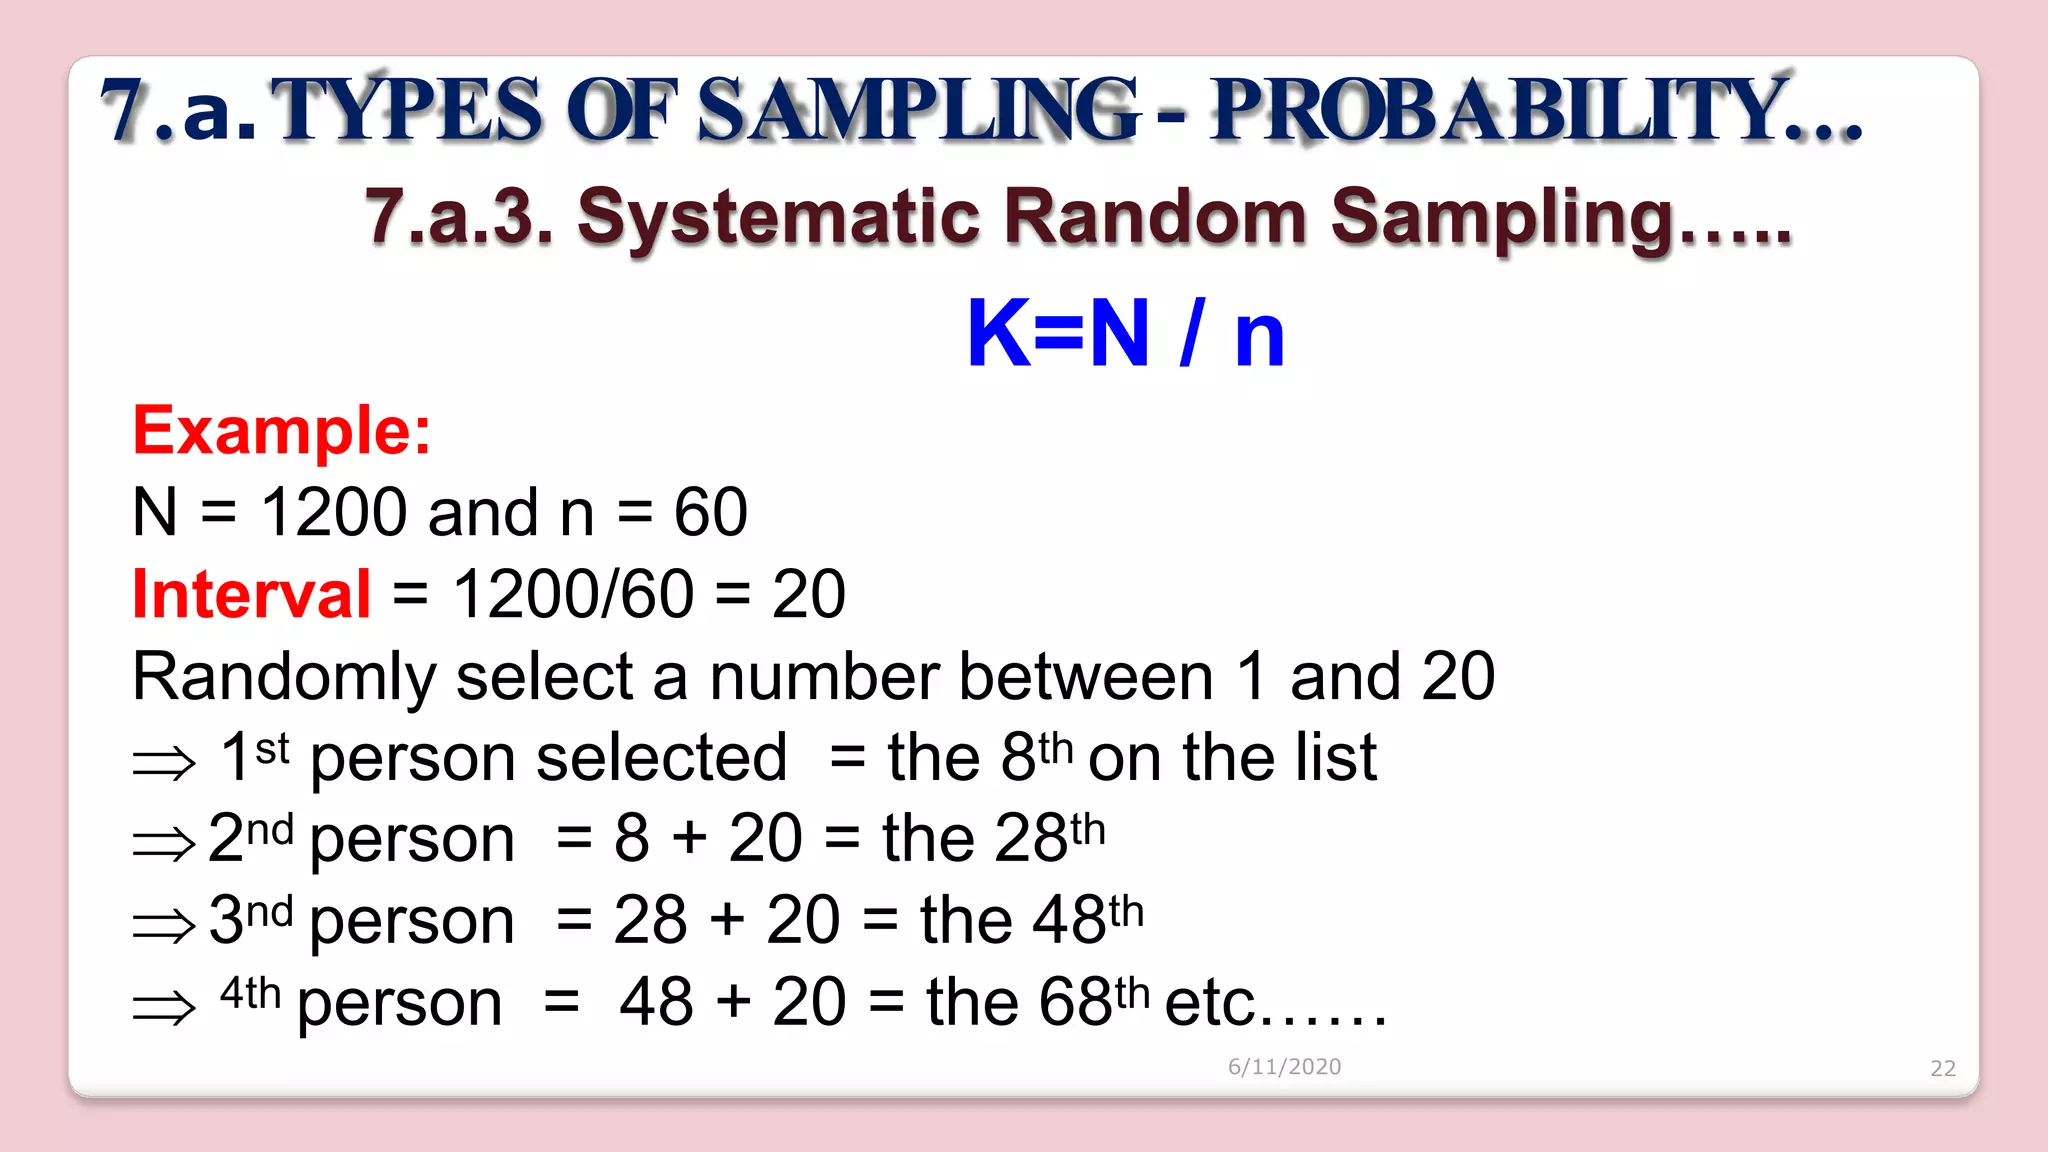
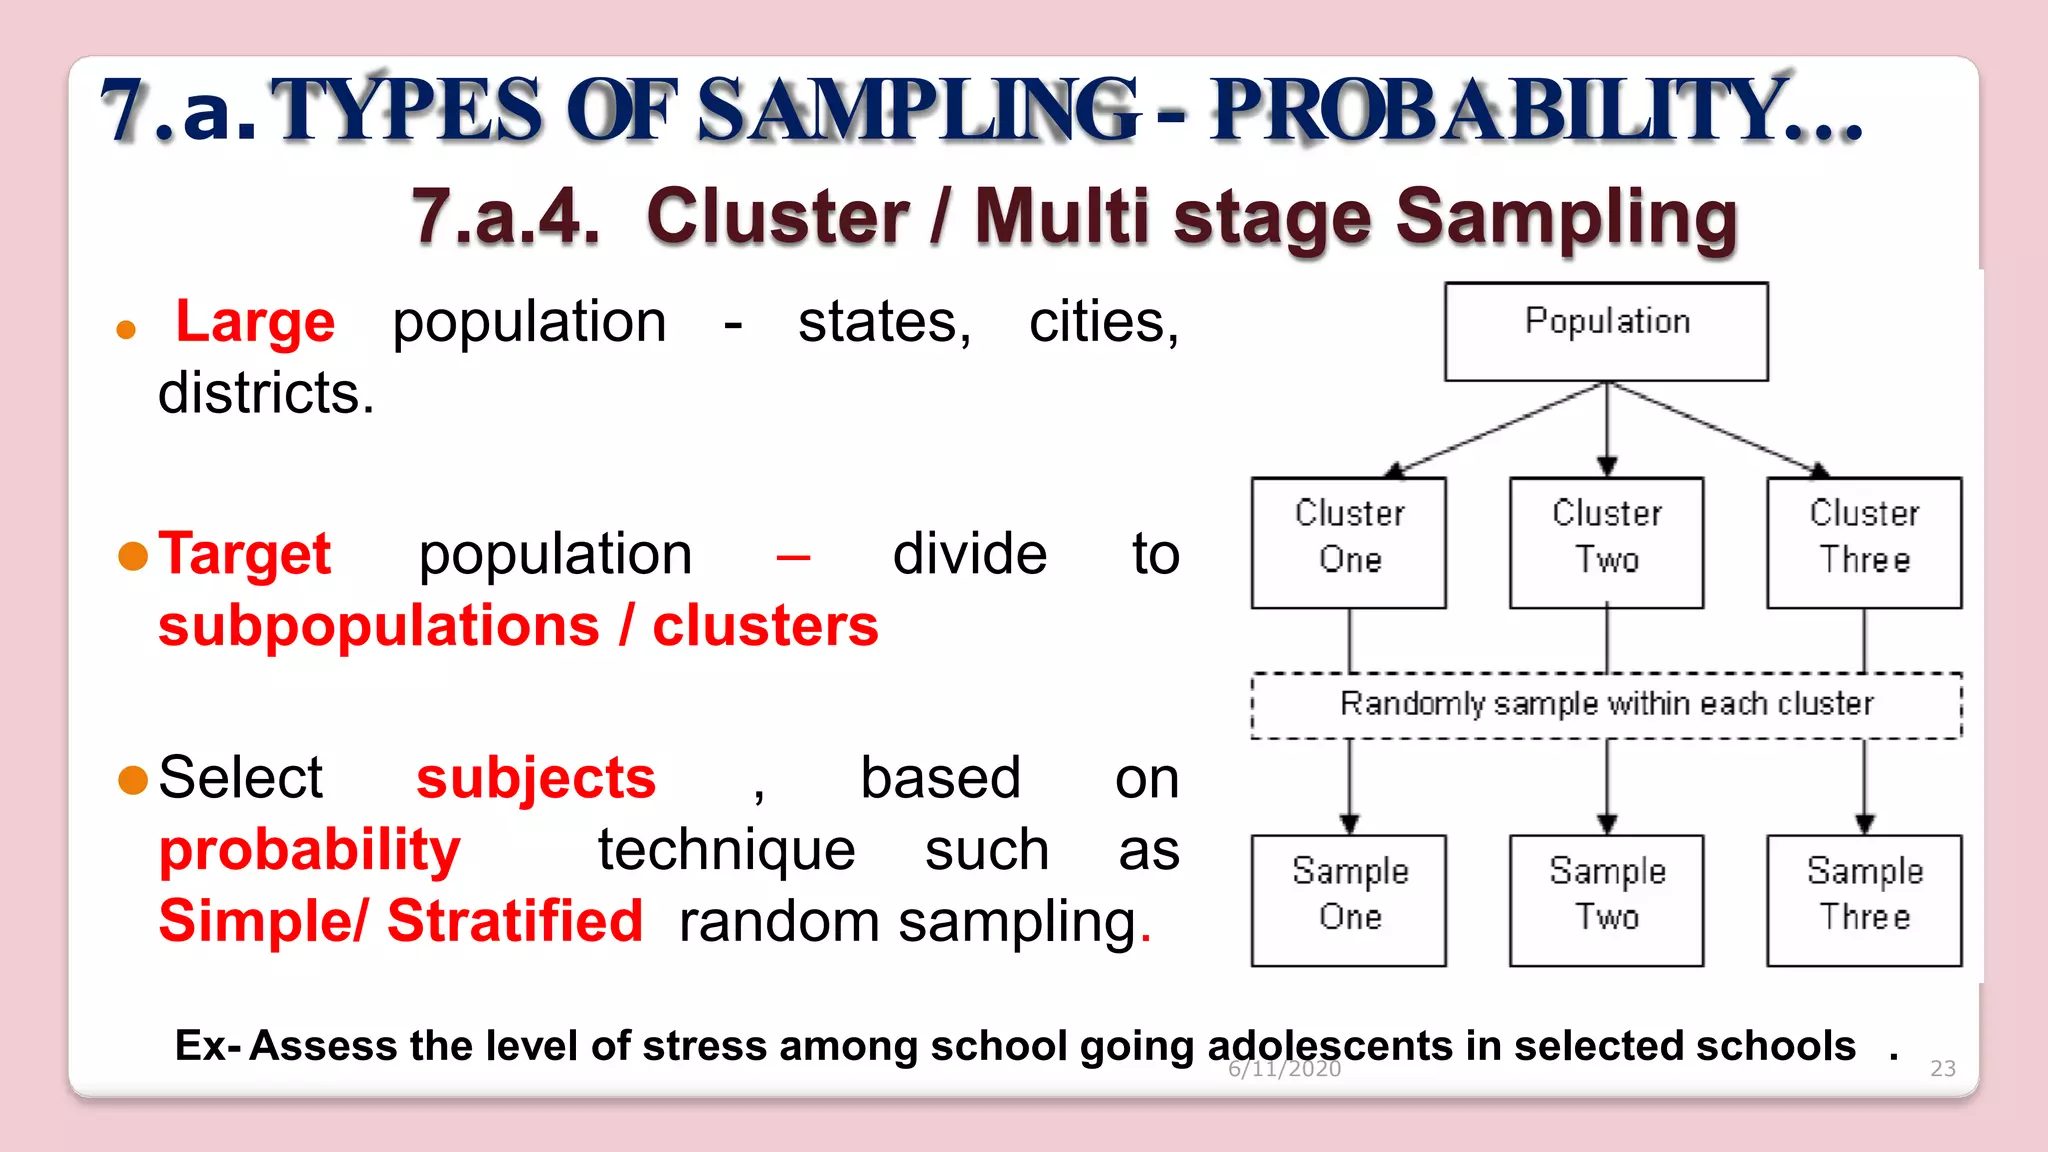
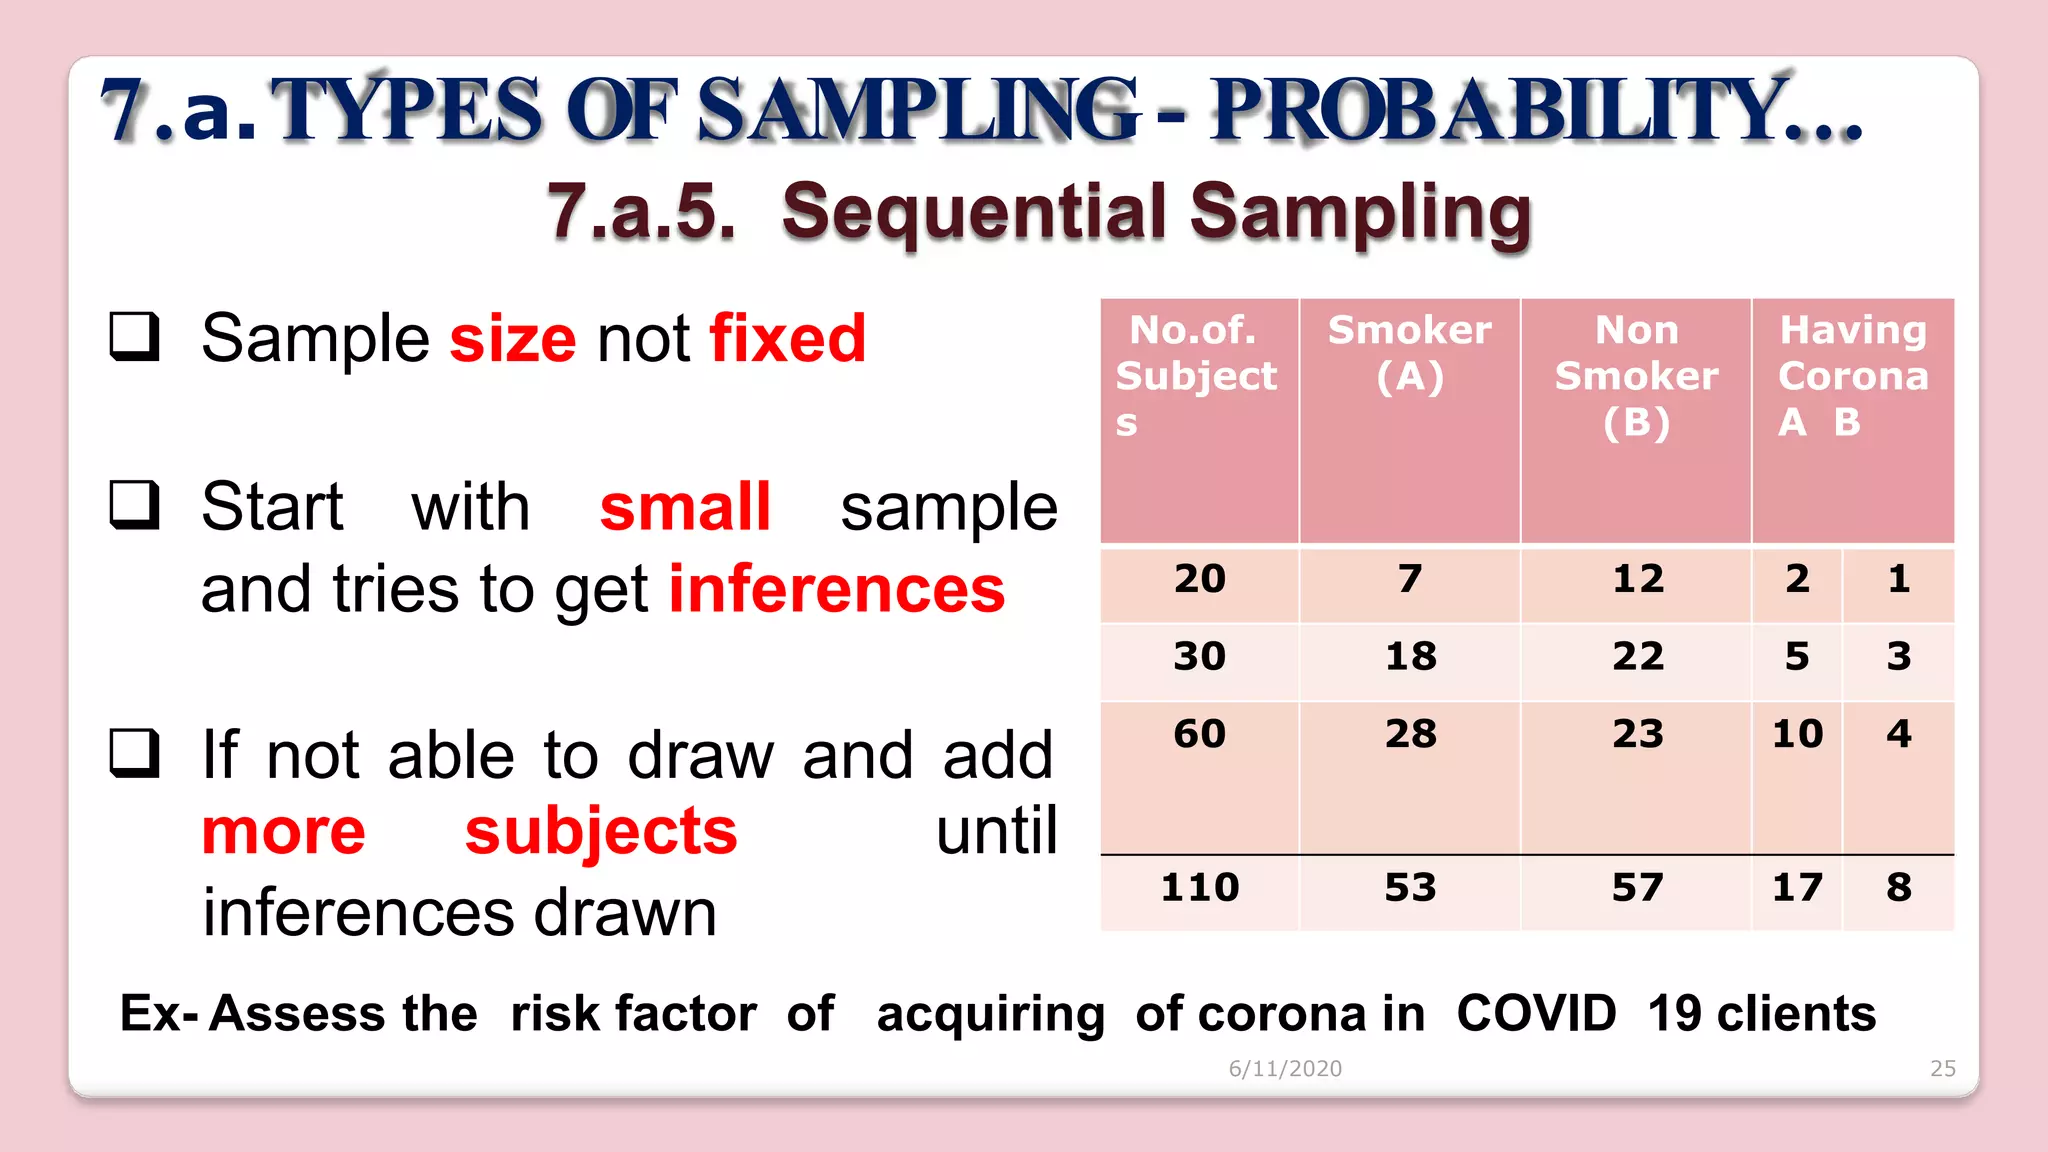
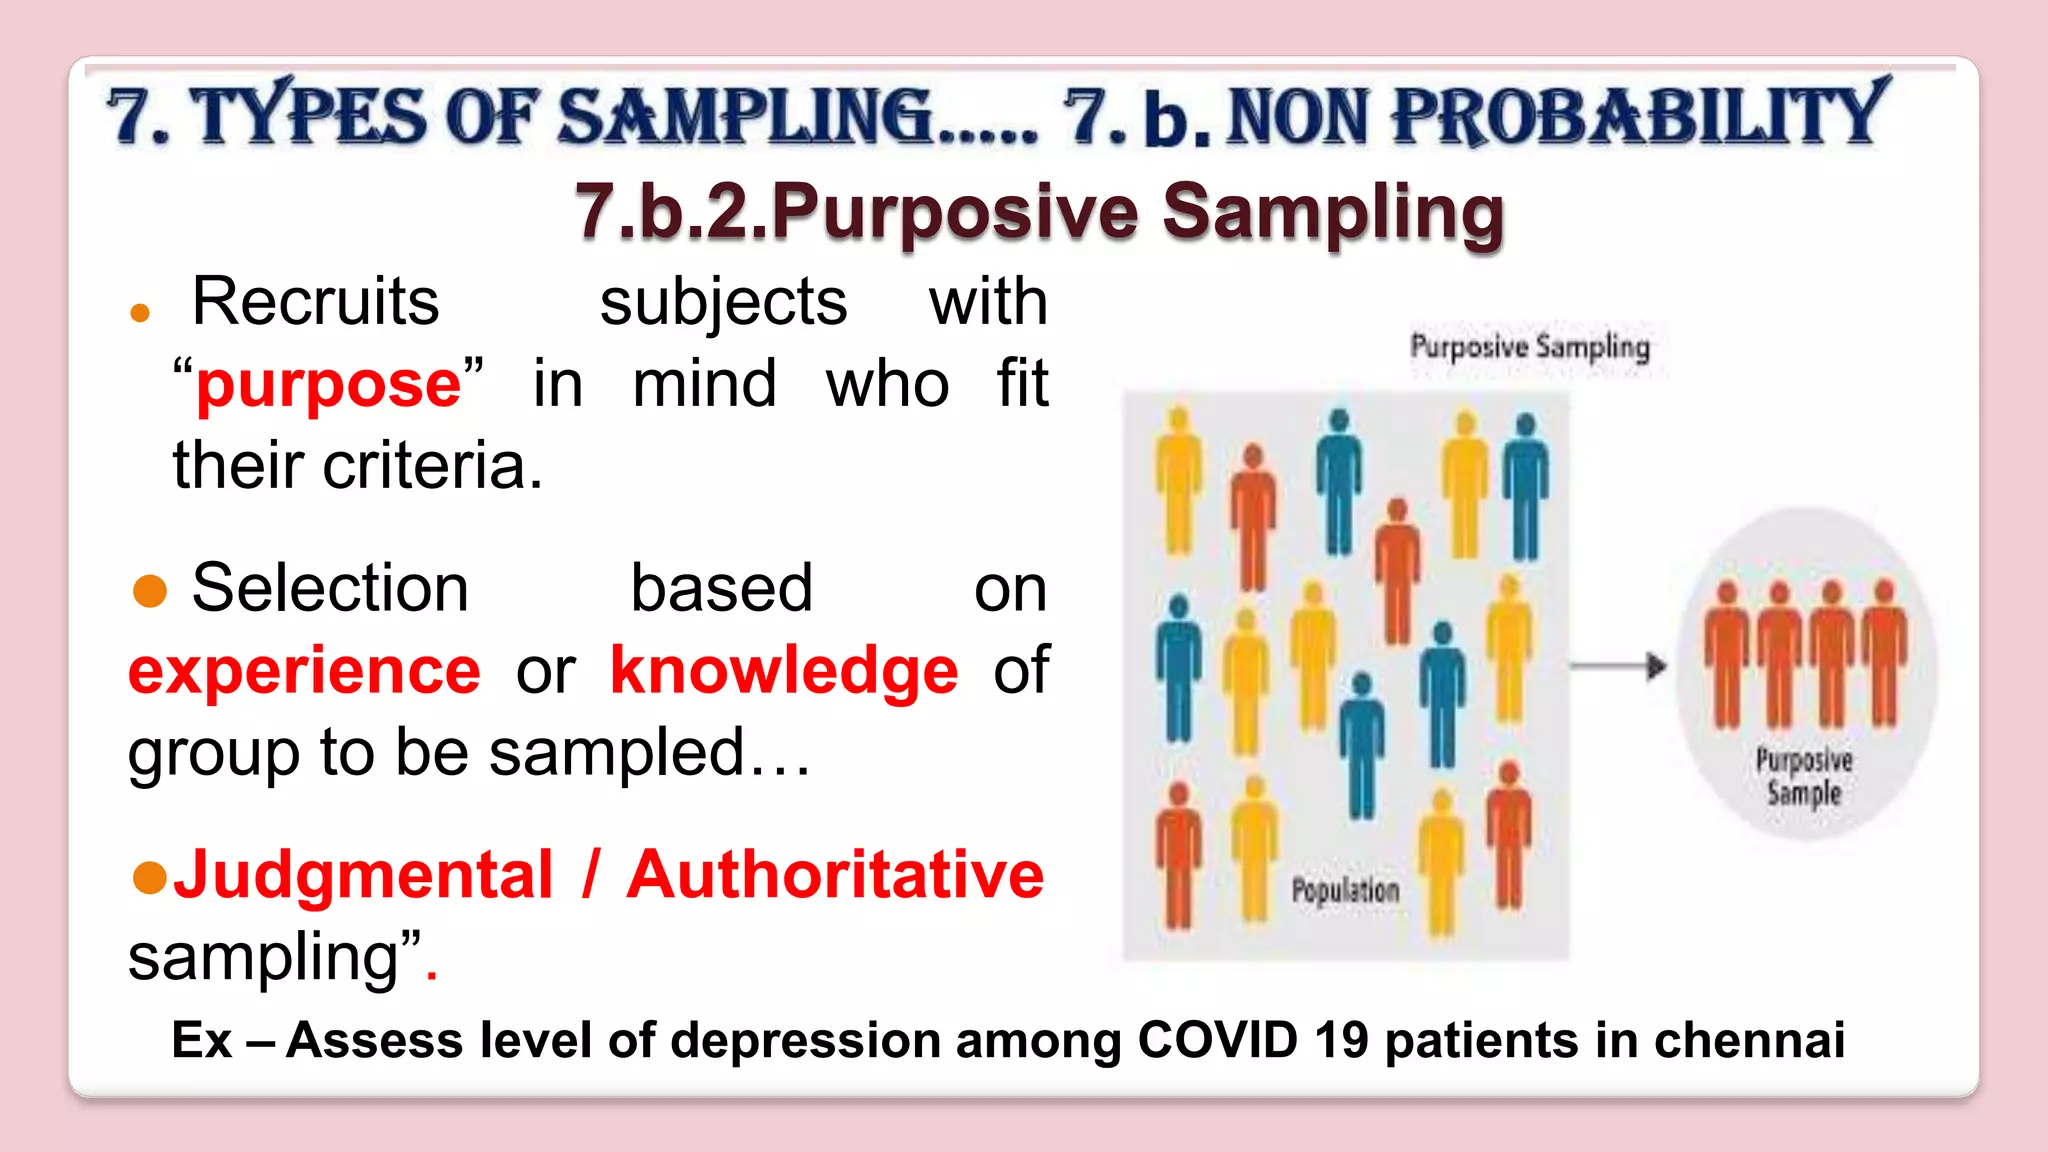
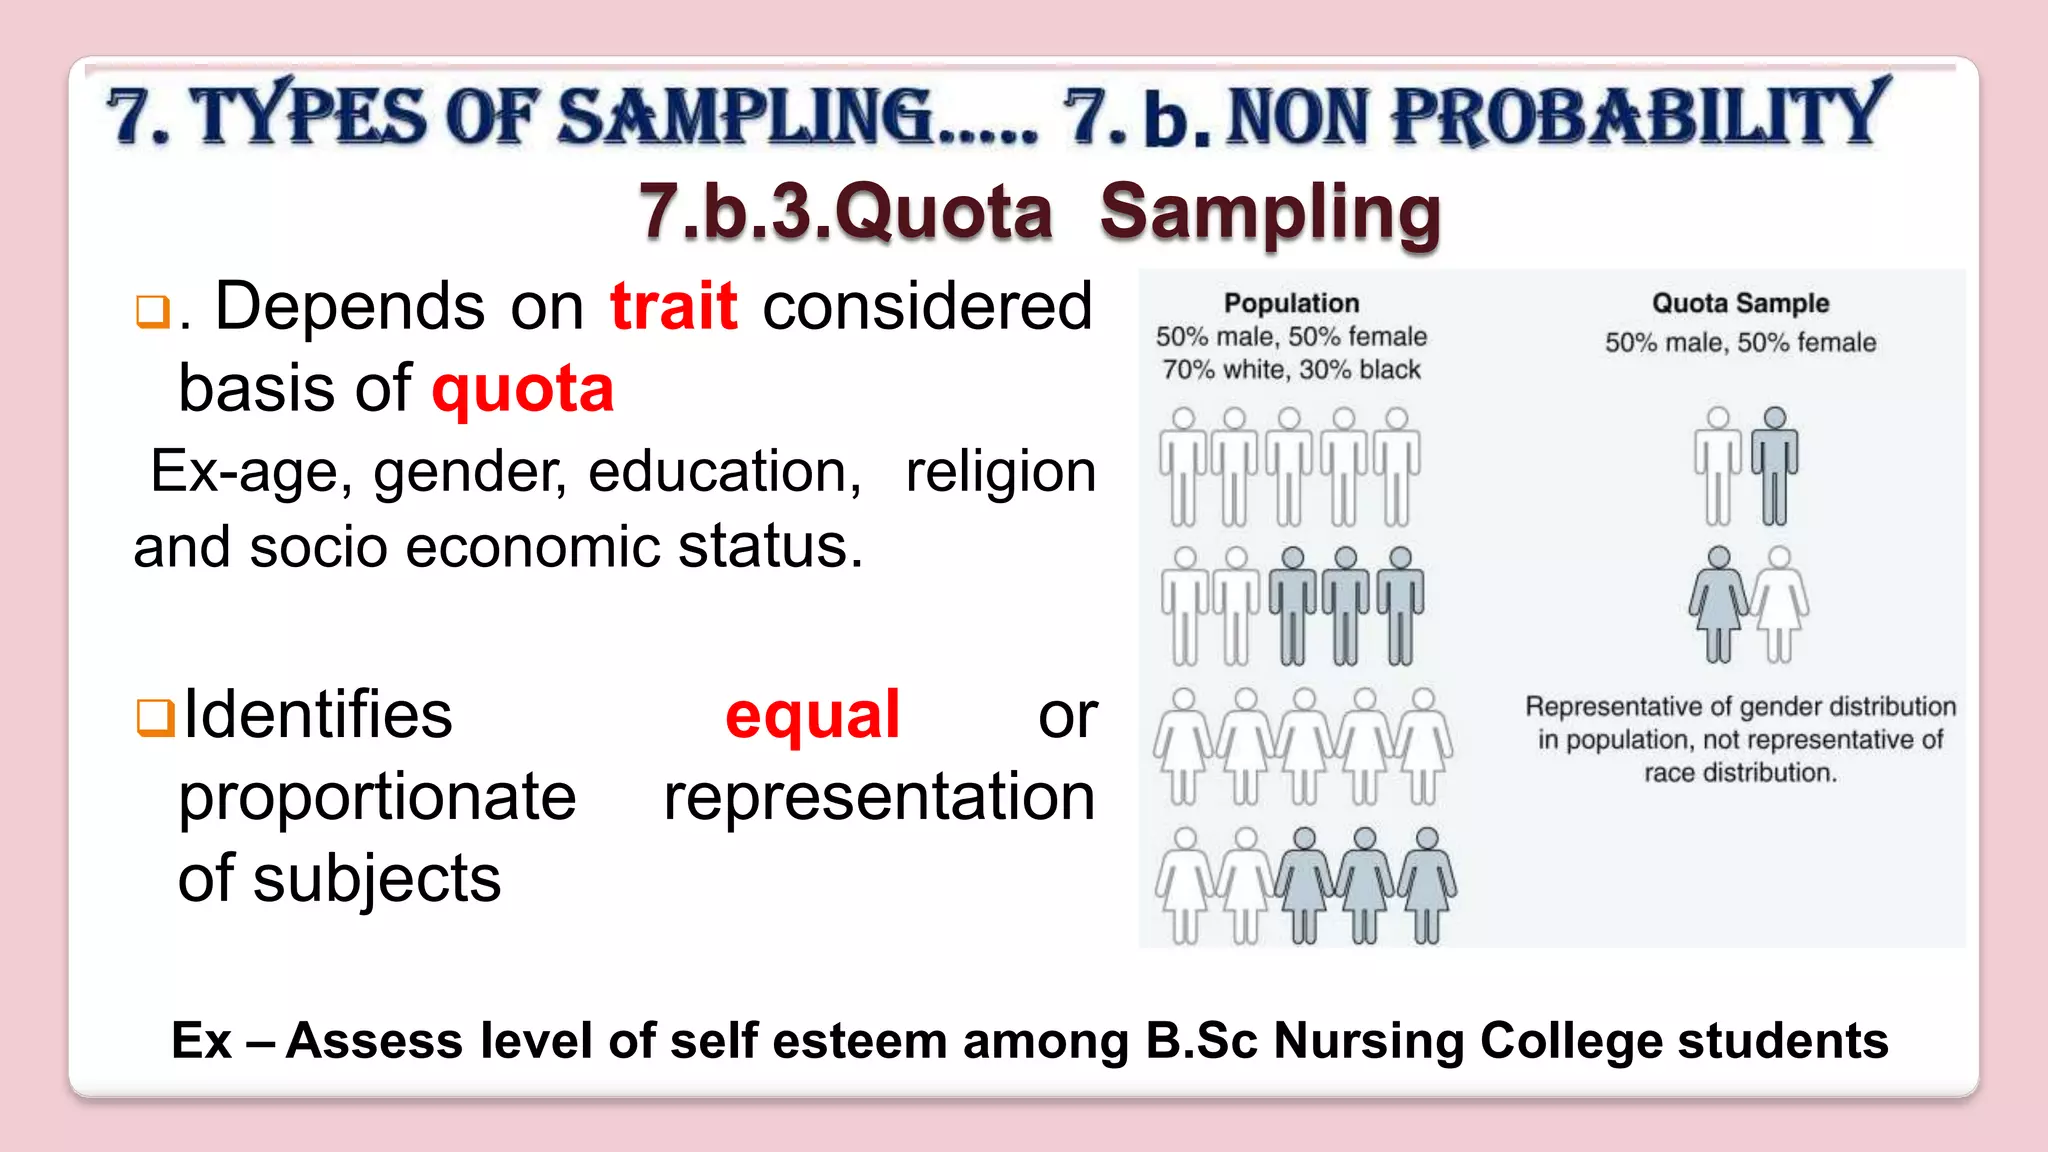
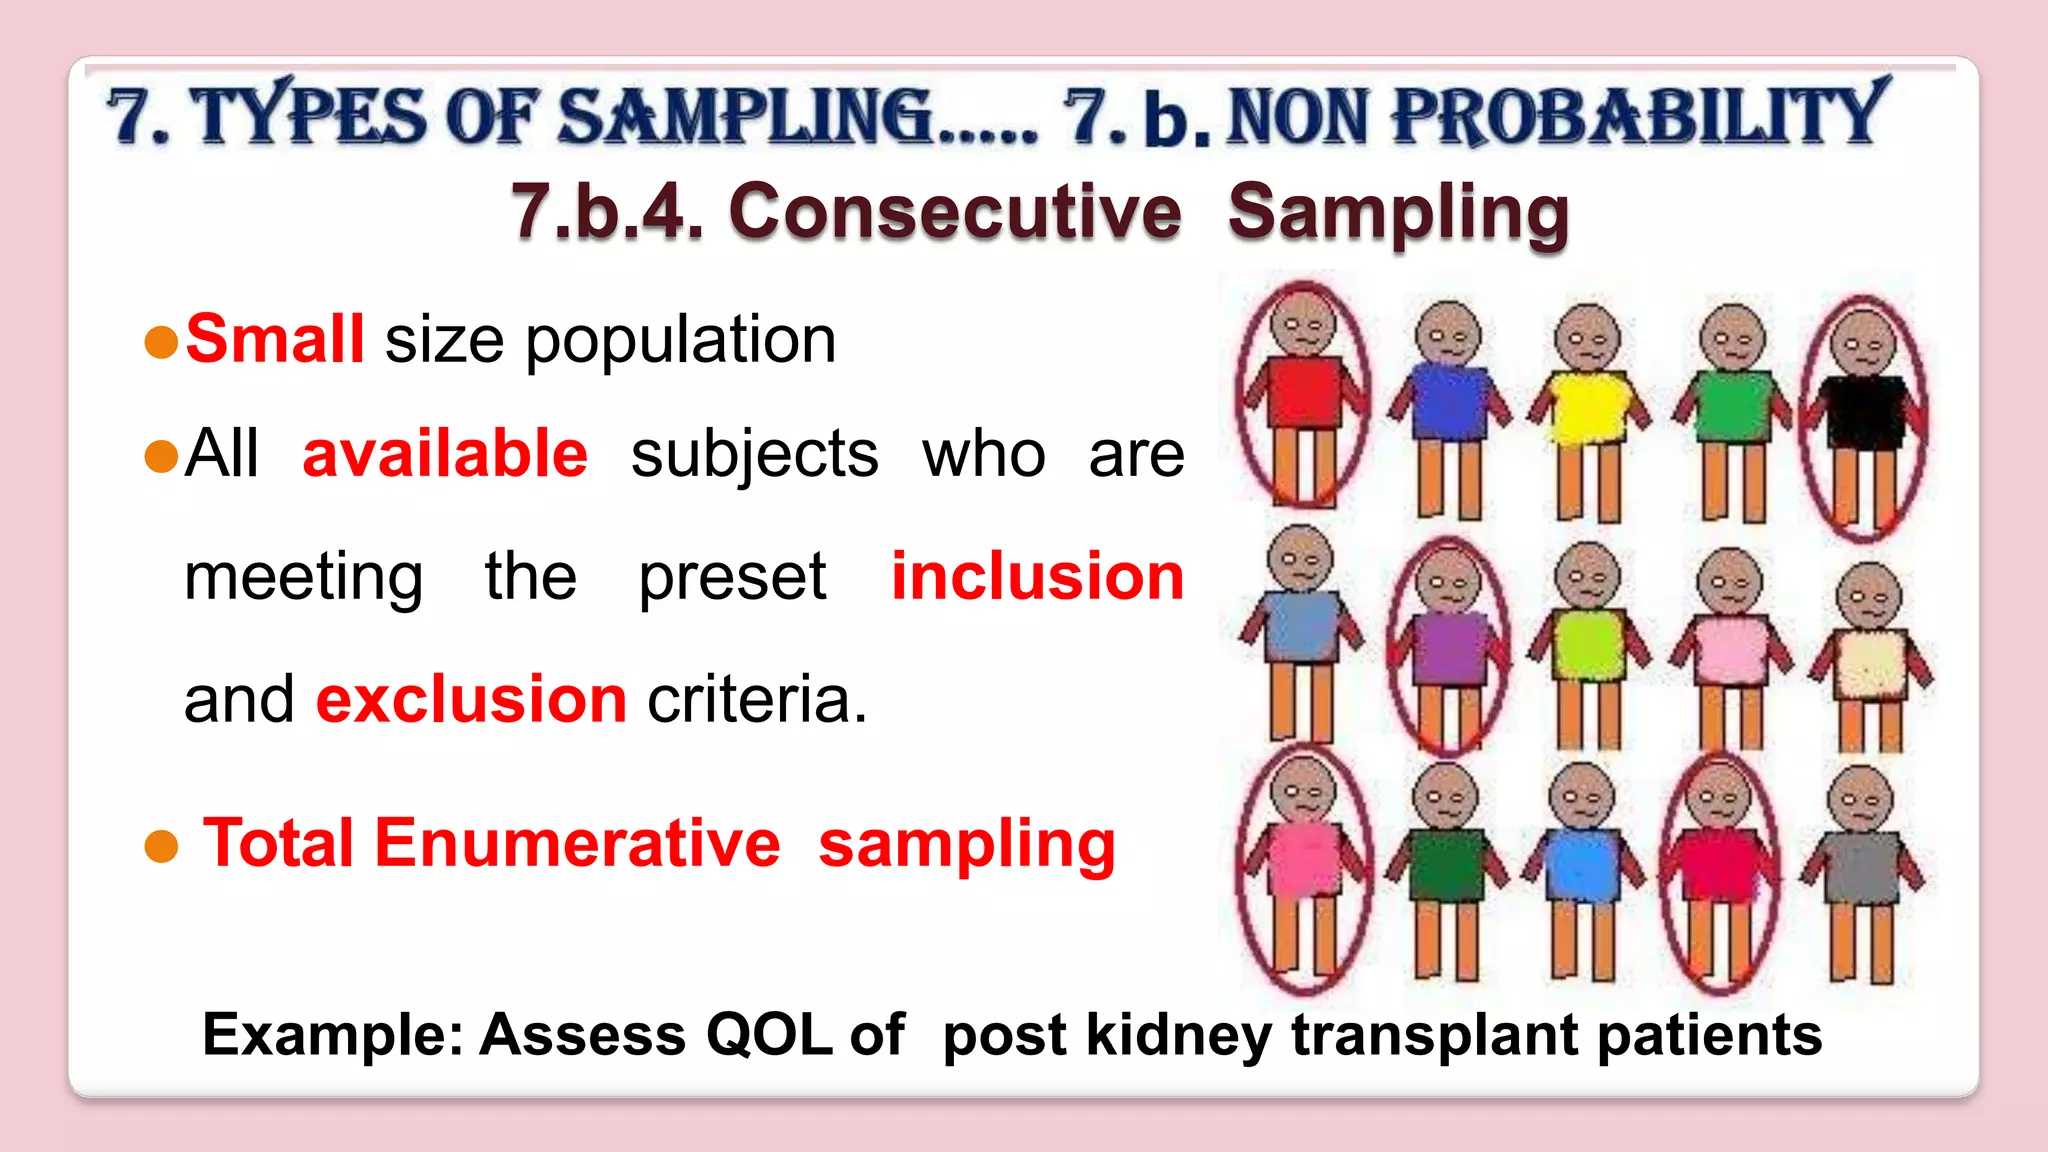
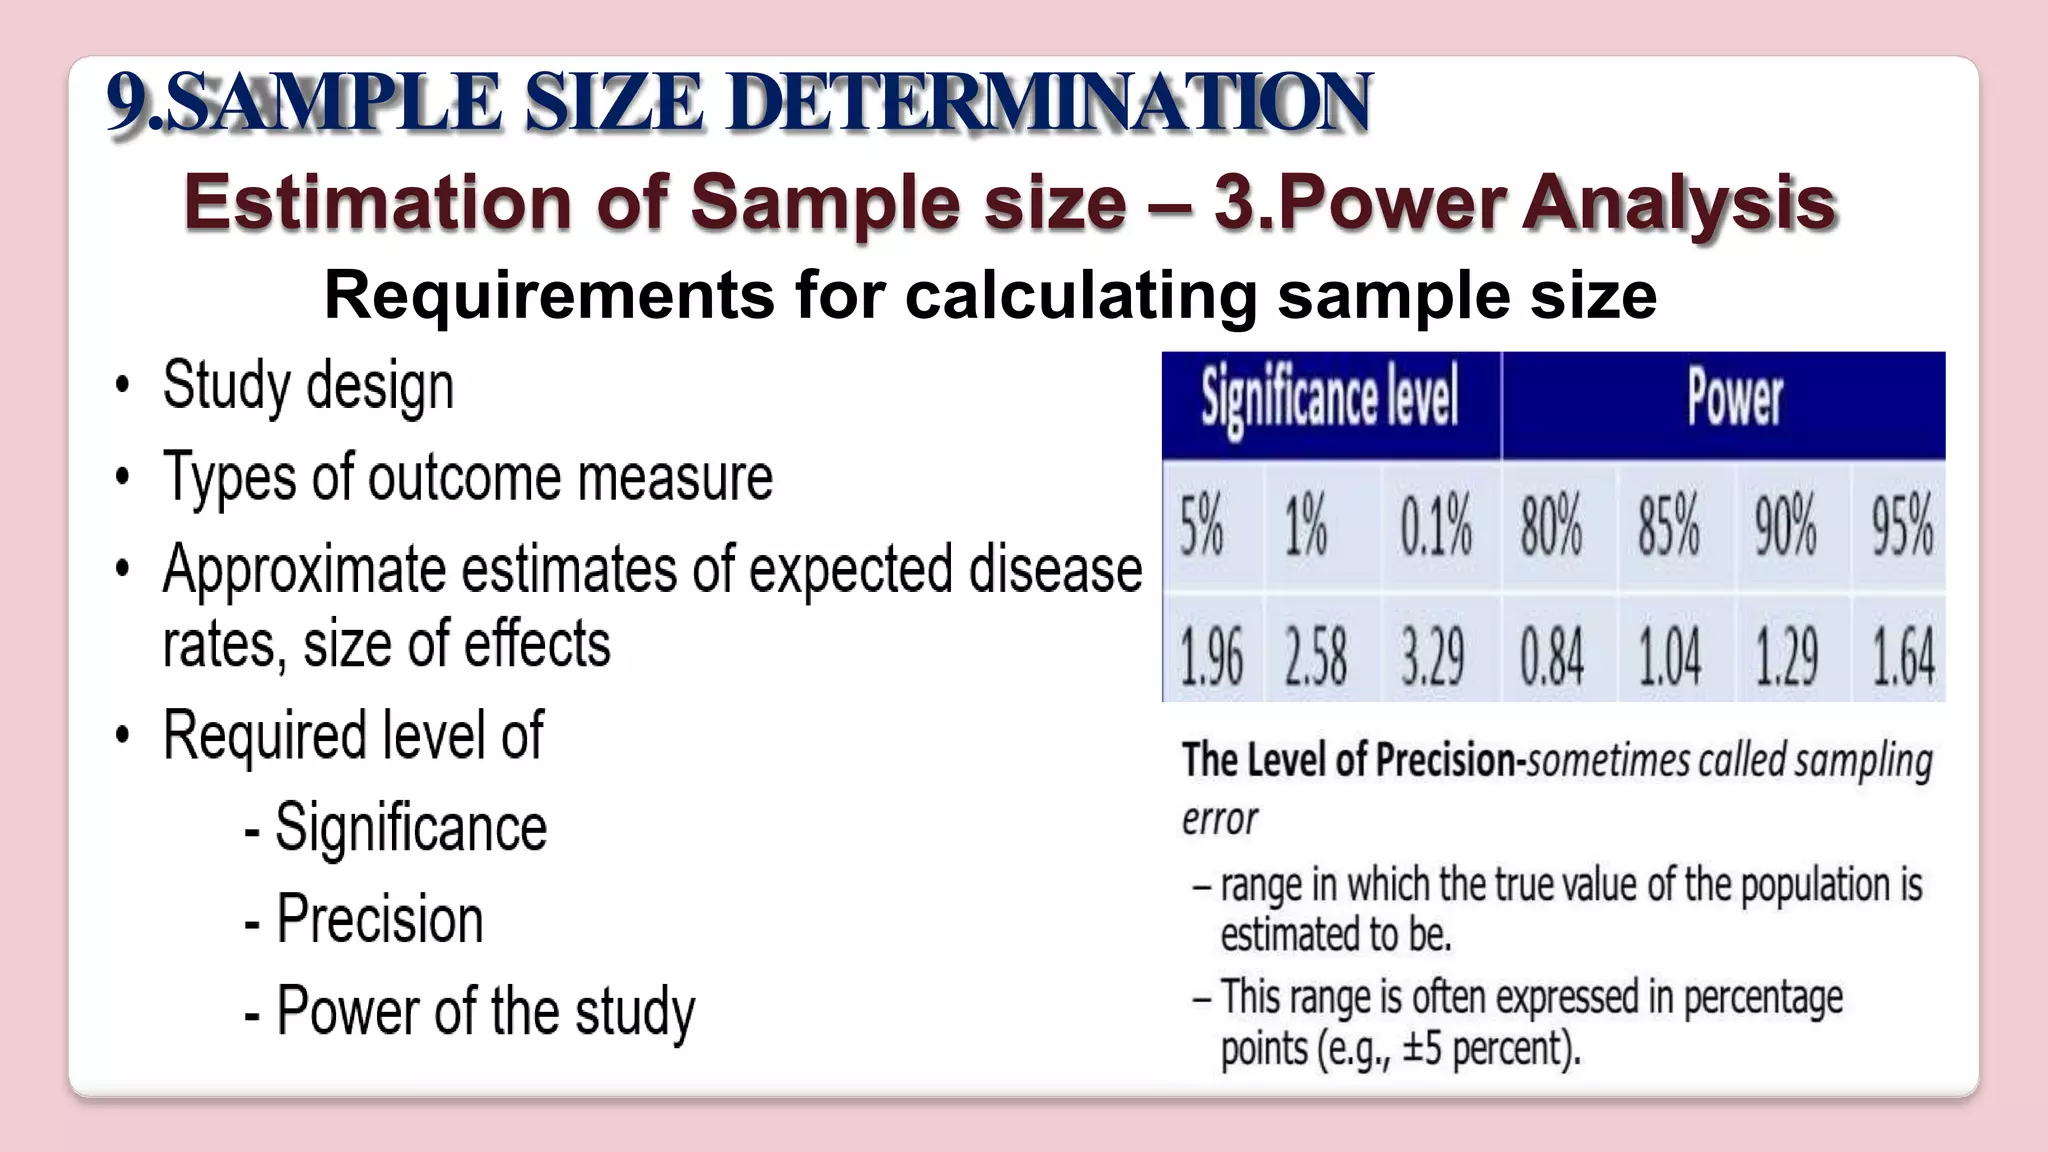
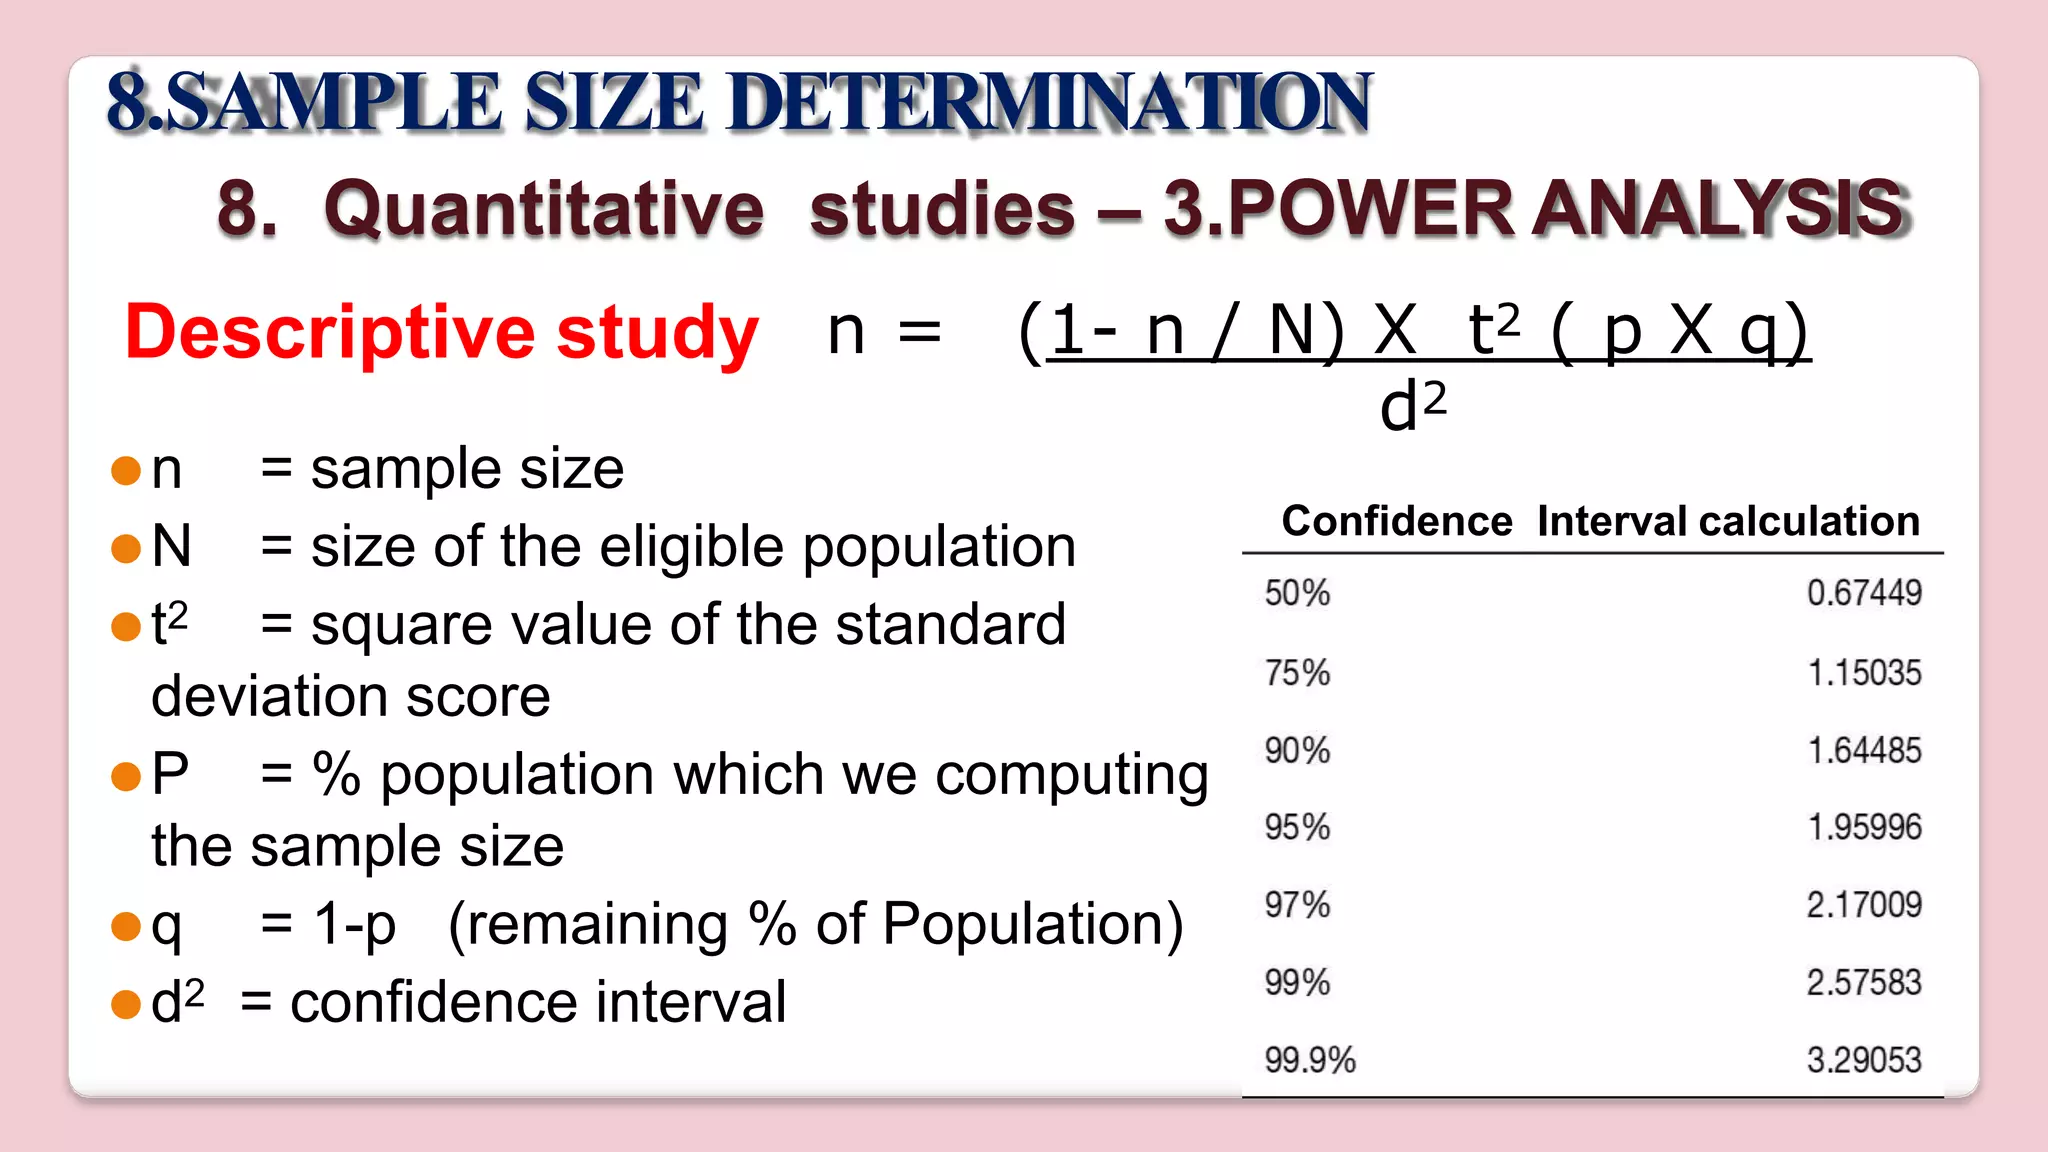
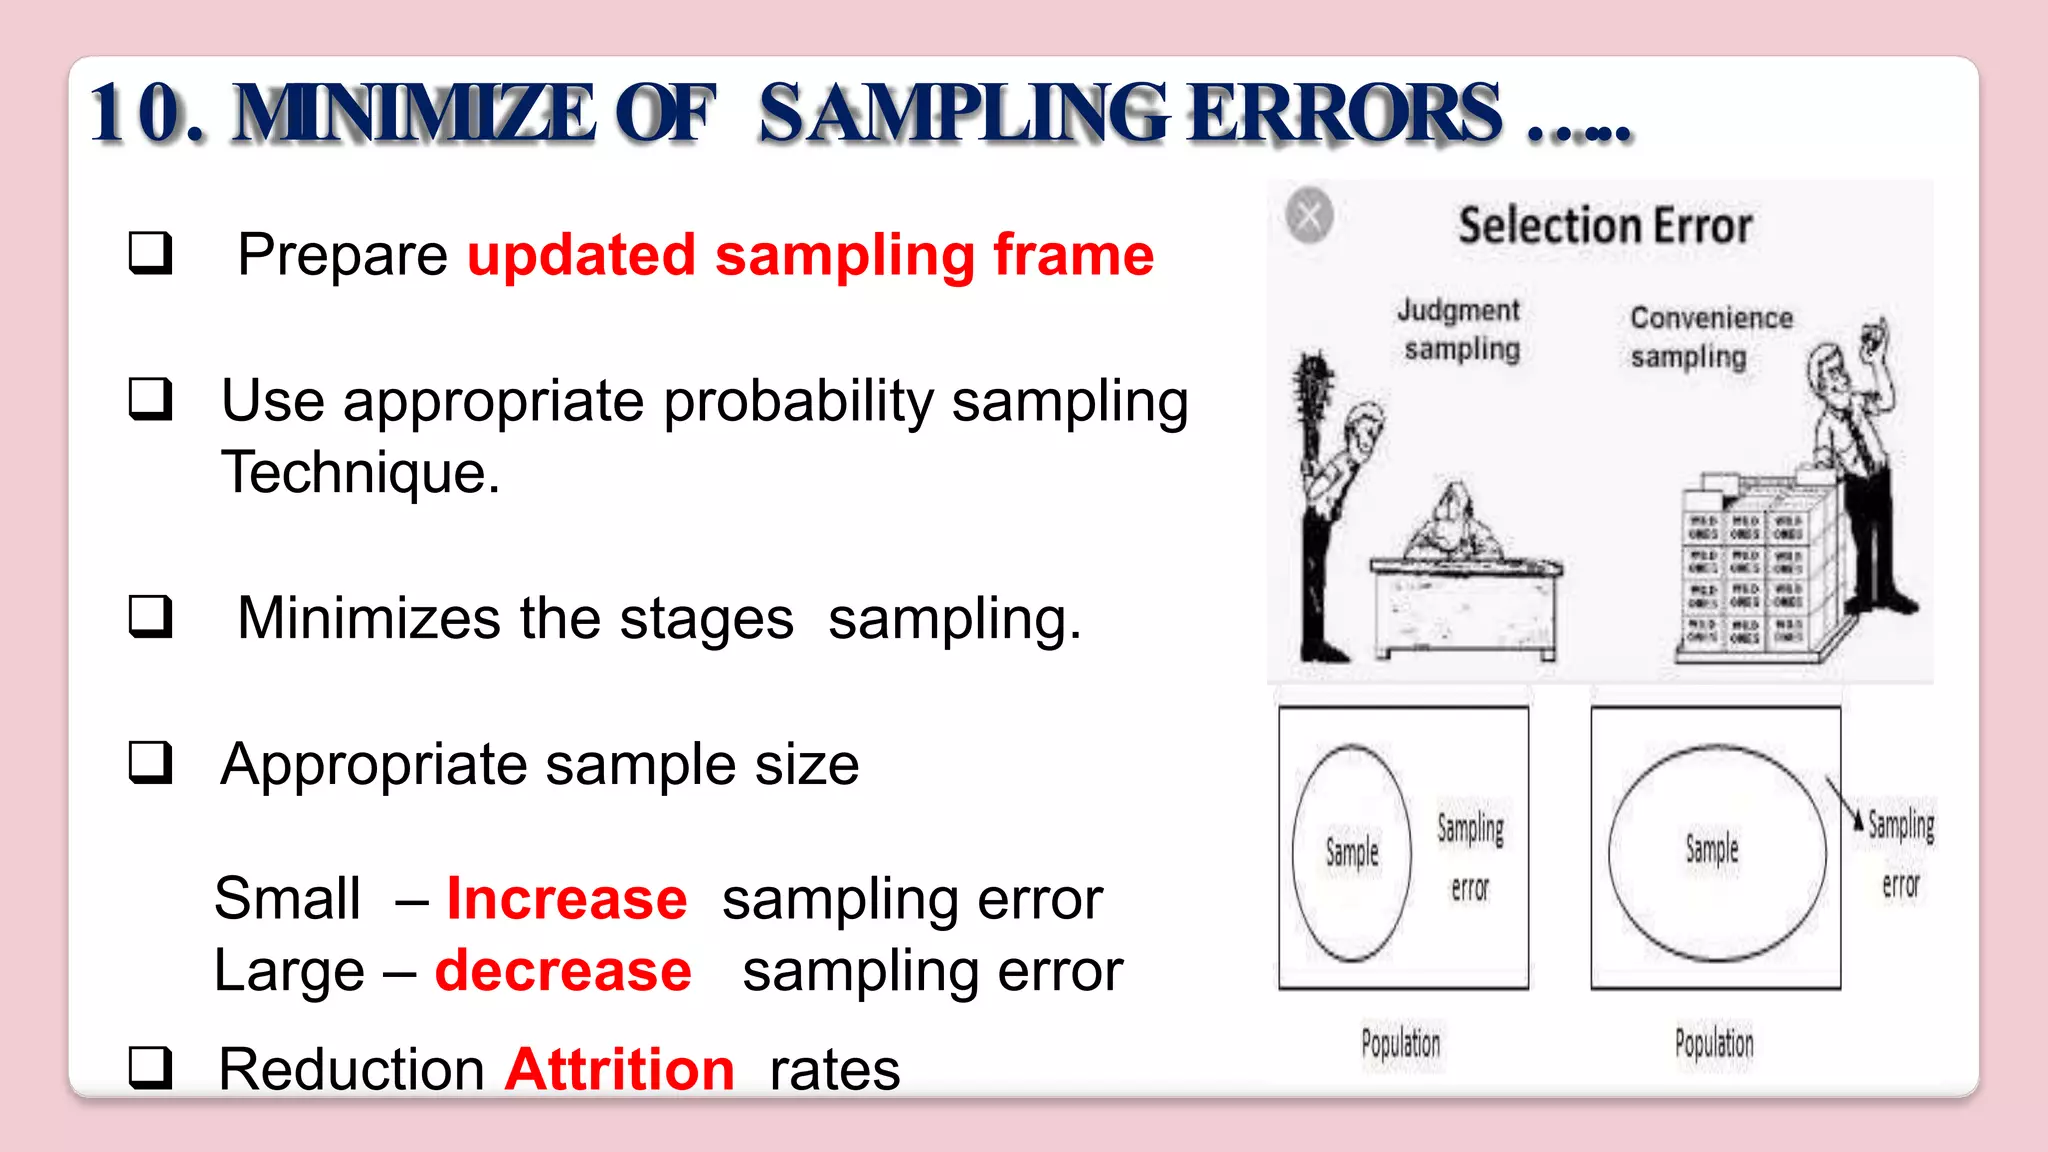
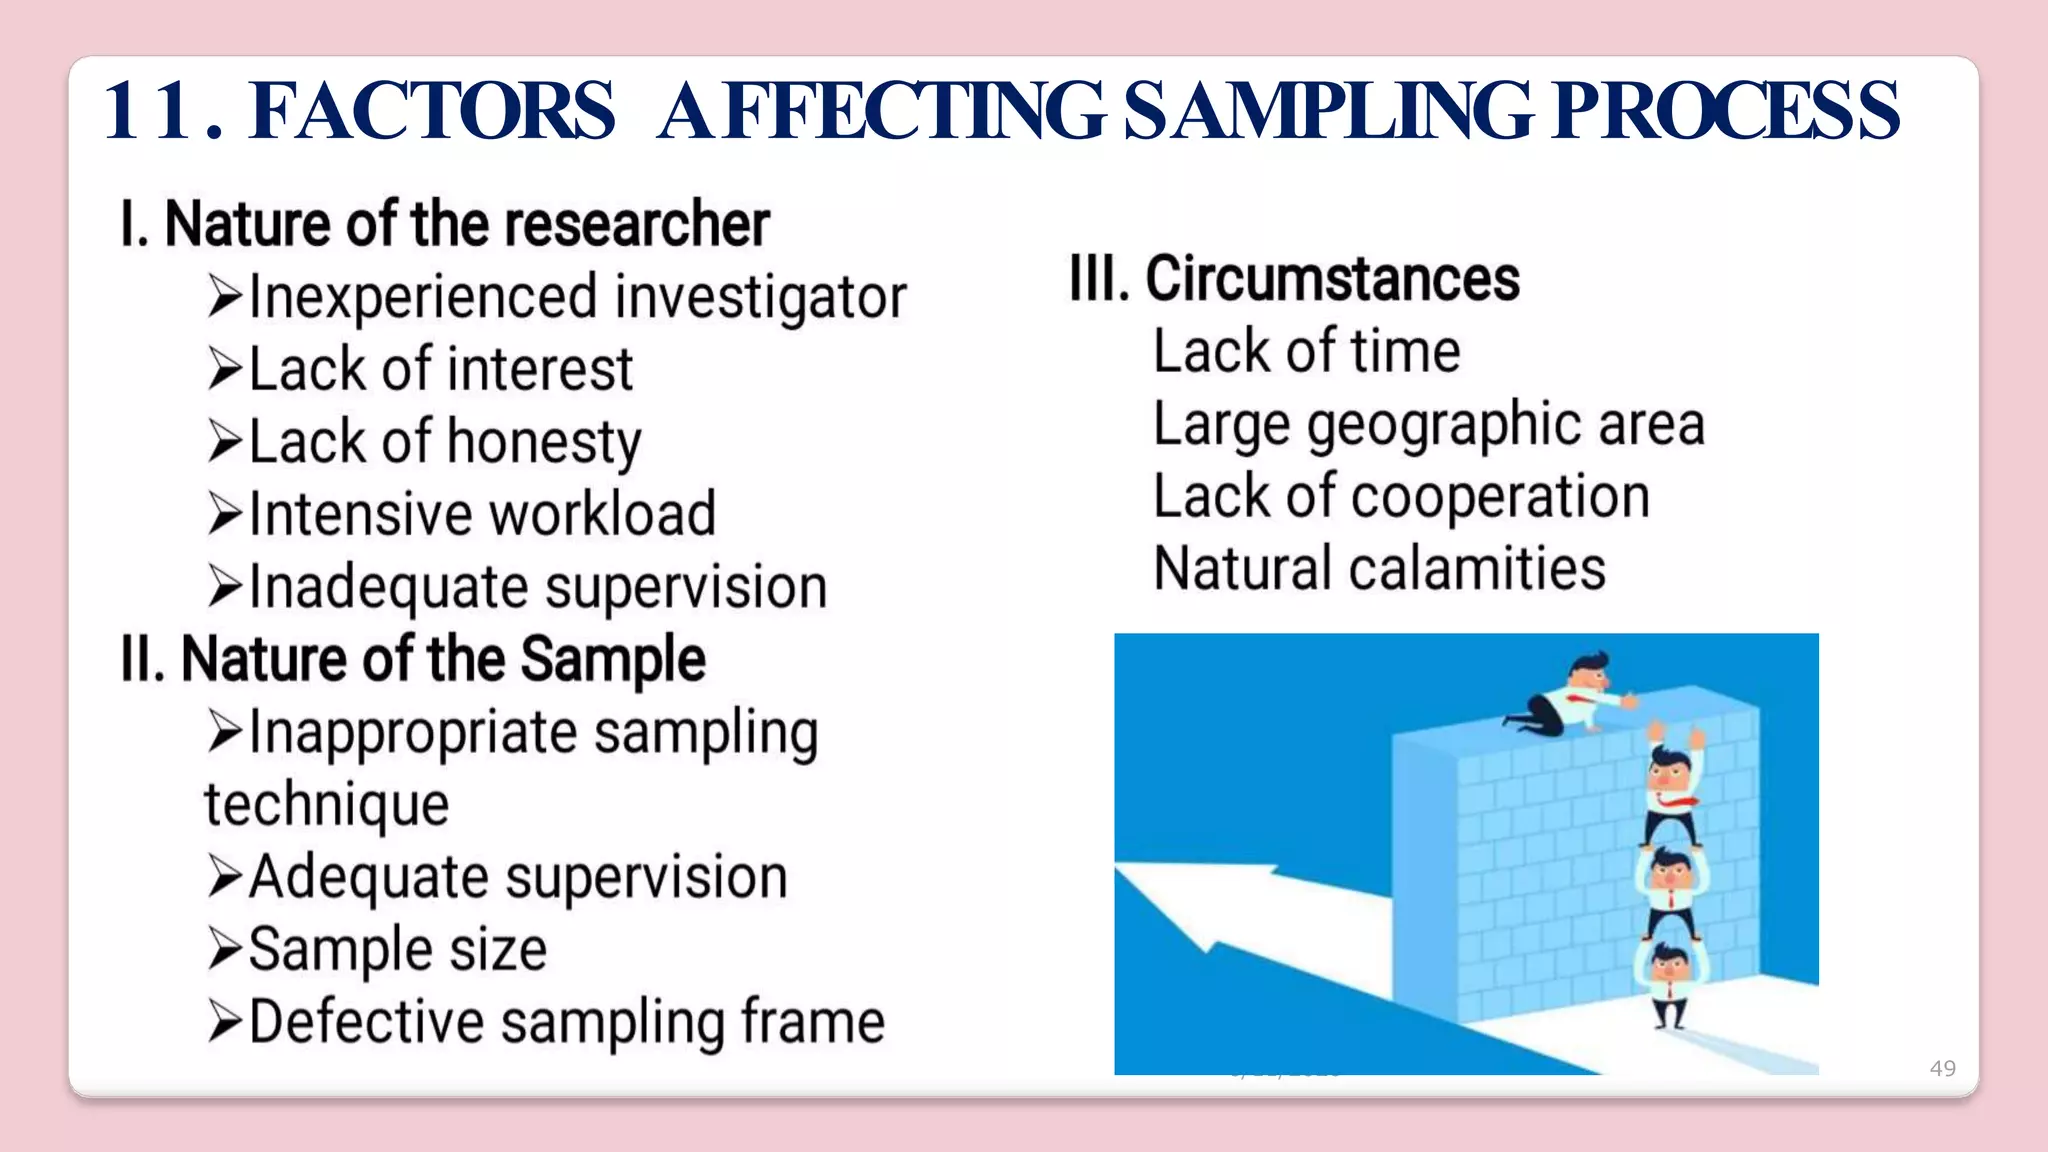
1
Methods
of
Sampling
Prof.Dr.Chinna Chadayan.N
RN.RM., B.Sc (N)., M.Sc (N)., Ph.D (N).,
Professor
Enam Nursing College
Unit 14a
Sampling
1. INTRODUCTION
 Sampling process of selecting
portion of population to represent
entire population
 Representative Unit of entire
population
 Reflect study character of
population.
 Significant of statistical
inferences
Ex- Study to assess the prevalence of co morbidities of Diabetic patients
4
Sampling
Purposes
of
sampling
Economical
Quick study
result
Precision
and
Accuracy
Improved
quality of
data
To gather data
from population in
order to make an
inferences that
can be
generalized
3.PURPOSES
Representative
Free from bias and errors
No substitution & Incompleteness
Appropriate sample size
4.CHARACTERISTICS OF GOODSAMPLE
1
2
3
4
5.PRINCIPLES
PRINCIPLES
OF
SAMPLING
Law of
Statistical
Regularity
Law of
Inertia of
Large
Numbers
6/11/2020
More
Accurate
results
9
Select
Sample
Random
Sample
Sampling
Plan
Sample size
Selection methods
Sampling unit
Describe Accessible population
& Sampling Frame
6/11/2020 10
Define Population
(Identify & Target)
Constructing list
6.SAMPLINGPROCESS
Probability/Non Probability
Inclusion/Exclusion
Representative Unit
Chart of Plan
Calculation based on formula
Subjects
6/11/2020 11
SAMPLING
TECHNIQUES
USED
QUANTITATIVE
DESIGN
7. TYPES OF SAMPLINGTECHNIQUES
6/11/2020 12
7.a
Probability /
Random
sampling
• Each sample unit
in a group has an
equal chance of
being selected.
7.b
Non-probability/
Non-Random
sampling
• Choice of
sample group
by researcher.
Probability
sampling
techniques
Simple Random
Stratified Random
Systematic
Sequential
Cluster / Multi stage
Each
group
sample unit in
has equal
being
chance of
selected & probability
accurately determined
Absence of systematic Bias & more representativeness
7.a.TYPES OF SAMPLING….. PROBABILITY
6/11/2020
14
7. a. TYPES OF SAMPLING….. PROBABILITY…..
Probability / Random Sampling - ‘4S’C
Simple
Random
Stratified
Random
Systematic Cluster Sequential
Proportionate Disproportionate
One - Stage
Two - Stage
Multi - Stage
7.a.1.Simple Random Sampling
Basic design, identify accessible
population & prepare sampling
frame.
Each member in frame equal
probability of selection.
 Techniques
 Lottery method,
 Table of random numbers
 Use of computers
Equal chance for drawing
each unit
7.a.TYPES OF SAMPLING- PROBABILITY…
6/11/2020 16
7.a. TYPES OF SAMPLING….. PROBABILITY
7.a.1.Simple Random Sampling - LOTTERY METHOD
 Each member attributed to
Unique number.
 All Unique number placed
through
inside hat or bowl, blended
manner
chosen by the
become the
Number
researcher
subjects.
6/11/2020 17
7.a.1.Simple Random Sampling - RANDOM NUMBERS
 Include each sample number
/ Name list
Each sample number/name
placed in table
Number chosen - become
subjects.
Replacement/ Non
replacement method possible.
7.a.TYPES OF SAMPLING- PROBABILITY…
6/11/2020 18
7.a.1.Simple Random Sampling – Use of computers
 Large samples - Computer
aided random selection
 Software - MINITAB and
Excel, SPSS.
 Replacement
replacement
possible
/ Non
method
7.a.TYPES OF SAMPLING- PROBABILITY…
⚫ Heterogenous population
more groups of
⚫ Divide two or
homogenous population
subgroups/strata based
called
on
criterion randomly selects subjects
⚫ Weightage sample/proportion
◦ Proportionate
◦ Disproportionate
7.a.2. Stratified Random Sampling
7.a.TYPES OF SAMPLING- PROBABILITY…
Ex- Assess the relationship between the Obesity and D
6/1
i1
a
/2
b
02
e
0tes in selected community 19
to all
size of all population.
 Fraction Not equal
subgroups
Example of Proportionate & Dis Proportionate
stratified random sampling
Proportionate Dis-
Proportionate
STARTUM A B C A B C
Population
size
100 200 300 100 200 300
Sampling
fraction
1/2 1/2 1/2 1/2 1/4 1/6
Final
sample
size
50 100 150 50 50 50
7.a.2. Stratified Random Sampling…..
a. PROPORTIONATE
 Subjects in proportion to size
of equal to all population.
 Fraction equal to all
subgroups
b. DISPROPORTIONATE
 Subjects Not proportion to
7.a.TYPES OF SAMPLING- PROBABILITY…
Ex- Assess the relationship between the Obesity and Diabetes in selected community 20
6/11/2020 21
7.a.TYPES OF SAMPLING- PROBABILITY…
7.a.3. Systematic Random Sampling
Sample members selected by
random in starting point and fixed
as per Sampling interval
K= Number of subjects in target population (N)
Size of Sample (n)
 Selection every kth (case) subject
from list are selected as samples .
22
7.a.3. Systematic Random Sampling…..
K=N / n
Example:
N = 1200 and n = 60
Interval = 1200/60 = 20
Randomly select a number between 1 and 20
 1st person selected = the 8th on the list
2nd person = 8 + 20 = the 28th
3nd person = 28 + 20 = the 48th
 4th person = 48 + 20 = the 68th etc……
6/11/2020
7.a.TYPES OF SAMPLING- PROBABILITY…
⚫Select subjects ,
probability technique
based on
such as
6/11/2020 23
7.a.4. Cluster / Multi stage Sampling
⚫ Large population - states, cities,
districts.
⚫Target population – divide to
subpopulations / clusters
7.a.TYPES OF SAMPLING- PROBABILITY…
Simple/ Stratified random sampling.
Ex- Assess the level of stress among school going adolescents in selected schools .
7.a.TYPES OF SAMPLING- PROBABILITY…..
7.a.4. Cluster / Multi stage Sampling…..
⚫One stage - all the elements within
cluster are selected as final sample
& all individual units as subjects.
⚫Two stage - randomly select some
clusters
population,
first from the
then use simple
given
and
stratified random sampling to select
subjects as per inclusion.
⚫Multi stage - more than two levels
- Ex –Nation ,Cites & districts
Ex- Assess the level of stress among school going adolescents in selected schools, Tamilnadu
6/11/2020 24
25
No.of.
Subject
s
Smoker
(A)
Non
Smoker
(B)
Having
Corona
A B
20 7 12 2 1
30 18 22 5 3
60 28 23 10 4
110 53 57 17 8
7.a.5. Sequential Sampling
 Sample size not fixed
 Start with small sample
and tries to get inferences
 If not able to draw and add
more subjects until
7.a.TYPES OF SAMPLING- PROBABILITY…
inferences drawn
Ex- Assess the risk factor of acquiring of corona in COVID 19 clients
6/11/2020
Non
probability
sampling
techniques
Convenient
Purposive /
Judgmental
Quota sampling
Snow ball
Consecutive
Population - not give
all individuals equal
being
chances of
selected.
Chosen by choice not by chance
7. TYPES OFSAMPLING….. 7. b. NONPROBABILITY
27
7.b.1. Convenience Sampling
Researcher accessible /
Proximity.
Accidental sampling- Subjects
are chosen simple way easy to
recruit.
Fast, Inexpensive & less time
consuming.
Ex - Assess the attitude of mental illness among geriatric people..
6/11/2020
7.b.2.Purposive Sampling
⚫ Recruits
“purpose” in
subjects with
mind who fit
their criteria.
⚫ Selection based on
experience or knowledge of
group to be sampled…
⚫Judgmental / Authoritative
sampling”.
Ex – Assess level of depression among COVID 19 patients in chennai
. Depends on trait considered
basis of quota
Ex-age, gender, education, religion
and socio economic status.
equal or
representation
Identifies
proportionate
of subjects
7.b.3.Quota Sampling
Ex – Assess level of self esteem among B.Sc Nursing College students
7.b.4. Consecutive Sampling
⚫Small size population
⚫All available subjects who are
meeting the preset inclusion
and exclusion criteria.
⚫ Total Enumerative sampling
Example: Assess QOL of post kidney transplant patients
 Initial potential sample members
7.b.5.Snowball Sampling
and they are asked to refer other
members who meet the eligibility
criteria.
Study participants continues
participant referrals otherwise it
difficult to identify.
 Network / Chain referral sampling
Ex – Assess the QOL among transgenders
7.b.5.Snowball Sampling -Types
 Linear
Subject refers only one other subject
 Exponential Non-Discriminative
Subject gives multiple referrals and
each referral gives some more until
required sample size is reached.
⚫Exponential discriminative
Subject refers multiple people but only
one is chosen as sample
6/11/2020 33
SAMPLING
TECHNIQUES
USED IN
QUALITATIVE
DESIGN
6/11/2020 34
7. SAMPLING– QUALITATIVE METHOD
Ex – Assess lived experiences of COVID 19 patients in selected settings
8.STRENGTHS & W
EAKNESSES
PROBABILITY SAMPLING
Strengths
⚫ Representative samples
⚫ Estimate the level of sampling
error
⚫ Reduce selection bias
⚫ Stronger design
Weaknesses
⚫ Difficult to construct sampling
frame
⚫ Expensive
⚫ Inconvenience and complexity
⚫ Time consuming
NON PROBABILITY SAMPLING
Strengths
⚫ Low cost
⚫ Convenient
⚫ Not time consuming
Weaknesses
⚫ Selection bias
⚫ Sample not representative
⚫ Does not allow
generalization
⚫ Subjective
⚫ Weaker design
6/11/2020 35
6/11/2020 36
9.SAMPLE SIZE
9. Need sample size estimation
 Mathematical estimation of the subjects /units.
 Small sample - fail to detect significant inferences
 Large sample - wastage resources.
 Optimum size is required for
 Appropriate analysis.
 Accuracy
 Validity of significance test
 Generalization
9.SAMPLE SIZE DETERMINATION
6/11/2020 37
Formula/
Power
Analysis
Nomo
grams
(Chart)
Computer
software
Ex: Epi-info,
Raosoft
9.Quantitative studies – No Thumb Rule
SAMPLE SIZE
Ready Made
Table
6/11/2020 38
9.SAMPLE SIZE DETERMINATION …..
9. Quantitative studies – 1.Using Table.
9.SAMPLE SIZE DETERMINATION …..
9. Quantitative studies – 2.Nomograms
• Nomogram – Nomograph or
alignment chart,, is a graphical
calculating
dimensional
device, a two-
diagram designed
for experimental study.
• The research should decide the
sample size based on effect
that is clinically important to
detect.
9. Quantitative studies – 3.POWER ANALYSIS
⚫Determine effects of the study to
detect differences or
relationships that actually exist
in the population
⚫ Measure capacity to accept or
reject a null hypothesis
⚫ Minimum acceptable power - 80
9.SAMPLE SIZE DETERMINATION …..
6/11/2020 41
9.SAMPLE SIZE DETERMINATION
Estimation of Sample size – 3.Power Analysis
Requirements for calculating sample size
⚫n = sample size
⚫N = size of the eligible population
⚫t2 = square value of the standard
deviation score
⚫P = % population which we computing
the sample size
⚫q = 1-p (remaining % of Population)
⚫d2 = confidence interval
n = (1- n / N) X t2 ( p X q)
Descriptive study
8.SAMPLE SIZE DETERMINATION
8. Quantitative studies – 3.POWER ANALYSIS
d2
Confidence Interval calculation
6/11/2020 43
9. Quantitative studies – 3.Formula
9.SAMPLE SIZE DETERMINATION …..
6/11/2020 44
9. Quantitative studies – 4. Using Computer
• Rao soft
9.SAMPLE SIZE DETERMINATION …..
6/11/2020 45
9.SAMPLE SIZE DETERMINATION
8. Quantitative studies – Using Computer….
Automated
software program
Calculate required
sample size
6/11/2020 46
 Data saturation
 Numbers of factors
Scope of research
9. Qualitative study
 Thumb Rule
10 to less
20 to 30
25 to 50
9.SAMPLE SIZE DETERMINATION …..
1 to 3
based on
theme
10-50
10. SAMPLINGERRORS
Sampling error
selected sample
deviation of
from true
characteristics, traits,
figures of
behaviors,
entire
qualities or
population
⚫ Non-sampling Error
Biases and mistakes in selection of
sample.
⚫ Sampling Error:
Difference
and population
between
values
sample
considered
as sampling error.,
Subset - Individual differences, random
and systematic error
10. M
INIMIZEOF SAMPLINGERRORS …..
 Prepare updated sampling frame
 Use appropriate probability sampling
Technique.
 Minimizes the stages sampling.
 Appropriate sample size
Small – Increase sampling error
Large – decrease sampling error
 Reduction Attrition rates
6/11/2020 49
11. FACTORS AFFECTINGSAMPLINGPROCESS
Sampling is the part of every day life
 Adopt the requirement of
 Use probability sample methods
 Appropriate sample size
 Saves budget & time Saves
budget & time.
 Reduce sampling errors & enhance
quality of research
10. CONCLUSION
REFERENCES
 Creswell, J., W. (2012) Educational research:


Planning, Conducting, and Evaluating Quantitative
and Qualitative Research, 4th ed.
 Patton, M.Q. (2002). Qualitative Research and
Evaluation Methods. Thousand Oaks, CA: Sage.
Suresh K sharma (2016) .Nursing research and
staistics, 2nd edition, Elseivers Publications
Parahoo K (2006) 2nd ed. Nursing Research:
Principles, Process and Issues Basingstock ,
Palgrave Macmillan
 Polit D, Hungler B (1991 ) 4th ed. Nursing
Research London Lippincott
6/11/2020 51
6/11/2020 52

Nursing Research Sampling Technique .pptx

  • 1.
    1 Methods of Sampling Prof.Dr.Chinna Chadayan.N RN.RM., B.Sc(N)., M.Sc (N)., Ph.D (N)., Professor Enam Nursing College Unit 14a Sampling
  • 2.
    1. INTRODUCTION  Samplingprocess of selecting portion of population to represent entire population  Representative Unit of entire population  Reflect study character of population.  Significant of statistical inferences Ex- Study to assess the prevalence of co morbidities of Diabetic patients 4 Sampling
  • 3.
    Purposes of sampling Economical Quick study result Precision and Accuracy Improved quality of data Togather data from population in order to make an inferences that can be generalized 3.PURPOSES
  • 4.
    Representative Free from biasand errors No substitution & Incompleteness Appropriate sample size 4.CHARACTERISTICS OF GOODSAMPLE 1 2 3 4
  • 5.
    5.PRINCIPLES PRINCIPLES OF SAMPLING Law of Statistical Regularity Law of Inertiaof Large Numbers 6/11/2020 More Accurate results 9 Select Sample Random
  • 6.
    Sample Sampling Plan Sample size Selection methods Samplingunit Describe Accessible population & Sampling Frame 6/11/2020 10 Define Population (Identify & Target) Constructing list 6.SAMPLINGPROCESS Probability/Non Probability Inclusion/Exclusion Representative Unit Chart of Plan Calculation based on formula Subjects
  • 7.
  • 8.
    7. TYPES OFSAMPLINGTECHNIQUES 6/11/2020 12 7.a Probability / Random sampling • Each sample unit in a group has an equal chance of being selected. 7.b Non-probability/ Non-Random sampling • Choice of sample group by researcher.
  • 9.
    Probability sampling techniques Simple Random Stratified Random Systematic Sequential Cluster/ Multi stage Each group sample unit in has equal being chance of selected & probability accurately determined Absence of systematic Bias & more representativeness 7.a.TYPES OF SAMPLING….. PROBABILITY
  • 10.
    6/11/2020 14 7. a. TYPESOF SAMPLING….. PROBABILITY….. Probability / Random Sampling - ‘4S’C Simple Random Stratified Random Systematic Cluster Sequential Proportionate Disproportionate One - Stage Two - Stage Multi - Stage
  • 11.
    7.a.1.Simple Random Sampling Basicdesign, identify accessible population & prepare sampling frame. Each member in frame equal probability of selection.  Techniques  Lottery method,  Table of random numbers  Use of computers Equal chance for drawing each unit 7.a.TYPES OF SAMPLING- PROBABILITY…
  • 12.
    6/11/2020 16 7.a. TYPESOF SAMPLING….. PROBABILITY 7.a.1.Simple Random Sampling - LOTTERY METHOD  Each member attributed to Unique number.  All Unique number placed through inside hat or bowl, blended manner chosen by the become the Number researcher subjects.
  • 13.
    6/11/2020 17 7.a.1.Simple RandomSampling - RANDOM NUMBERS  Include each sample number / Name list Each sample number/name placed in table Number chosen - become subjects. Replacement/ Non replacement method possible. 7.a.TYPES OF SAMPLING- PROBABILITY…
  • 14.
    6/11/2020 18 7.a.1.Simple RandomSampling – Use of computers  Large samples - Computer aided random selection  Software - MINITAB and Excel, SPSS.  Replacement replacement possible / Non method 7.a.TYPES OF SAMPLING- PROBABILITY…
  • 15.
    ⚫ Heterogenous population moregroups of ⚫ Divide two or homogenous population subgroups/strata based called on criterion randomly selects subjects ⚫ Weightage sample/proportion ◦ Proportionate ◦ Disproportionate 7.a.2. Stratified Random Sampling 7.a.TYPES OF SAMPLING- PROBABILITY… Ex- Assess the relationship between the Obesity and D 6/1 i1 a /2 b 02 e 0tes in selected community 19
  • 16.
    to all size ofall population.  Fraction Not equal subgroups Example of Proportionate & Dis Proportionate stratified random sampling Proportionate Dis- Proportionate STARTUM A B C A B C Population size 100 200 300 100 200 300 Sampling fraction 1/2 1/2 1/2 1/2 1/4 1/6 Final sample size 50 100 150 50 50 50 7.a.2. Stratified Random Sampling….. a. PROPORTIONATE  Subjects in proportion to size of equal to all population.  Fraction equal to all subgroups b. DISPROPORTIONATE  Subjects Not proportion to 7.a.TYPES OF SAMPLING- PROBABILITY… Ex- Assess the relationship between the Obesity and Diabetes in selected community 20
  • 17.
    6/11/2020 21 7.a.TYPES OFSAMPLING- PROBABILITY… 7.a.3. Systematic Random Sampling Sample members selected by random in starting point and fixed as per Sampling interval K= Number of subjects in target population (N) Size of Sample (n)  Selection every kth (case) subject from list are selected as samples .
  • 18.
    22 7.a.3. Systematic RandomSampling….. K=N / n Example: N = 1200 and n = 60 Interval = 1200/60 = 20 Randomly select a number between 1 and 20  1st person selected = the 8th on the list 2nd person = 8 + 20 = the 28th 3nd person = 28 + 20 = the 48th  4th person = 48 + 20 = the 68th etc…… 6/11/2020 7.a.TYPES OF SAMPLING- PROBABILITY…
  • 19.
    ⚫Select subjects , probabilitytechnique based on such as 6/11/2020 23 7.a.4. Cluster / Multi stage Sampling ⚫ Large population - states, cities, districts. ⚫Target population – divide to subpopulations / clusters 7.a.TYPES OF SAMPLING- PROBABILITY… Simple/ Stratified random sampling. Ex- Assess the level of stress among school going adolescents in selected schools .
  • 20.
    7.a.TYPES OF SAMPLING-PROBABILITY….. 7.a.4. Cluster / Multi stage Sampling….. ⚫One stage - all the elements within cluster are selected as final sample & all individual units as subjects. ⚫Two stage - randomly select some clusters population, first from the then use simple given and stratified random sampling to select subjects as per inclusion. ⚫Multi stage - more than two levels - Ex –Nation ,Cites & districts Ex- Assess the level of stress among school going adolescents in selected schools, Tamilnadu 6/11/2020 24
  • 21.
    25 No.of. Subject s Smoker (A) Non Smoker (B) Having Corona A B 20 712 2 1 30 18 22 5 3 60 28 23 10 4 110 53 57 17 8 7.a.5. Sequential Sampling  Sample size not fixed  Start with small sample and tries to get inferences  If not able to draw and add more subjects until 7.a.TYPES OF SAMPLING- PROBABILITY… inferences drawn Ex- Assess the risk factor of acquiring of corona in COVID 19 clients 6/11/2020
  • 22.
    Non probability sampling techniques Convenient Purposive / Judgmental Quota sampling Snowball Consecutive Population - not give all individuals equal being chances of selected. Chosen by choice not by chance 7. TYPES OFSAMPLING….. 7. b. NONPROBABILITY
  • 23.
    27 7.b.1. Convenience Sampling Researcheraccessible / Proximity. Accidental sampling- Subjects are chosen simple way easy to recruit. Fast, Inexpensive & less time consuming. Ex - Assess the attitude of mental illness among geriatric people.. 6/11/2020
  • 24.
    7.b.2.Purposive Sampling ⚫ Recruits “purpose”in subjects with mind who fit their criteria. ⚫ Selection based on experience or knowledge of group to be sampled… ⚫Judgmental / Authoritative sampling”. Ex – Assess level of depression among COVID 19 patients in chennai
  • 25.
    . Depends ontrait considered basis of quota Ex-age, gender, education, religion and socio economic status. equal or representation Identifies proportionate of subjects 7.b.3.Quota Sampling Ex – Assess level of self esteem among B.Sc Nursing College students
  • 26.
    7.b.4. Consecutive Sampling ⚫Smallsize population ⚫All available subjects who are meeting the preset inclusion and exclusion criteria. ⚫ Total Enumerative sampling Example: Assess QOL of post kidney transplant patients
  • 27.
     Initial potentialsample members 7.b.5.Snowball Sampling and they are asked to refer other members who meet the eligibility criteria. Study participants continues participant referrals otherwise it difficult to identify.  Network / Chain referral sampling Ex – Assess the QOL among transgenders
  • 28.
    7.b.5.Snowball Sampling -Types Linear Subject refers only one other subject  Exponential Non-Discriminative Subject gives multiple referrals and each referral gives some more until required sample size is reached. ⚫Exponential discriminative Subject refers multiple people but only one is chosen as sample
  • 29.
  • 30.
    6/11/2020 34 7. SAMPLING–QUALITATIVE METHOD Ex – Assess lived experiences of COVID 19 patients in selected settings
  • 31.
    8.STRENGTHS & W EAKNESSES PROBABILITYSAMPLING Strengths ⚫ Representative samples ⚫ Estimate the level of sampling error ⚫ Reduce selection bias ⚫ Stronger design Weaknesses ⚫ Difficult to construct sampling frame ⚫ Expensive ⚫ Inconvenience and complexity ⚫ Time consuming NON PROBABILITY SAMPLING Strengths ⚫ Low cost ⚫ Convenient ⚫ Not time consuming Weaknesses ⚫ Selection bias ⚫ Sample not representative ⚫ Does not allow generalization ⚫ Subjective ⚫ Weaker design 6/11/2020 35
  • 32.
    6/11/2020 36 9.SAMPLE SIZE 9.Need sample size estimation  Mathematical estimation of the subjects /units.  Small sample - fail to detect significant inferences  Large sample - wastage resources.  Optimum size is required for  Appropriate analysis.  Accuracy  Validity of significance test  Generalization
  • 33.
    9.SAMPLE SIZE DETERMINATION 6/11/202037 Formula/ Power Analysis Nomo grams (Chart) Computer software Ex: Epi-info, Raosoft 9.Quantitative studies – No Thumb Rule SAMPLE SIZE Ready Made Table
  • 34.
    6/11/2020 38 9.SAMPLE SIZEDETERMINATION ….. 9. Quantitative studies – 1.Using Table.
  • 35.
    9.SAMPLE SIZE DETERMINATION….. 9. Quantitative studies – 2.Nomograms • Nomogram – Nomograph or alignment chart,, is a graphical calculating dimensional device, a two- diagram designed for experimental study. • The research should decide the sample size based on effect that is clinically important to detect.
  • 36.
    9. Quantitative studies– 3.POWER ANALYSIS ⚫Determine effects of the study to detect differences or relationships that actually exist in the population ⚫ Measure capacity to accept or reject a null hypothesis ⚫ Minimum acceptable power - 80 9.SAMPLE SIZE DETERMINATION …..
  • 37.
    6/11/2020 41 9.SAMPLE SIZEDETERMINATION Estimation of Sample size – 3.Power Analysis Requirements for calculating sample size
  • 38.
    ⚫n = samplesize ⚫N = size of the eligible population ⚫t2 = square value of the standard deviation score ⚫P = % population which we computing the sample size ⚫q = 1-p (remaining % of Population) ⚫d2 = confidence interval n = (1- n / N) X t2 ( p X q) Descriptive study 8.SAMPLE SIZE DETERMINATION 8. Quantitative studies – 3.POWER ANALYSIS d2 Confidence Interval calculation
  • 39.
    6/11/2020 43 9. Quantitativestudies – 3.Formula 9.SAMPLE SIZE DETERMINATION …..
  • 40.
    6/11/2020 44 9. Quantitativestudies – 4. Using Computer • Rao soft 9.SAMPLE SIZE DETERMINATION …..
  • 41.
    6/11/2020 45 9.SAMPLE SIZEDETERMINATION 8. Quantitative studies – Using Computer…. Automated software program Calculate required sample size
  • 42.
    6/11/2020 46  Datasaturation  Numbers of factors Scope of research 9. Qualitative study  Thumb Rule 10 to less 20 to 30 25 to 50 9.SAMPLE SIZE DETERMINATION ….. 1 to 3 based on theme 10-50
  • 43.
    10. SAMPLINGERRORS Sampling error selectedsample deviation of from true characteristics, traits, figures of behaviors, entire qualities or population ⚫ Non-sampling Error Biases and mistakes in selection of sample. ⚫ Sampling Error: Difference and population between values sample considered as sampling error., Subset - Individual differences, random and systematic error
  • 44.
    10. M INIMIZEOF SAMPLINGERRORS…..  Prepare updated sampling frame  Use appropriate probability sampling Technique.  Minimizes the stages sampling.  Appropriate sample size Small – Increase sampling error Large – decrease sampling error  Reduction Attrition rates
  • 45.
    6/11/2020 49 11. FACTORSAFFECTINGSAMPLINGPROCESS
  • 46.
    Sampling is thepart of every day life  Adopt the requirement of  Use probability sample methods  Appropriate sample size  Saves budget & time Saves budget & time.  Reduce sampling errors & enhance quality of research 10. CONCLUSION
  • 47.
    REFERENCES  Creswell, J.,W. (2012) Educational research:   Planning, Conducting, and Evaluating Quantitative and Qualitative Research, 4th ed.  Patton, M.Q. (2002). Qualitative Research and Evaluation Methods. Thousand Oaks, CA: Sage. Suresh K sharma (2016) .Nursing research and staistics, 2nd edition, Elseivers Publications Parahoo K (2006) 2nd ed. Nursing Research: Principles, Process and Issues Basingstock , Palgrave Macmillan  Polit D, Hungler B (1991 ) 4th ed. Nursing Research London Lippincott 6/11/2020 51
  • 48.