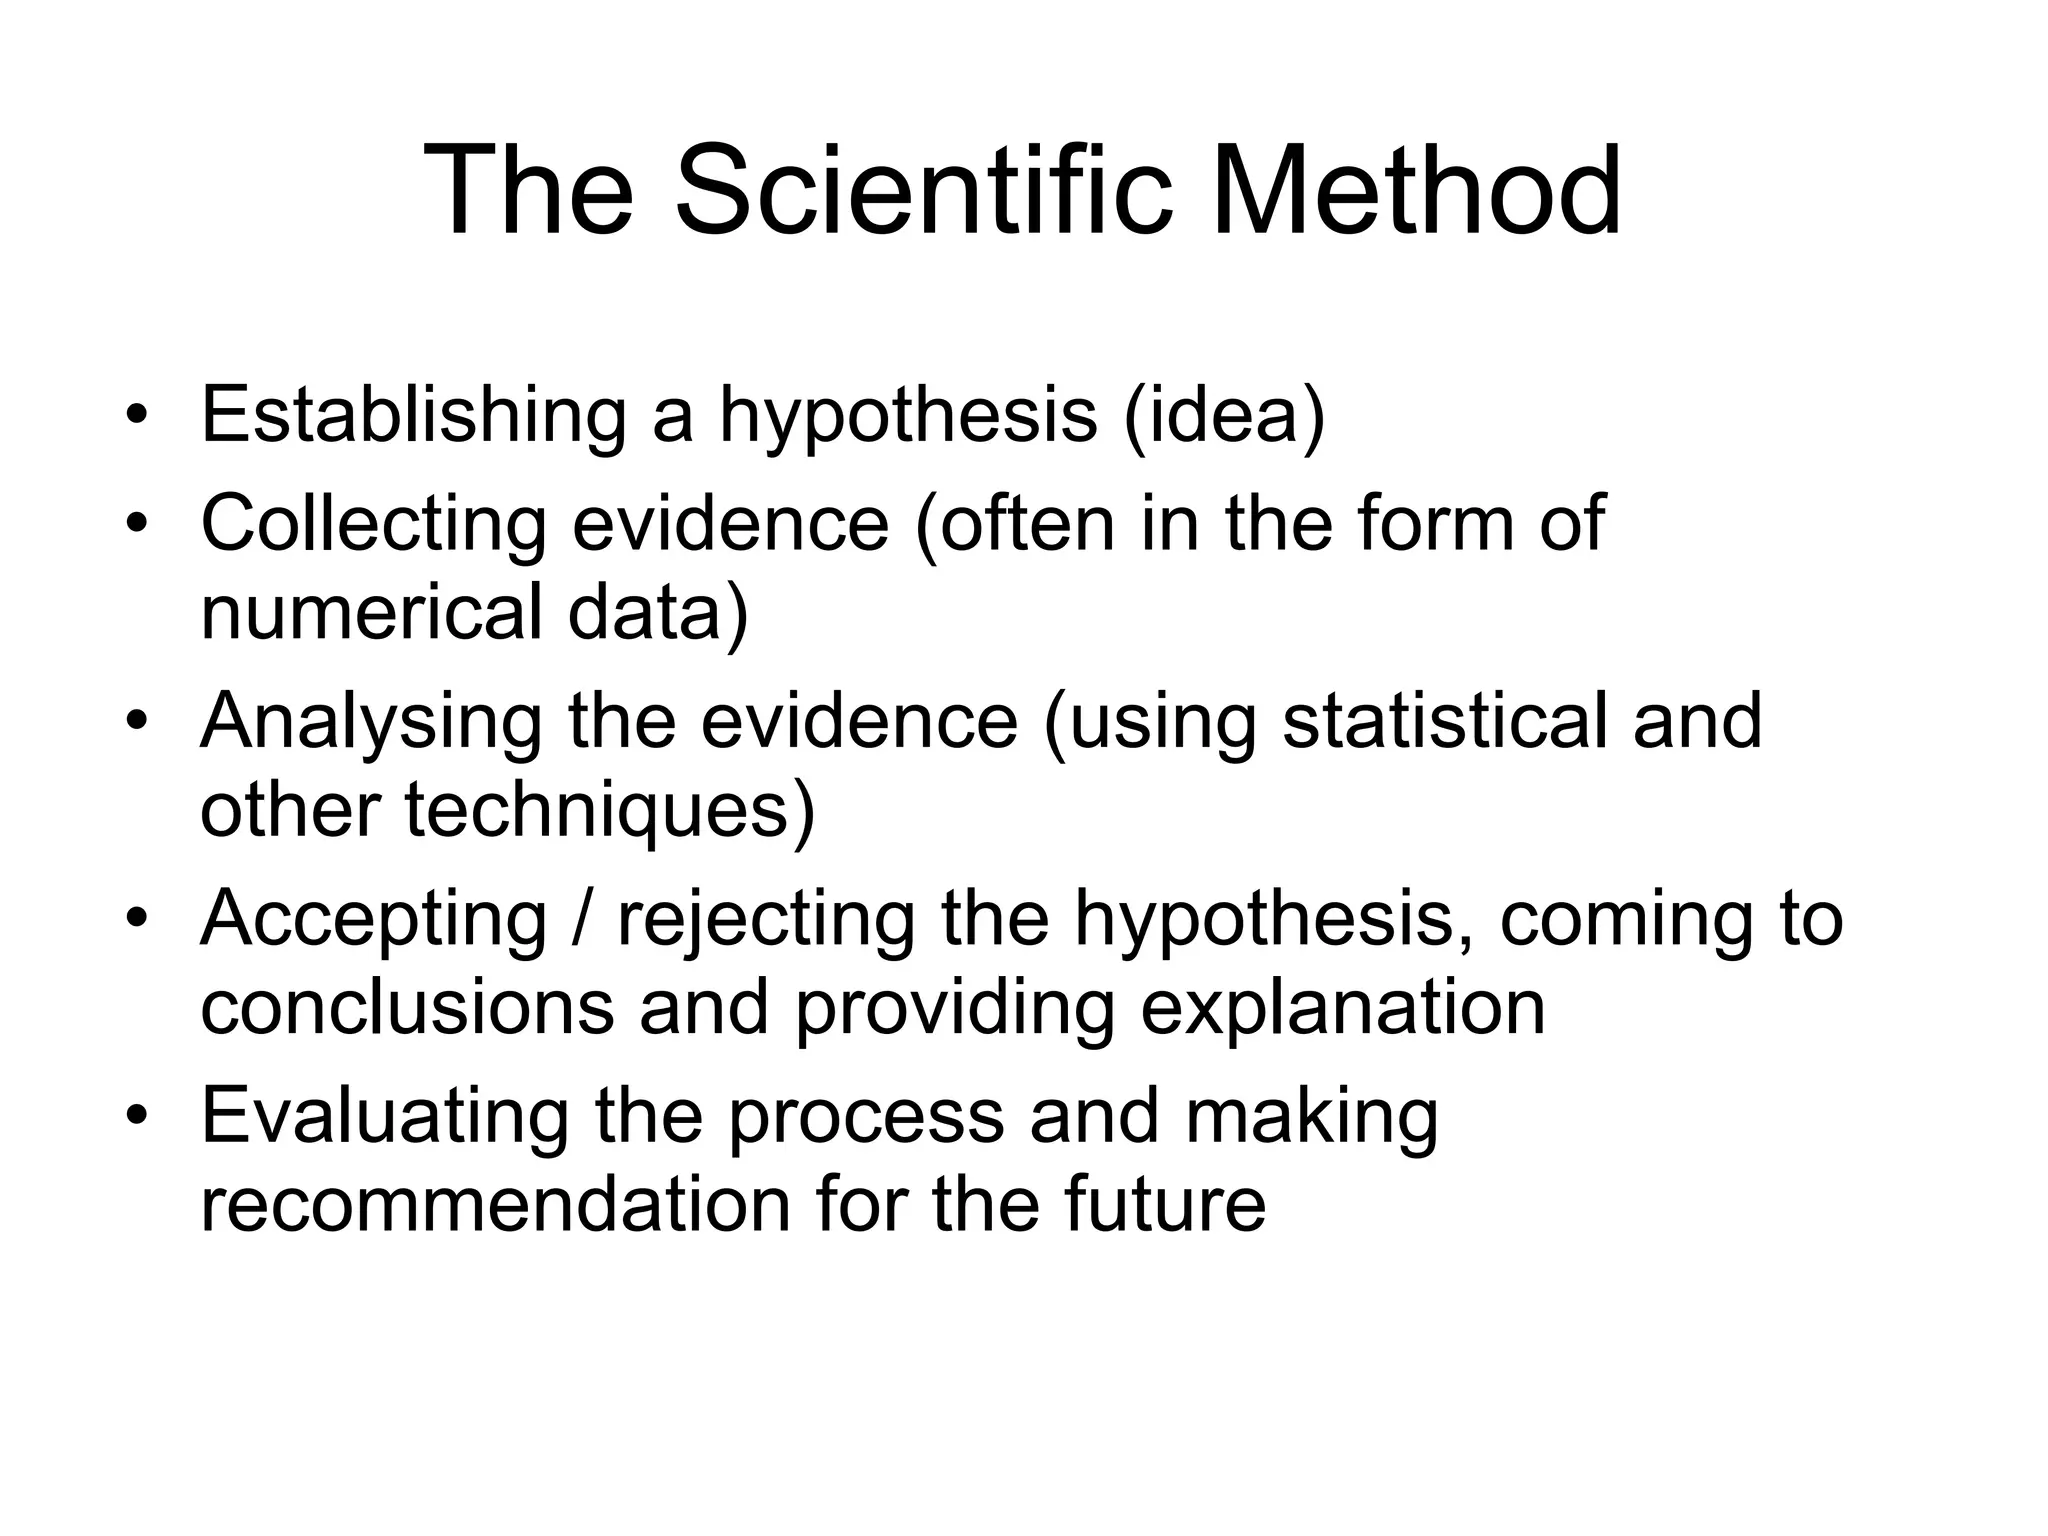
1. The document provides an overview of statistical analysis including the scientific method, common statistical terminology, hypotheses testing, choosing an appropriate statistical method, the normal distribution, and significance and confidence limits.
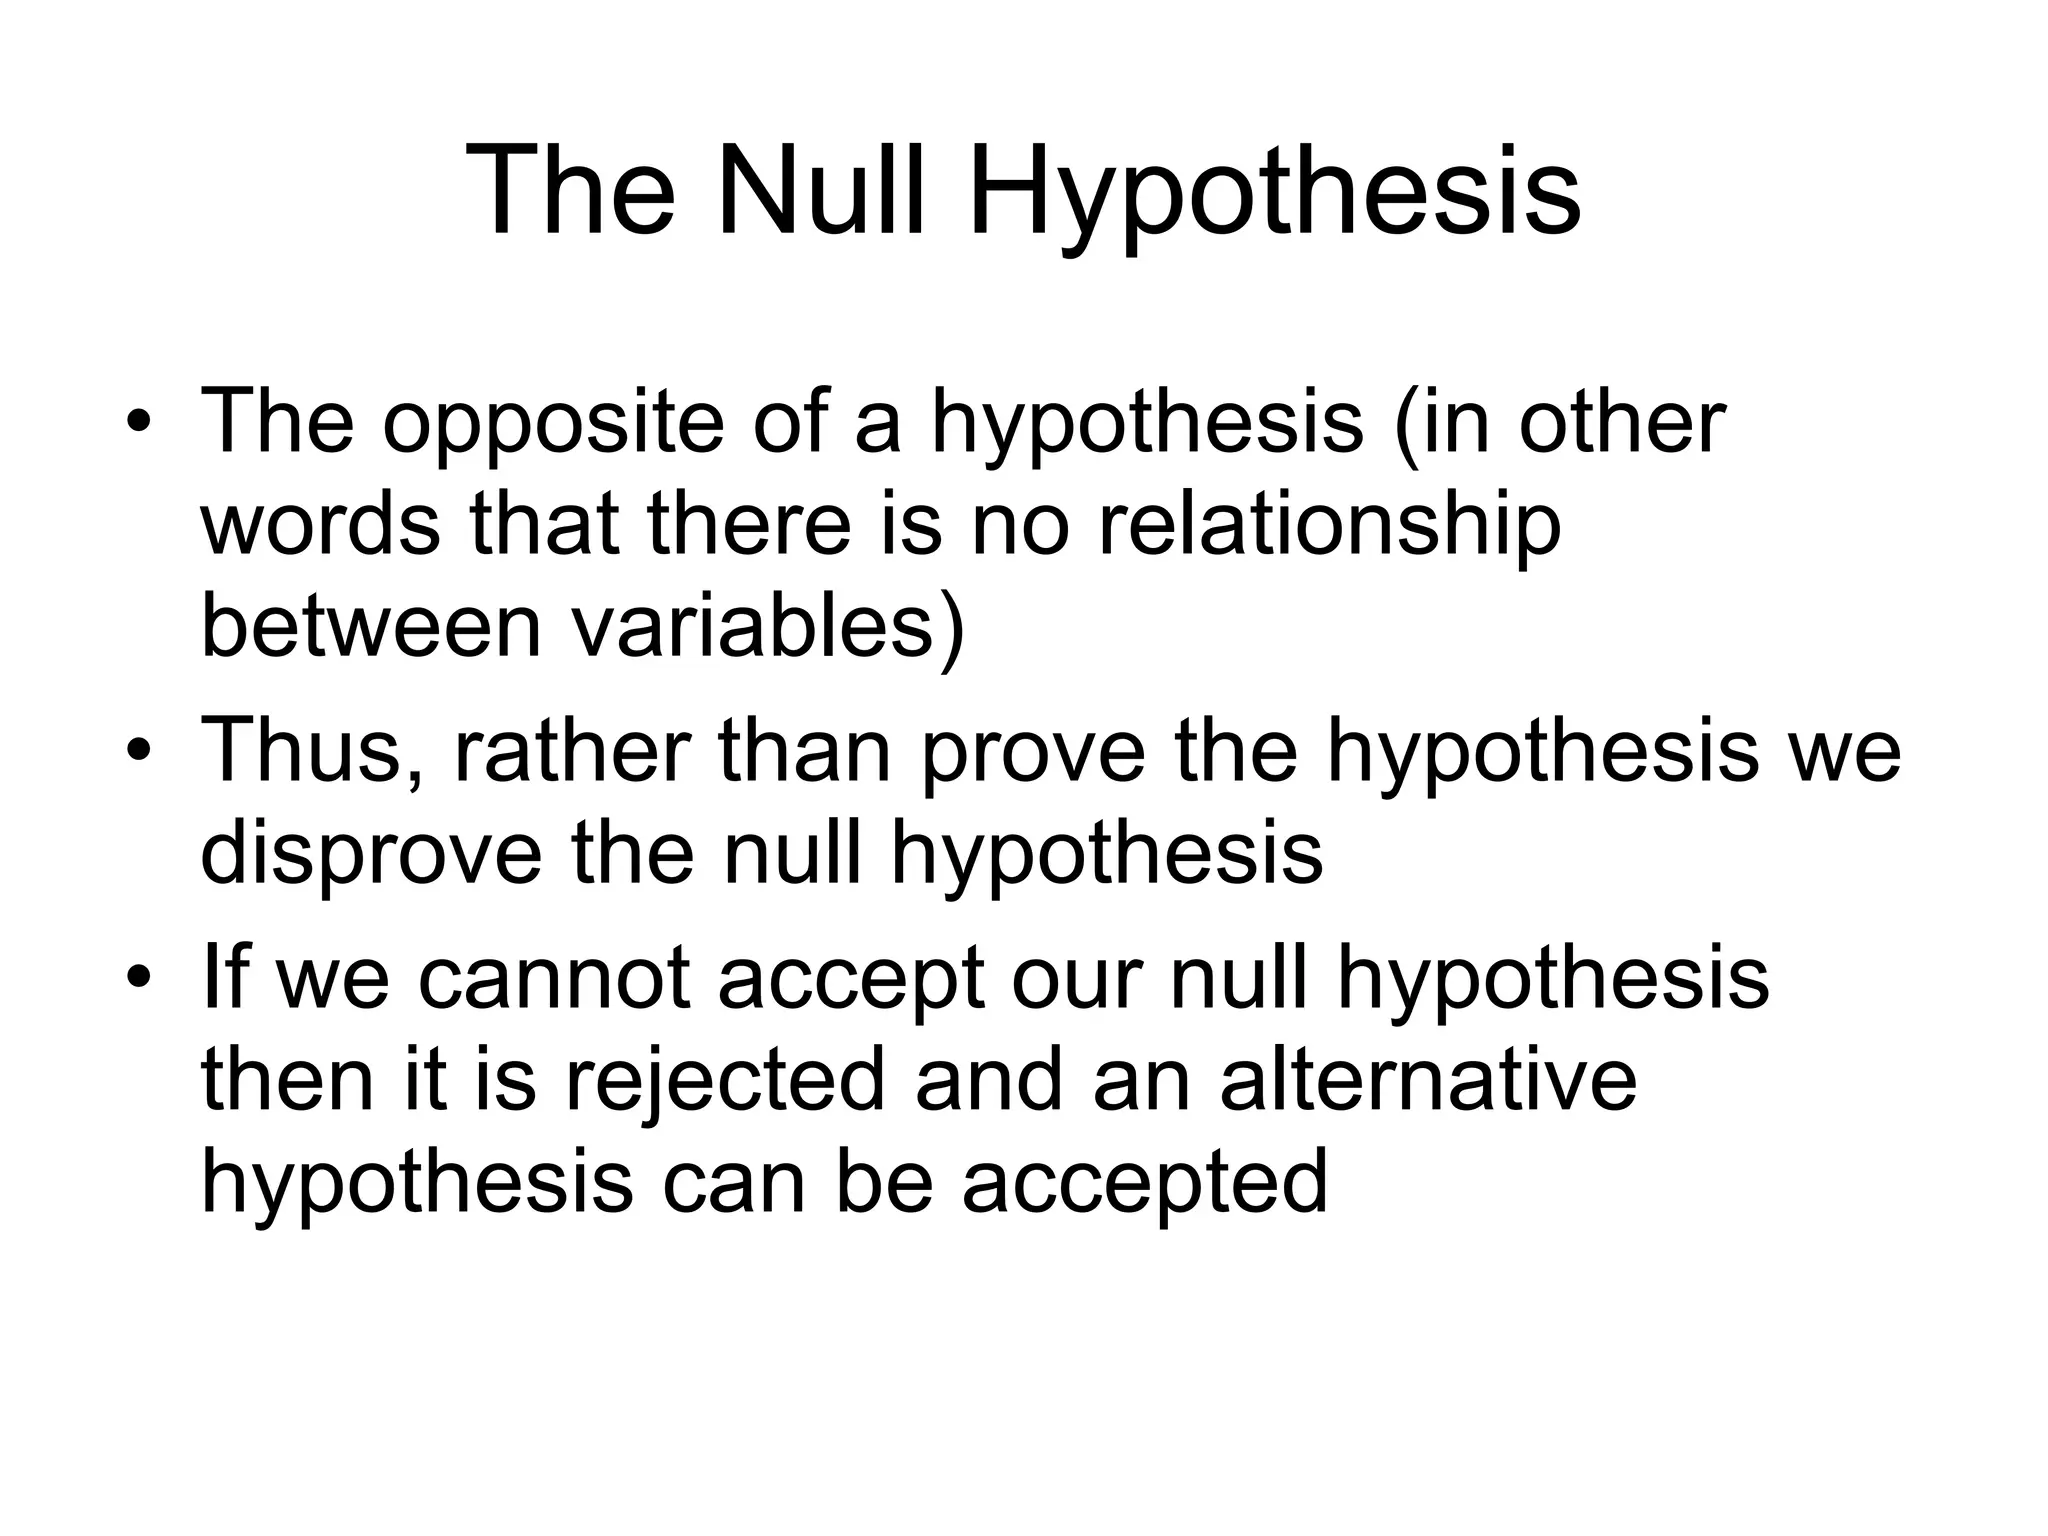
2. It explains key concepts like the null hypothesis, which is the opposite of the research hypothesis and is disproven through statistical testing.
3. Statistical methods depend on factors like the type of test needed, sample size, and data type, and whether tests of association, difference, or other analyses are required.