This document provides an overview of key concepts for analyzing medical data from a research perspective, including:
- Statistical concepts important for medical licensing exams like scales of measurement, distributions, hypothesis testing, and study designs.
- How to determine what data is available to answer a clinical question, locate existing datasets, and analyze/interpret findings using software like Excel and SPSS.
- Resources for further learning about epidemiology, health statistics, diagnostic tests, and using statistical software.
Analysis of MedicalData Research Perspective Nancy B. Clark. M.Ed. Director of Medical Informatics Education FSU College of Medicine Spring 2004 http://www.med.fsu.edu/informatics
2.
Objectives Review statisticalconcepts to be on Step 1. Determine what data exist relative to a clinical question or formal hypothesis use IT to locate existing data sources identify and locate existing data sets Within institution Outside institution Analyze, interpret and report findings Select and use appropriate computer software: Excel, SPSS Use software to perform simple statistical analysis and portray results graphically Interpret reports
3.
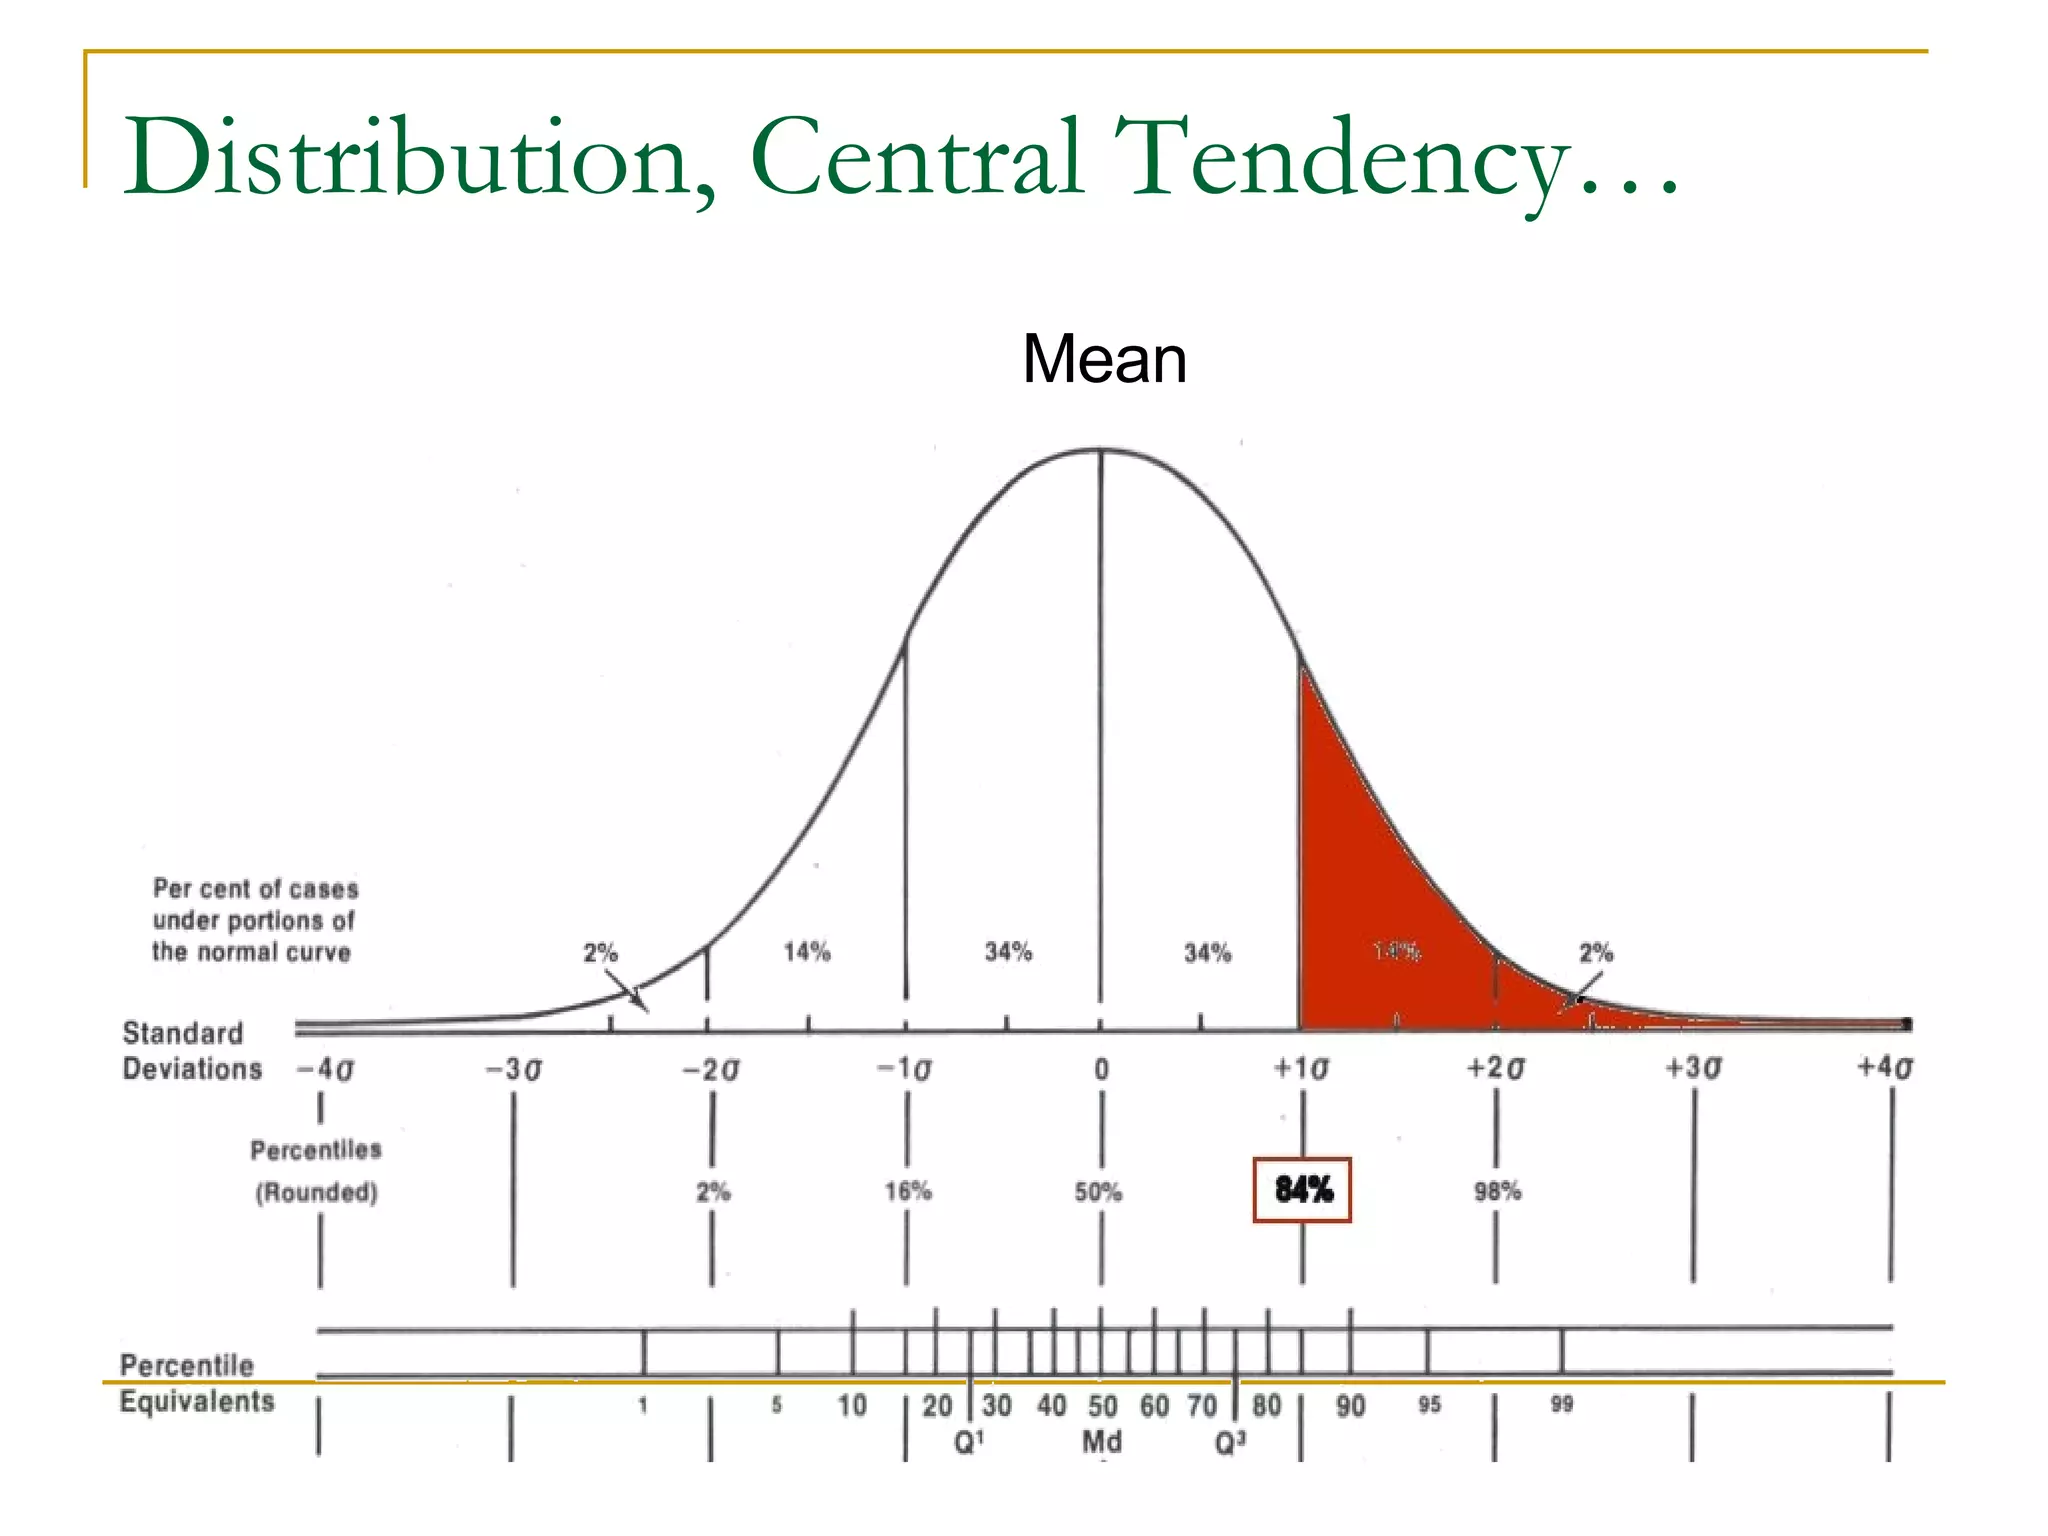
Prerequisite Skills (Step 1 USMLE) Fundamental concepts of measurement Scales of measurement Distribution, central tendency, variability, probability Disease prevalence and incidence Disease outcomes (eg, fatality rates) Associations (correlation or covariance) Health impact (eg, risk differences and ratios) Sensitivity, specificity, predictive values
4.
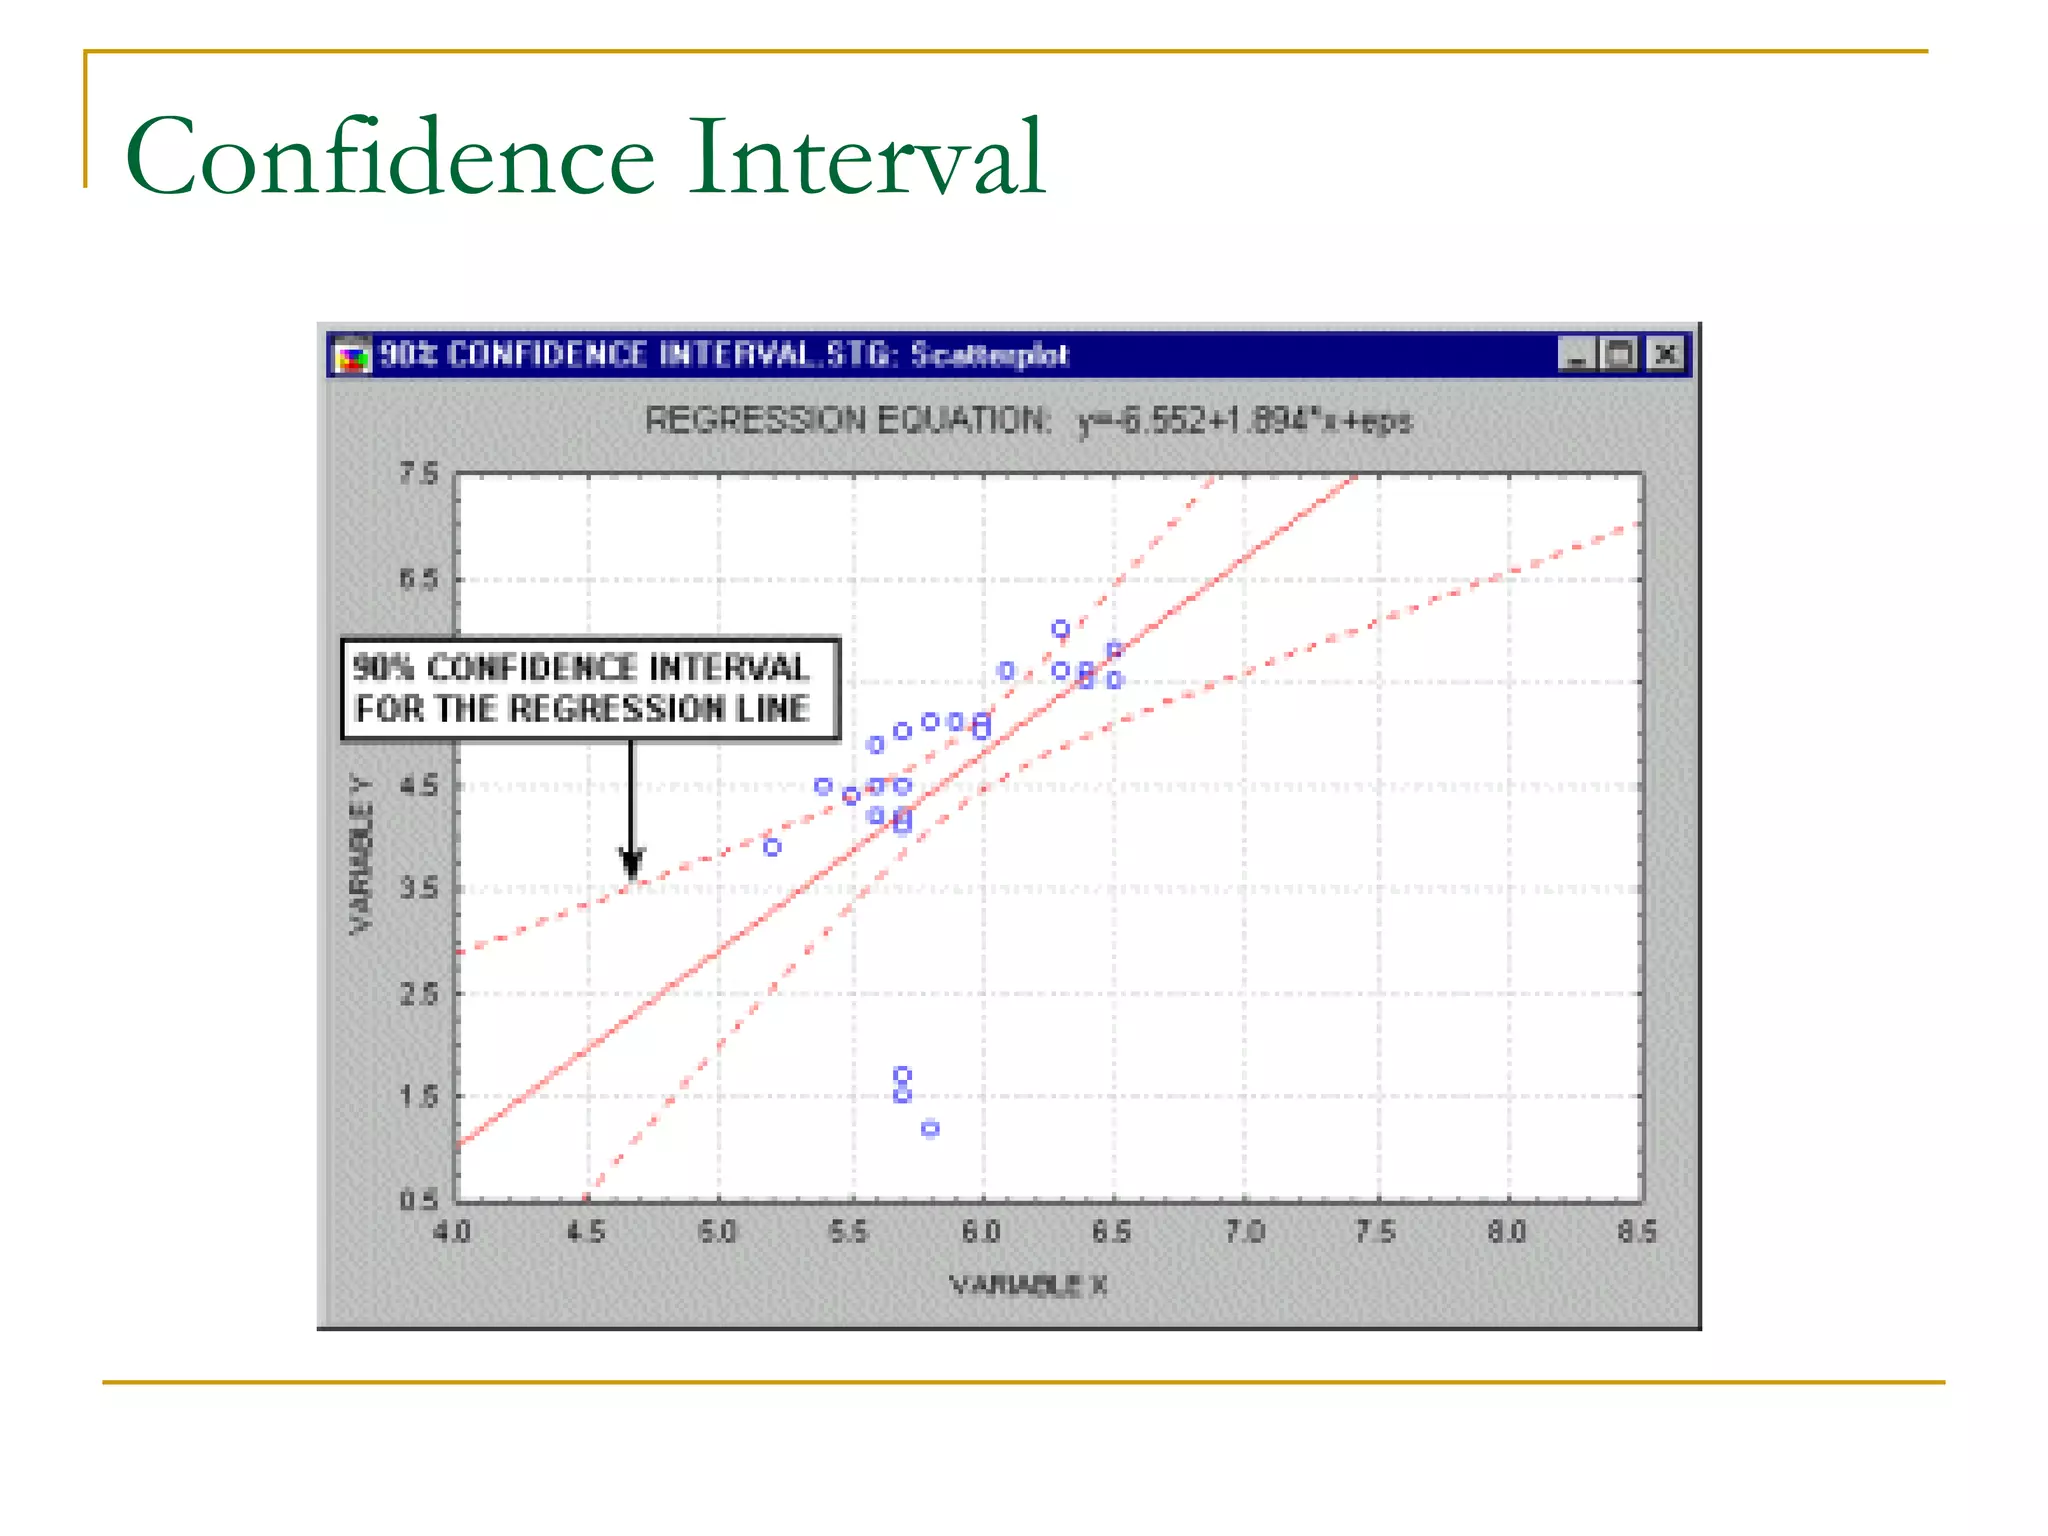
More Prerequisite Skills (Step 1 USMLE) Fundamental concepts of hypothesis testing and statistical inference Confidence intervals Statistical significance and type I error Statistical power and type II error
5.
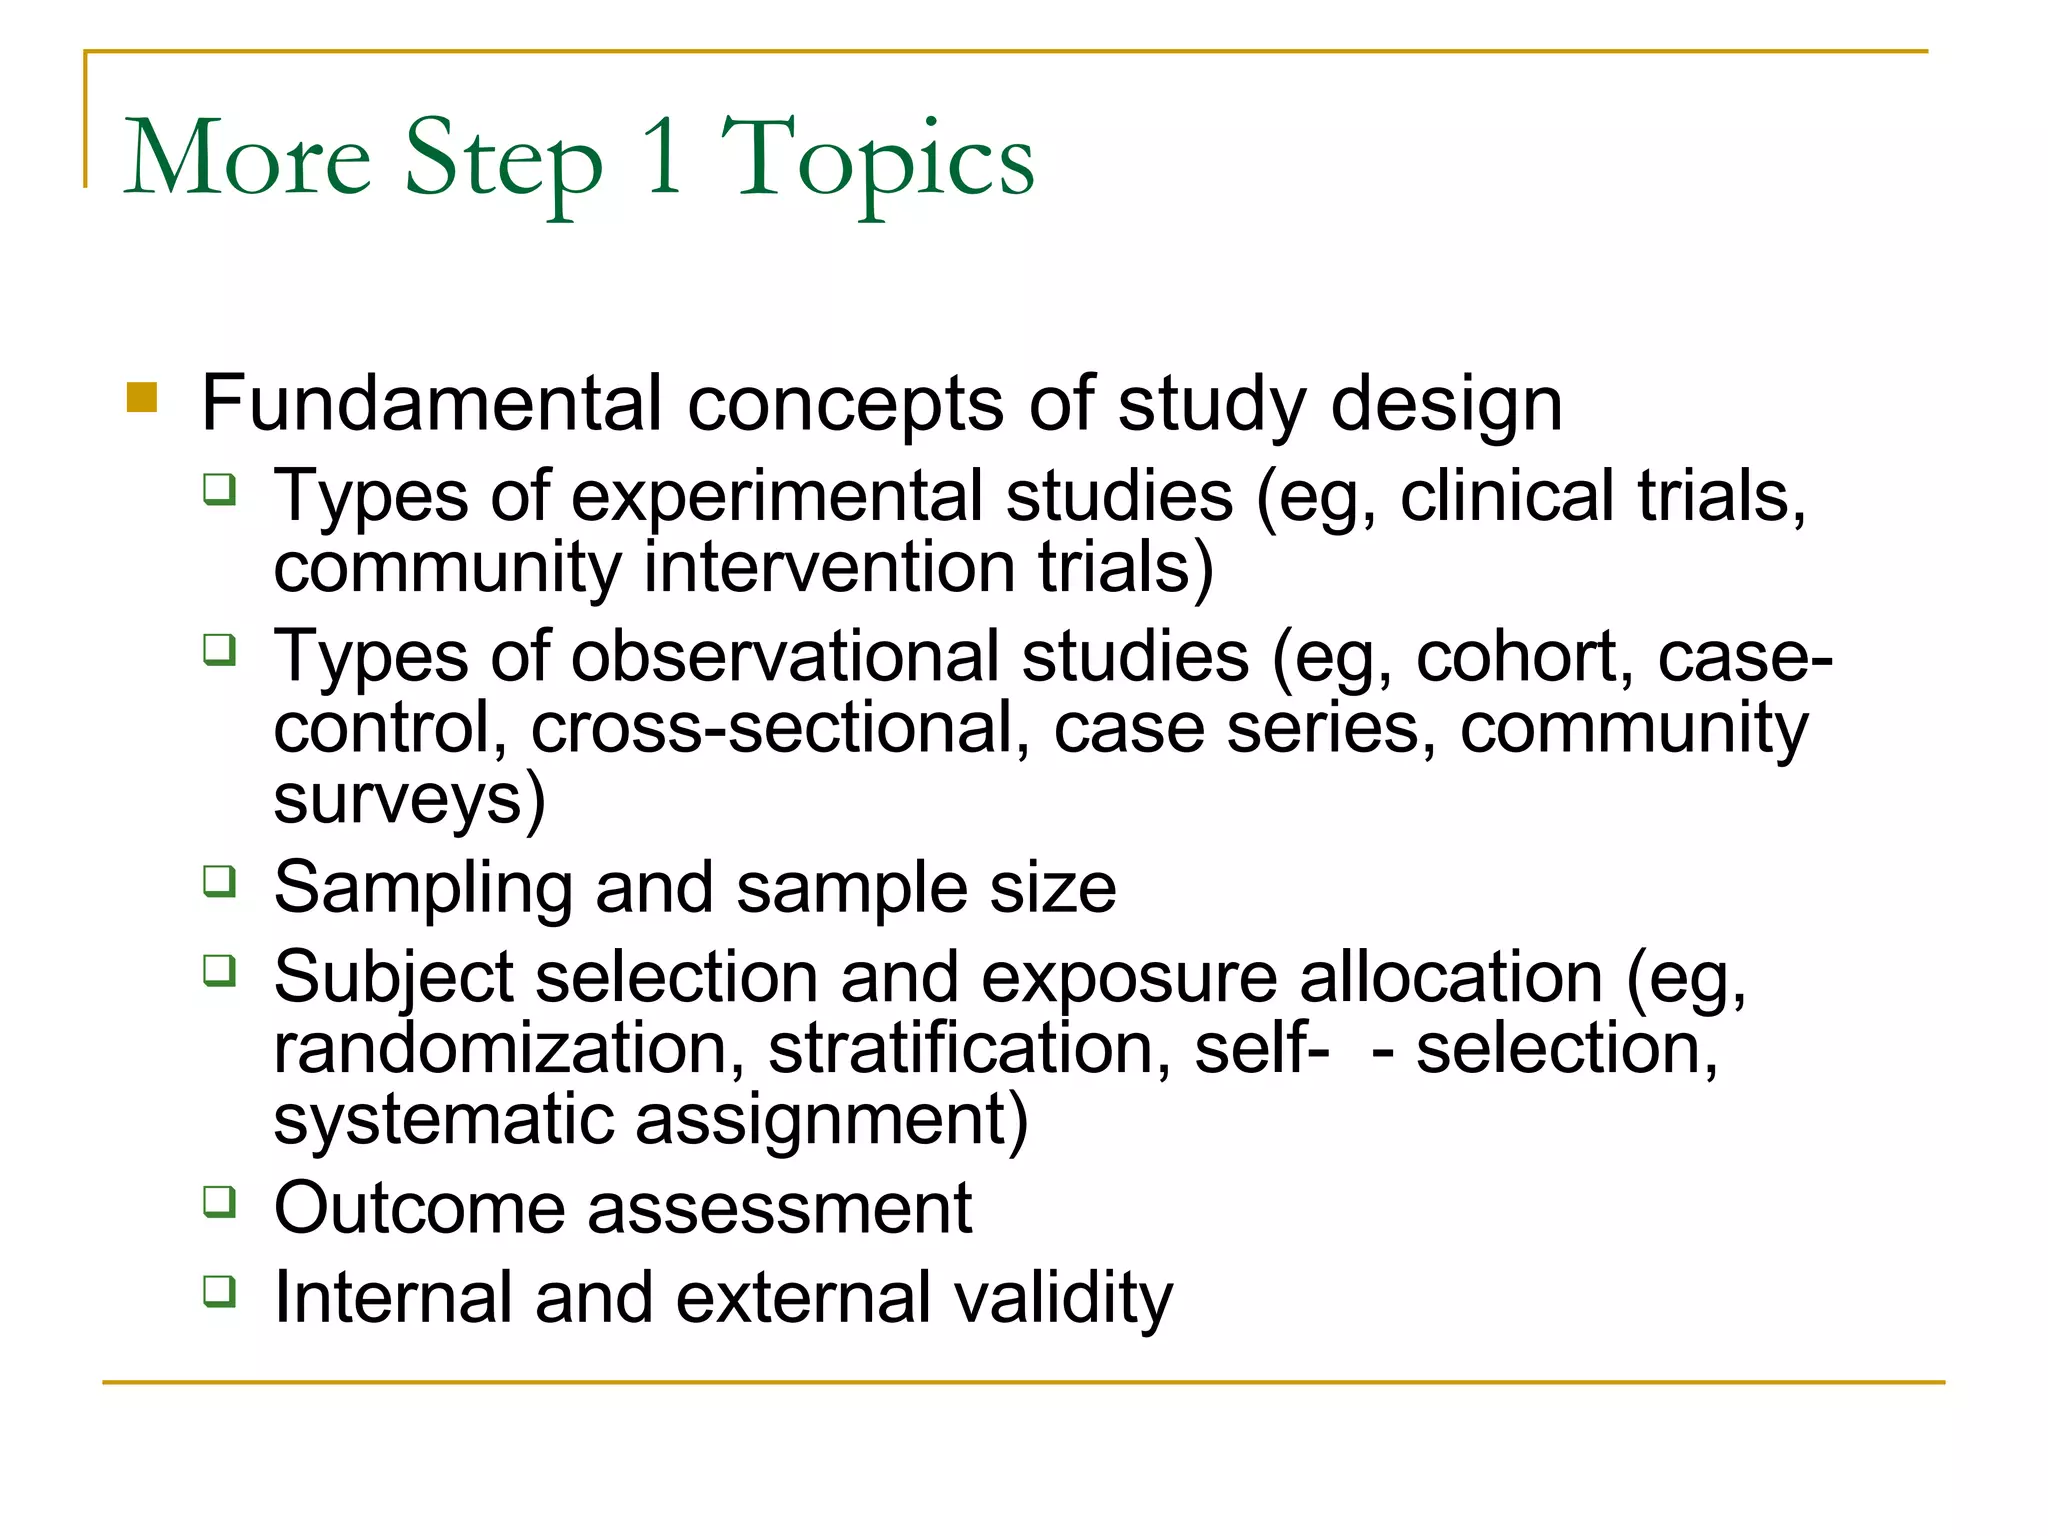
More Step 1Topics Fundamental concepts of study design Types of experimental studies (eg, clinical trials, community intervention trials) Types of observational studies (eg, cohort, case-control, cross-sectional, case series, community surveys) Sampling and sample size Subject selection and exposure allocation (eg, randomization, stratification, self- - selection, systematic assignment) Outcome assessment Internal and external validity
6.
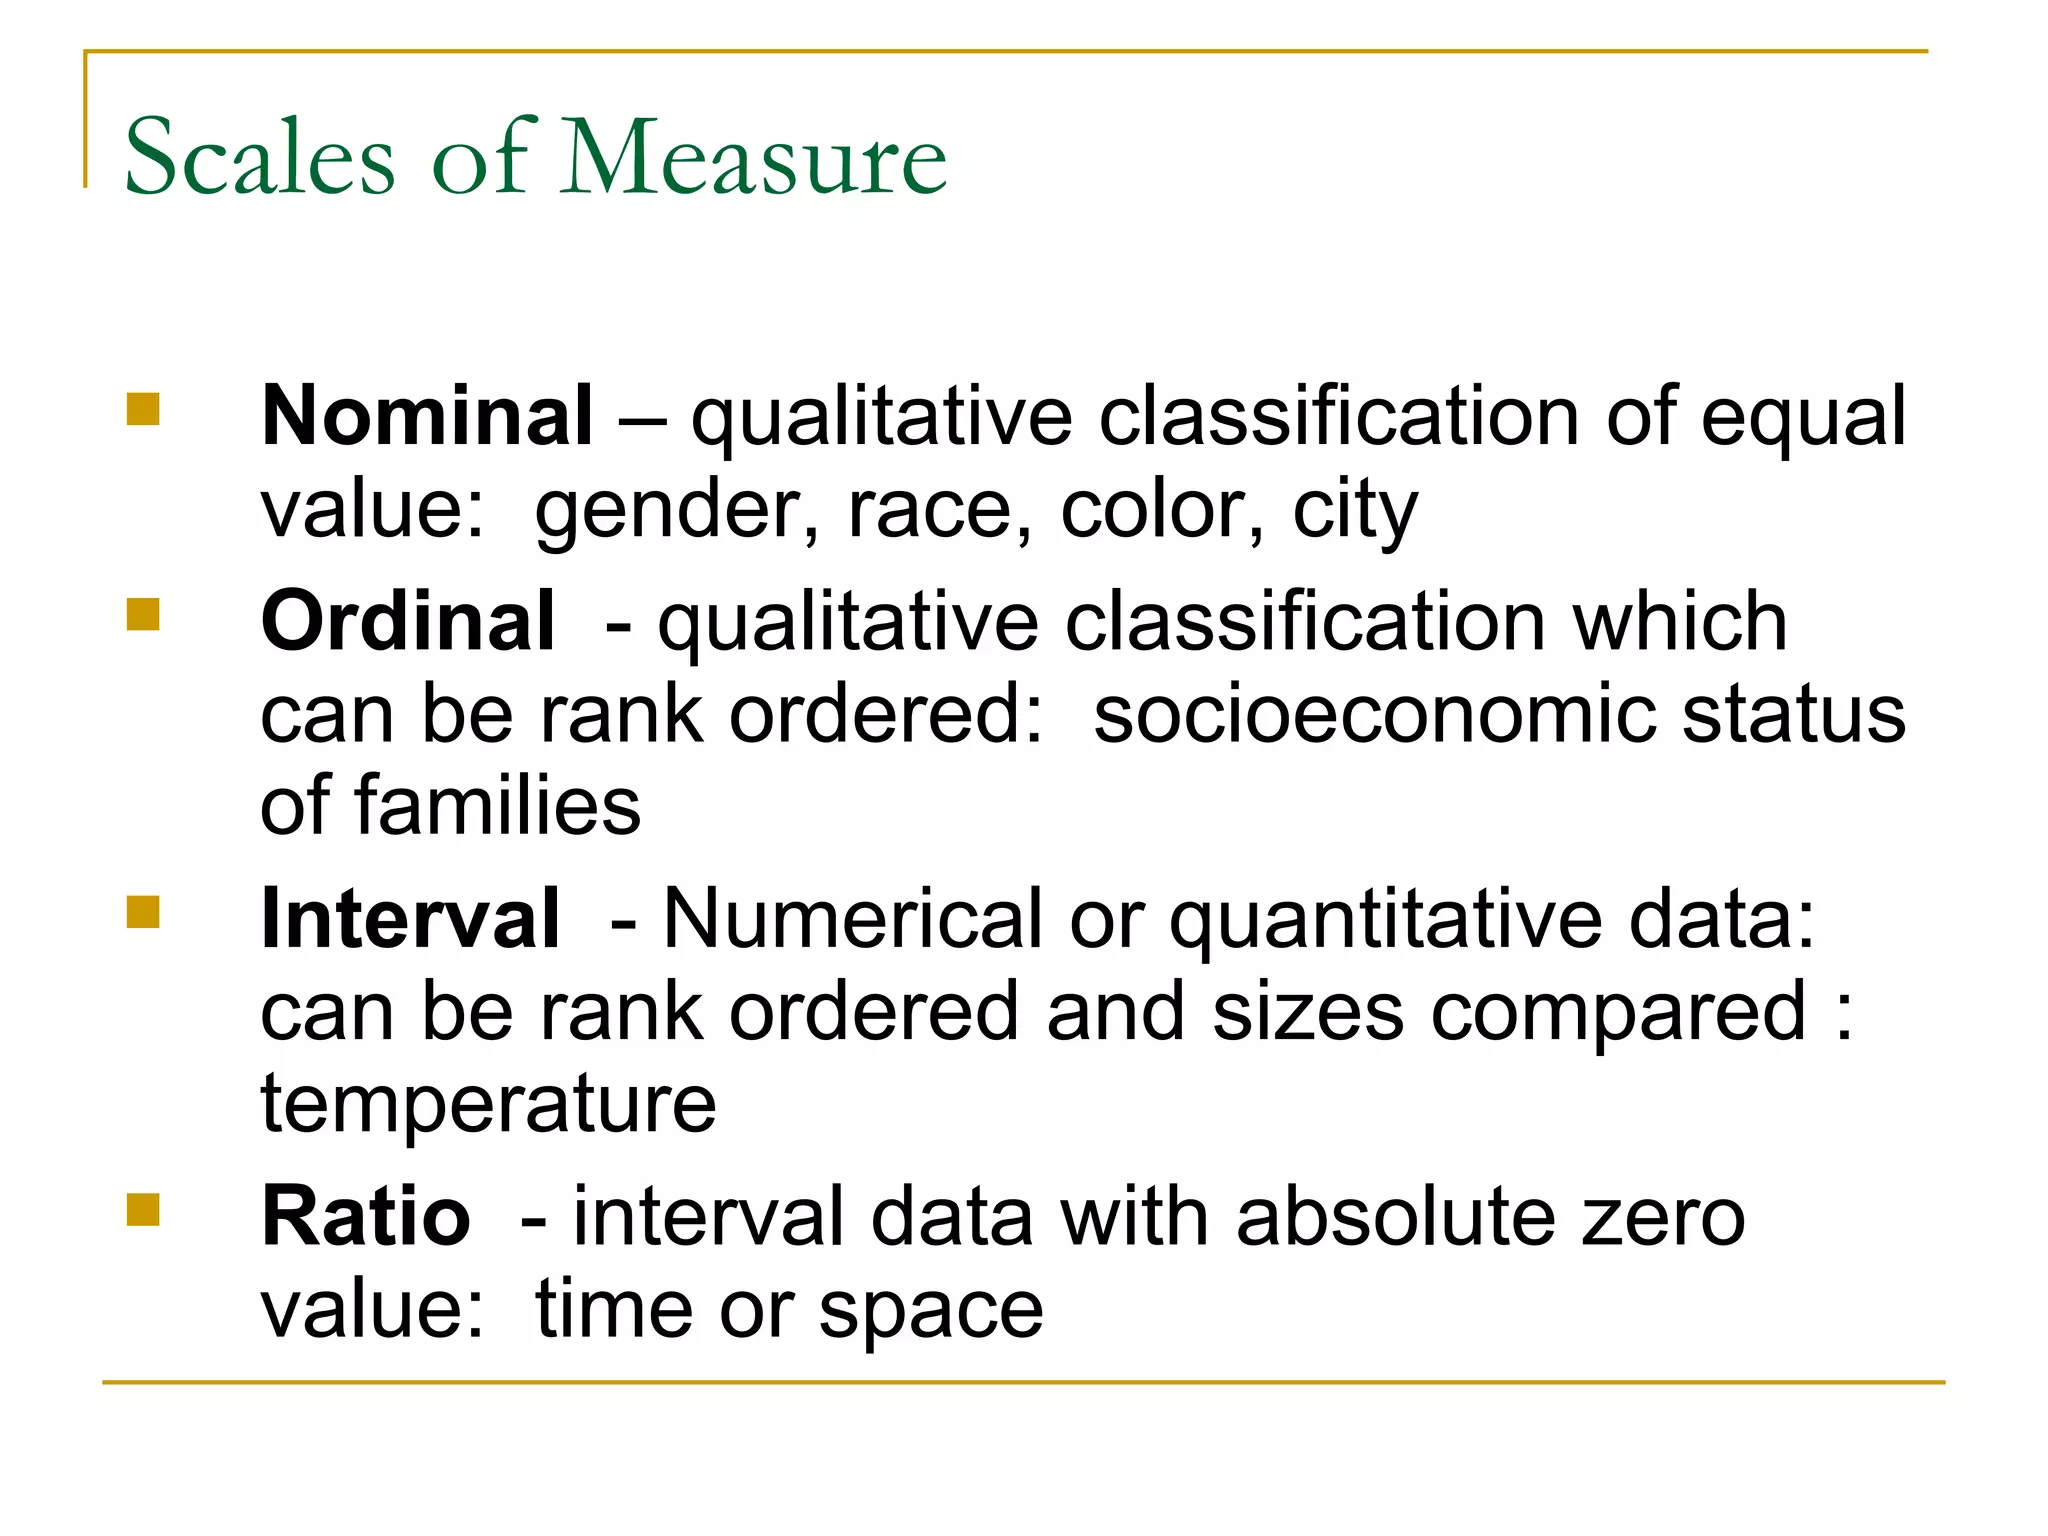
Scales of MeasureNominal – qualitative classification of equal value: gender, race, color, city Ordinal - qualitative classification which can be rank ordered: socioeconomic status of families Interval - Numerical or quantitative data: can be rank ordered and sizes compared : temperature Ratio - interval data with absolute zero value: time or space
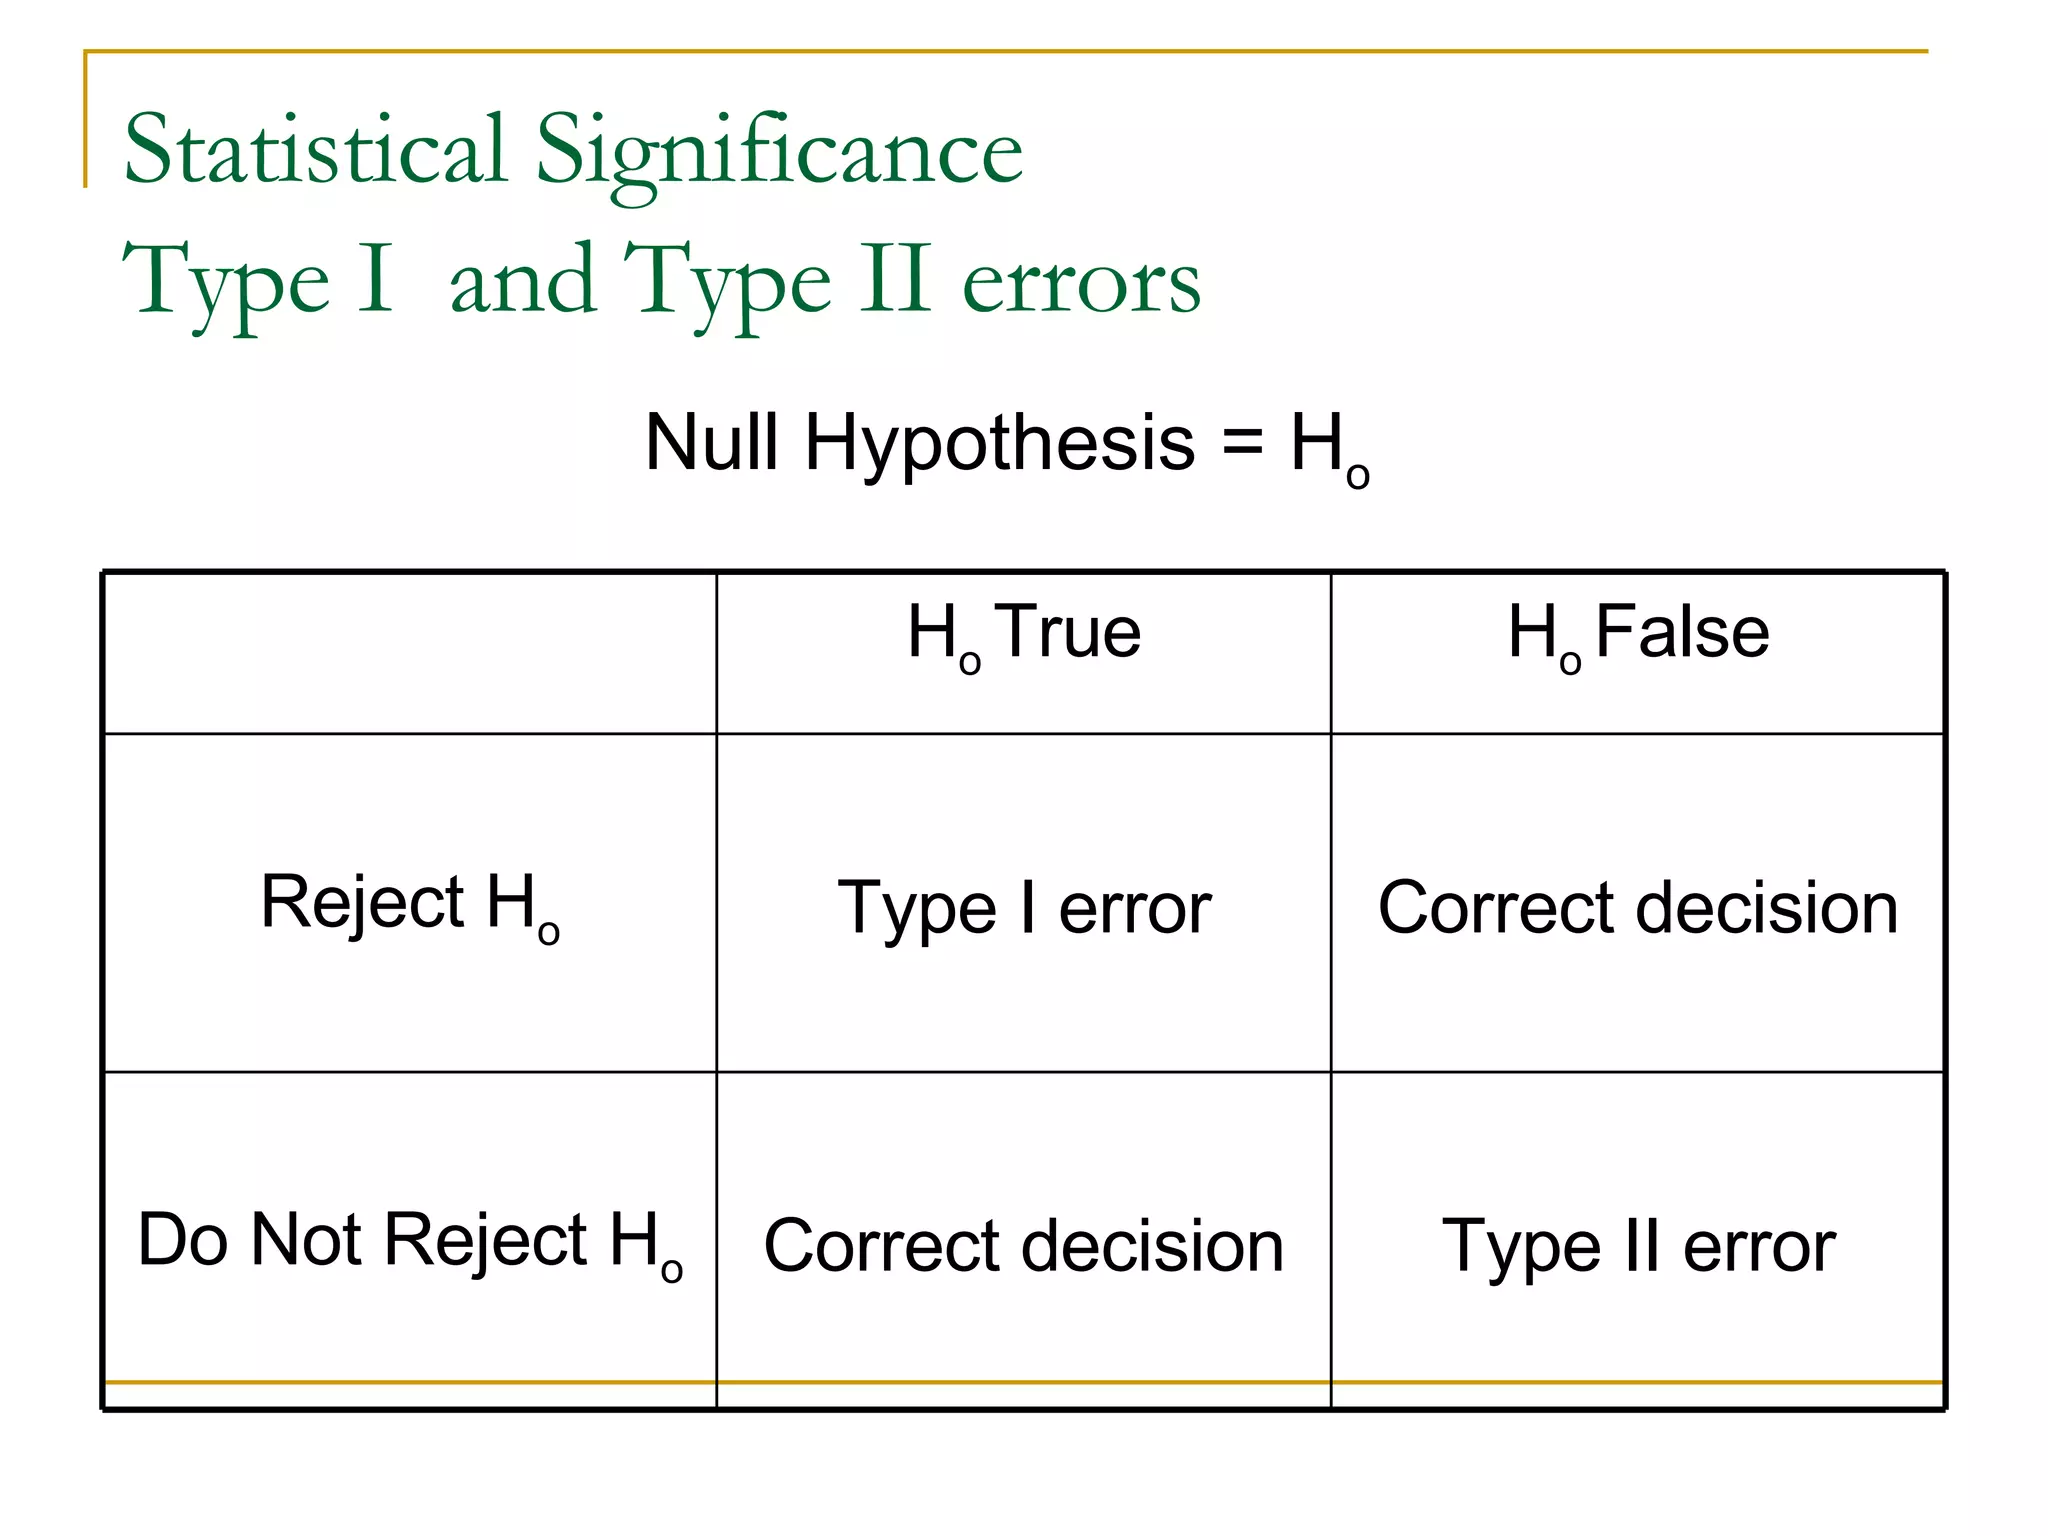
Statistical Significance TypeI and Type II errors Null Hypothesis = H o Type II error Correct decision Do Not Reject H o Correct decision Type I error Reject H o H o False H o True
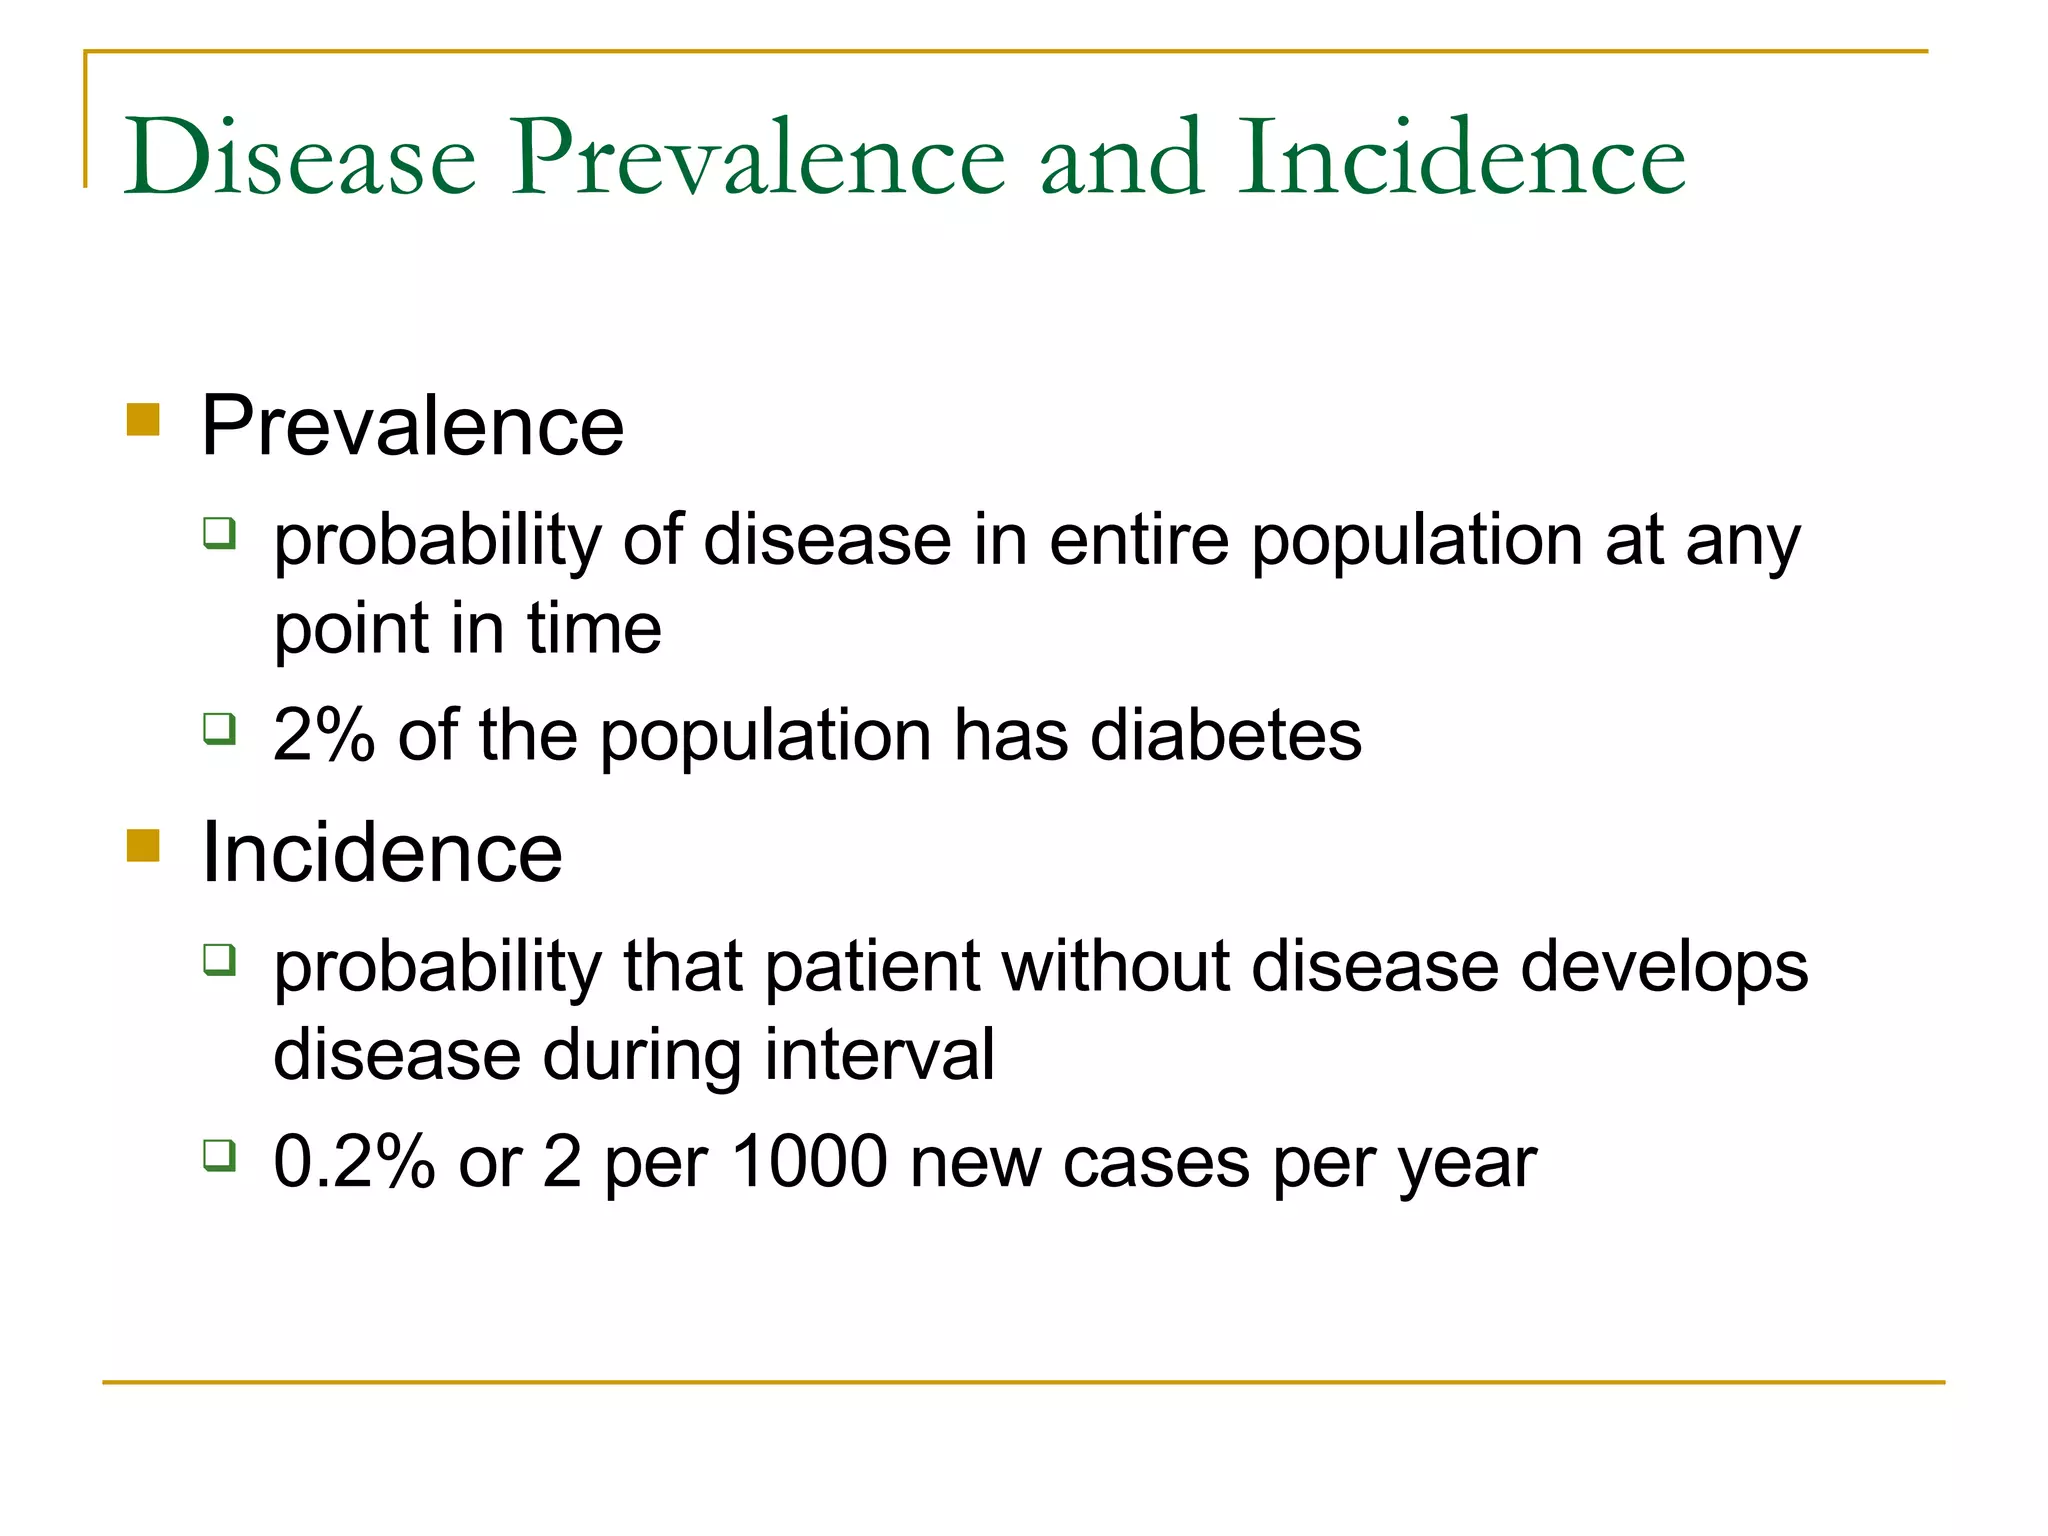
Disease Prevalence andIncidence Prevalence probability of disease in entire population at any point in time 2% of the population has diabetes Incidence probability that patient without disease develops disease during interval 0.2% or 2 per 1000 new cases per year
13.
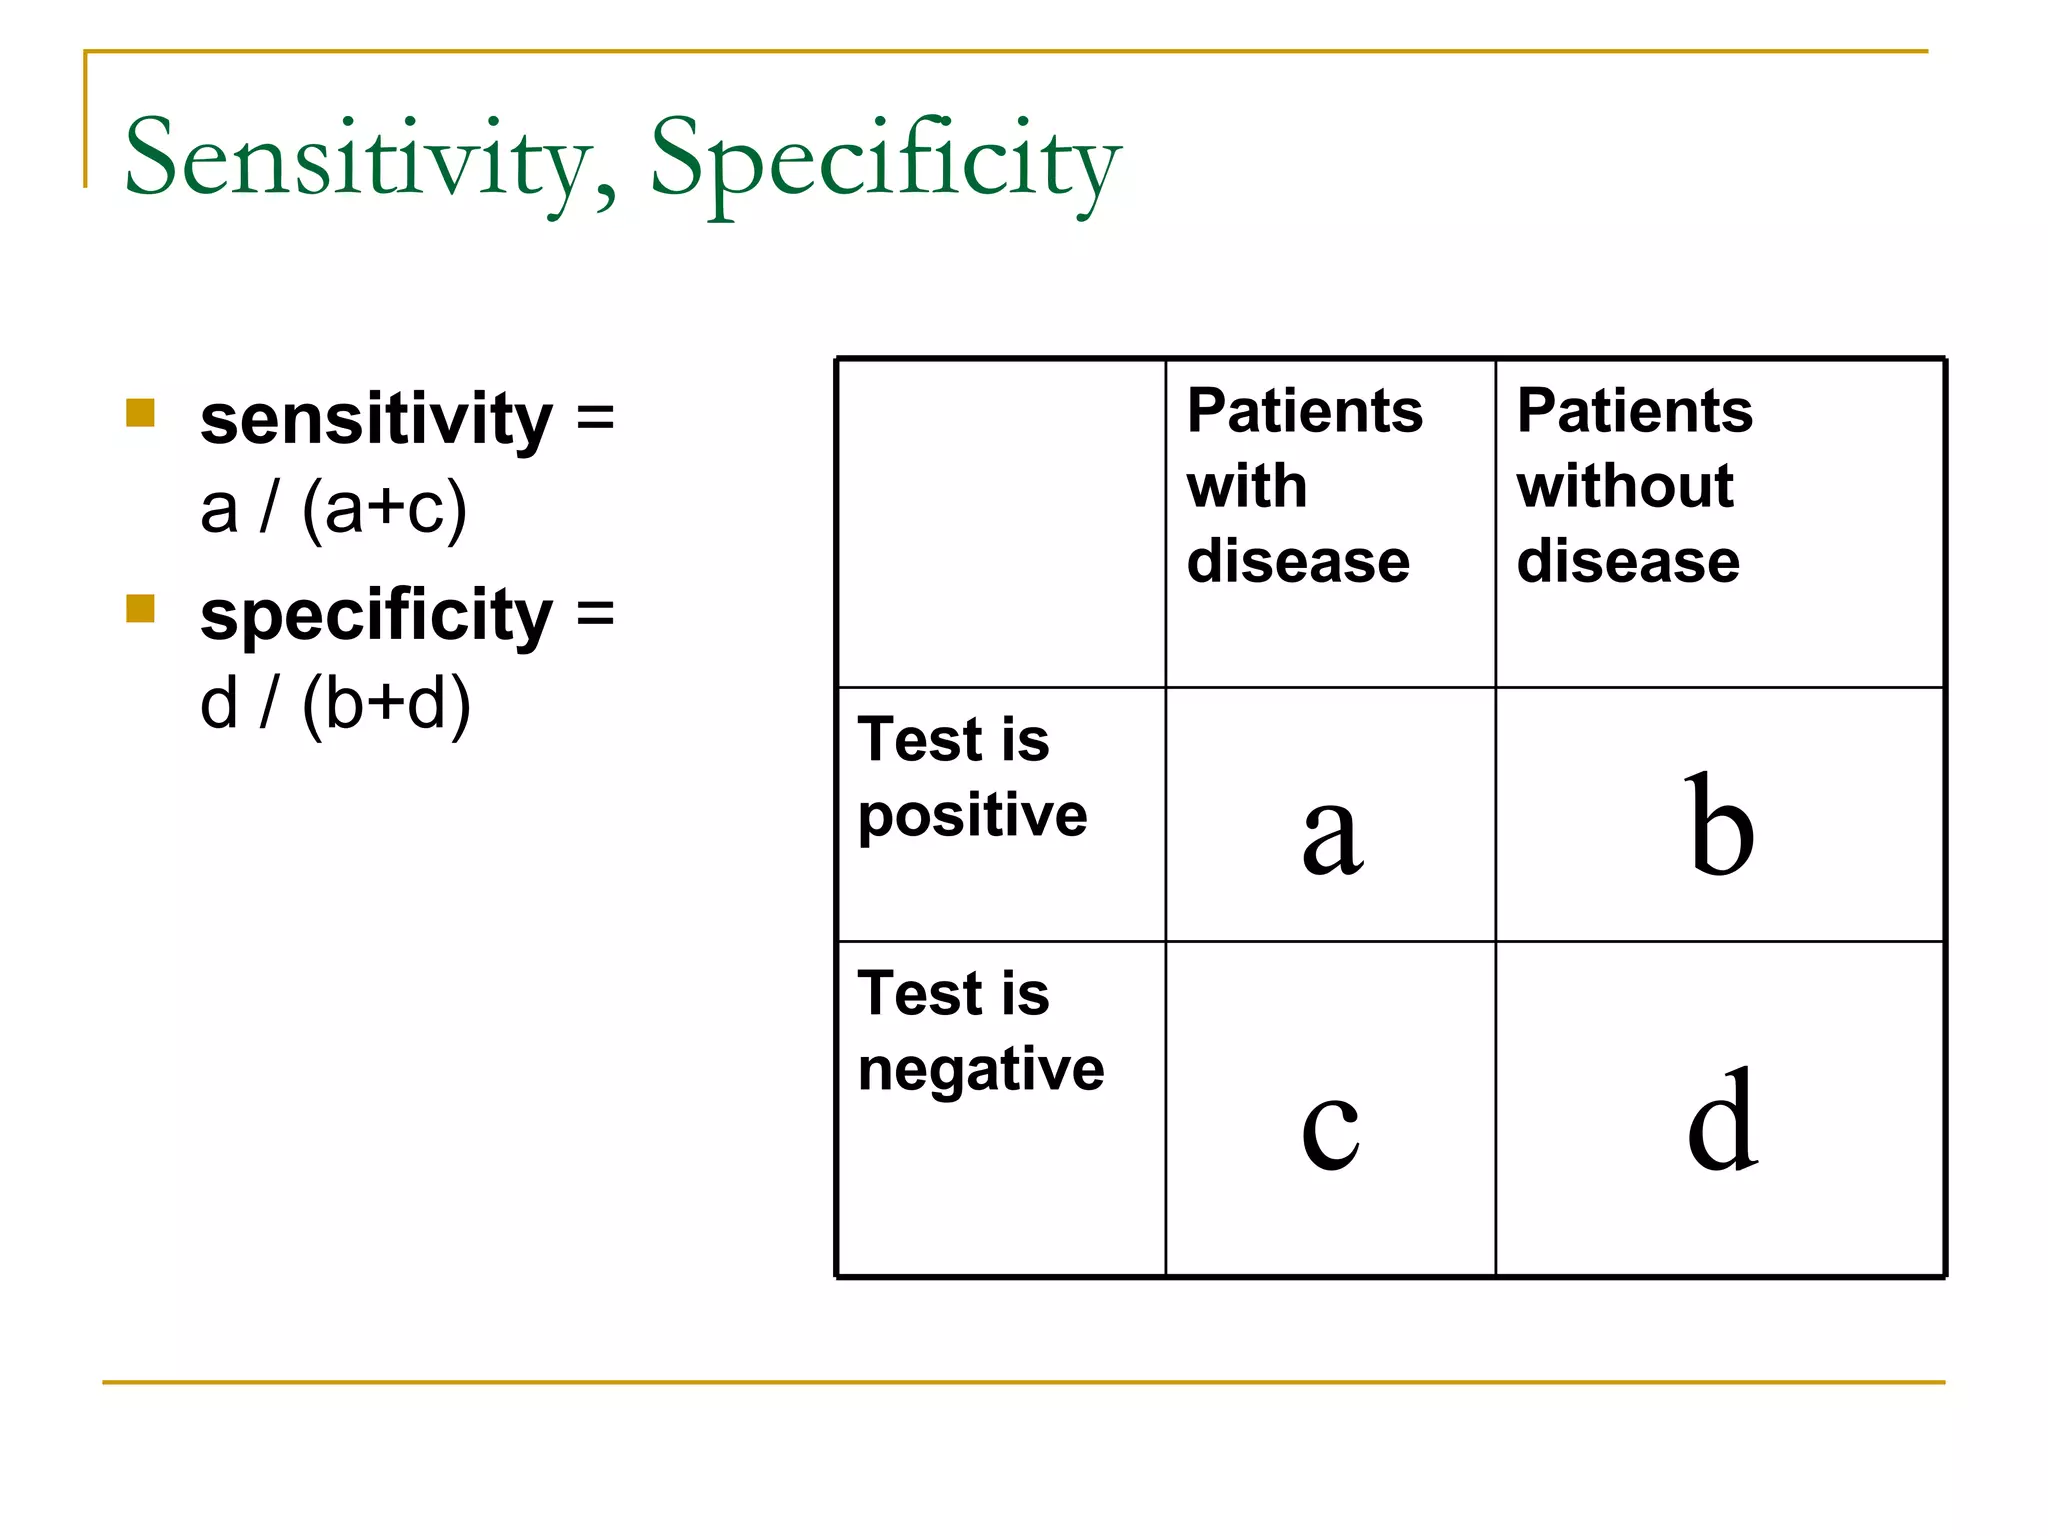
Sensitivity, Specificity sensitivity = a / (a+c) specificity = d / (b+d) d c Test is negative b a Test is positive Patients without disease Patients with disease
14.
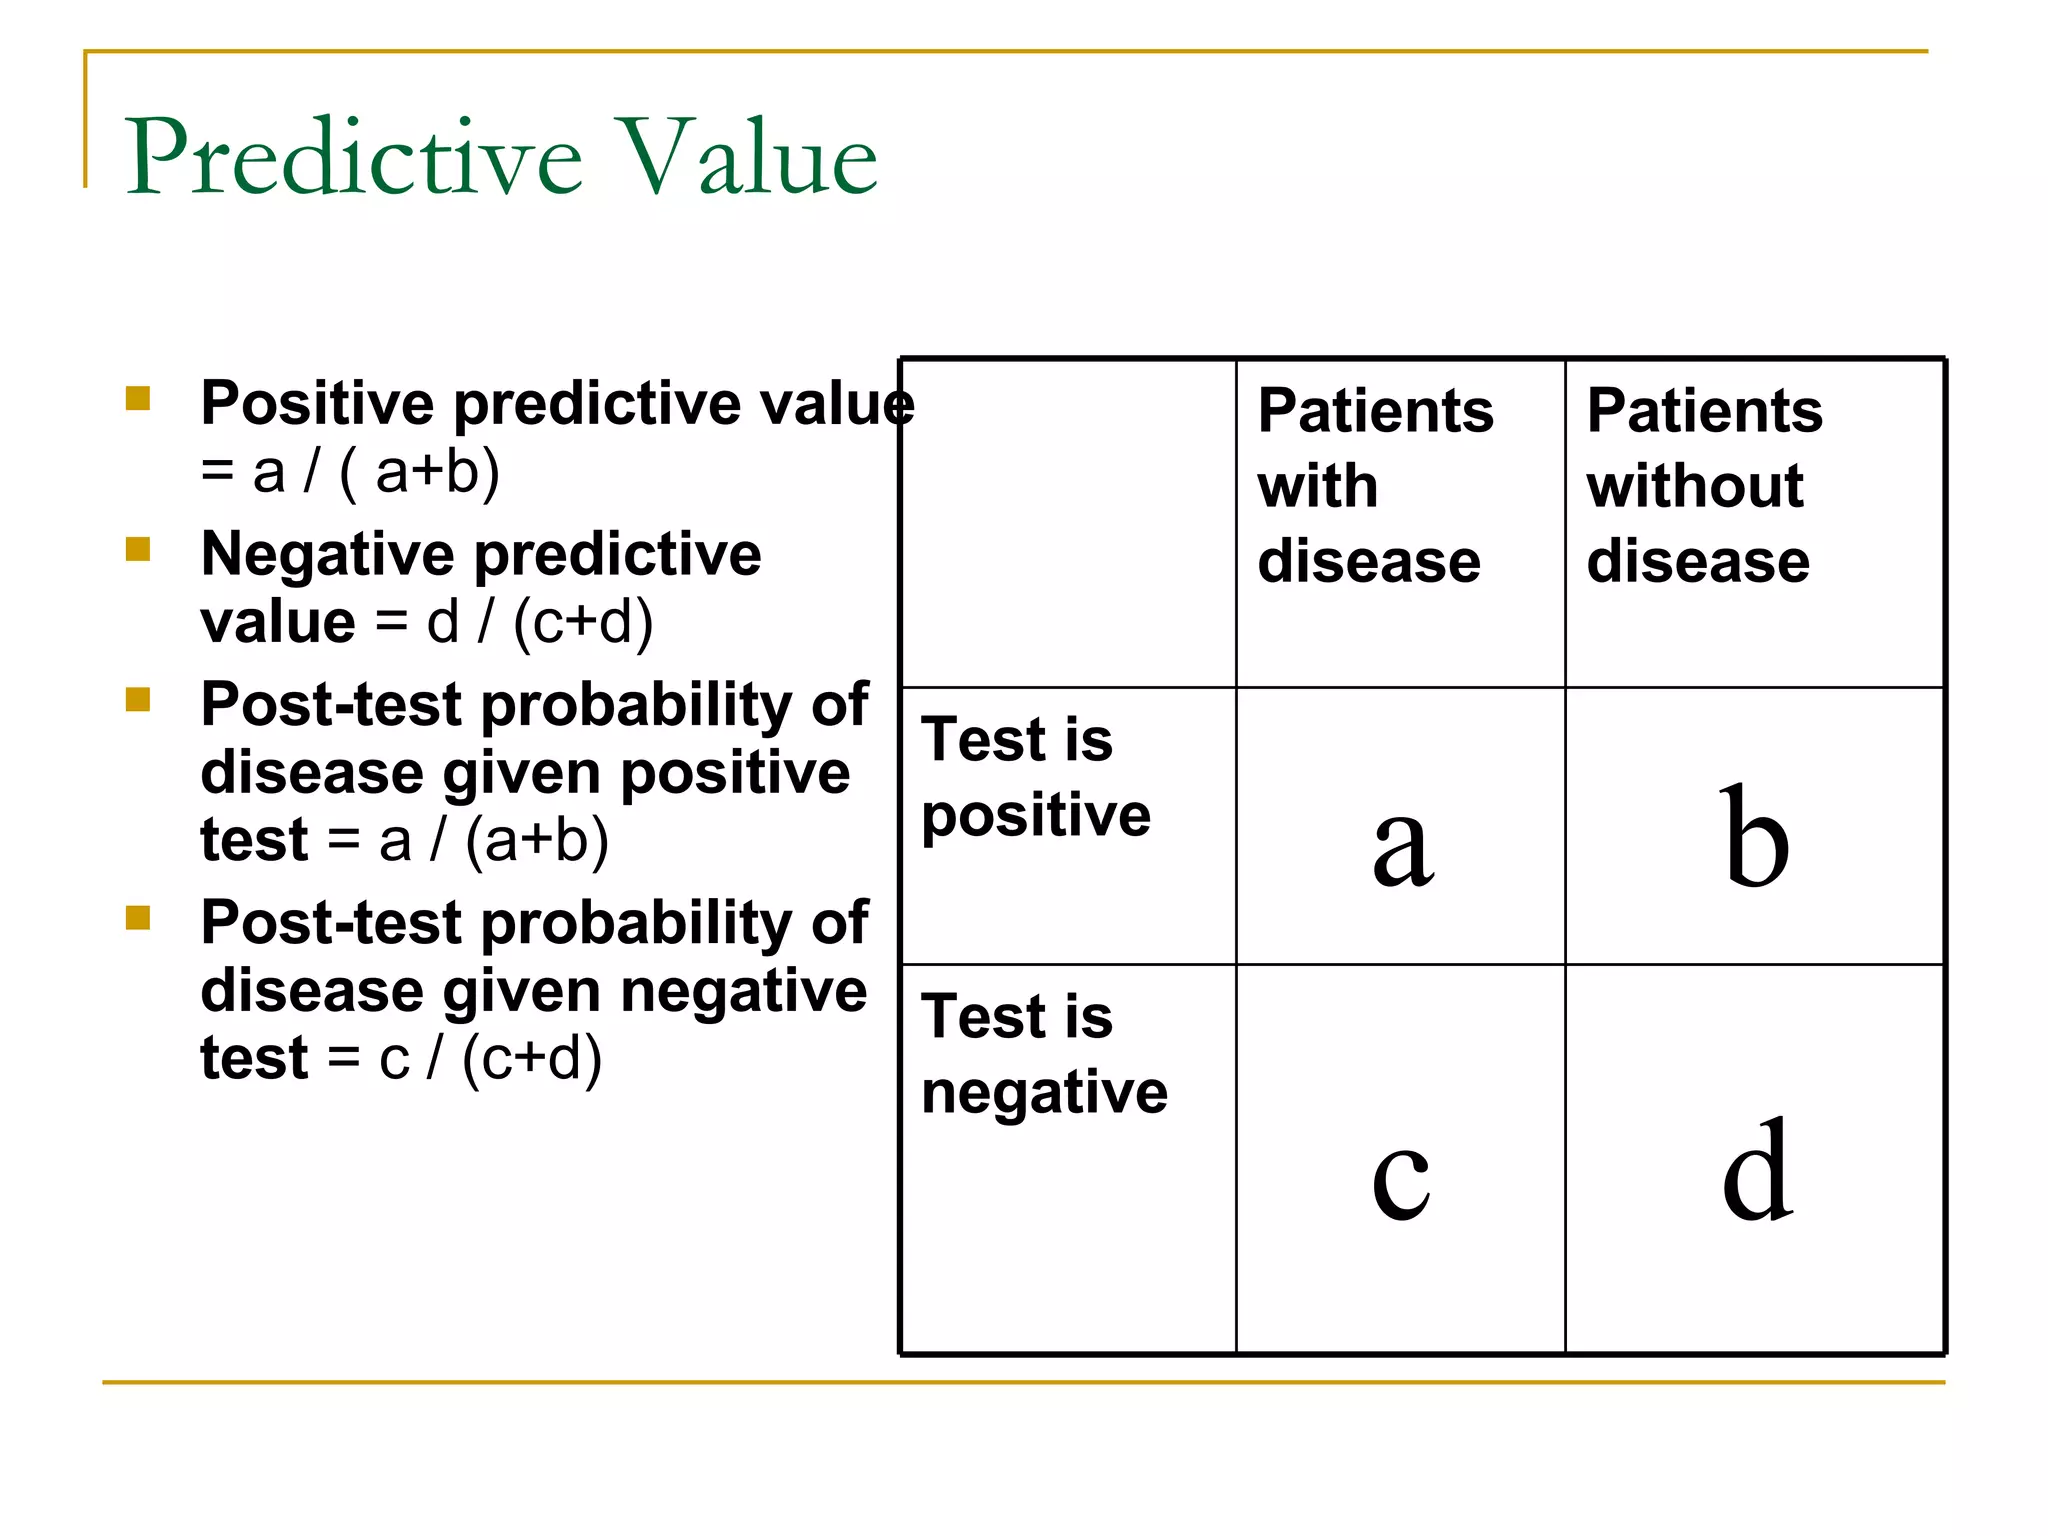
Predictive Value Positivepredictive value = a / ( a+b) Negative predictive value = d / (c+d) Post-test probability of disease given positive test = a / (a+b) Post-test probability of disease given negative test = c / (c+d) d c Test is negative b a Test is positive Patients without disease Patients with disease
15.
Good Resource Sen,Spc, PV An Introduction to Information Mastery http://www.poems.msu.edu/InfoMastery/default.htm Diagnosis Sensitivity and specificity Predictive values Likelihood ratios InfoRetriever Calculators: Epidemiology, Diagnostic test
16.
Fundamental Concepts ofStudy Design Good Resource Epidemiology for the Uninitiated BMJ Online Textbook http://bmj.com/collections/epidem/epid.shtml
Types of HealthStatistics Questions Fact lookups Research Presentations Social and Policy indicators
19.
Strategies for FindingHealth Stats Use Portal Start at Internet site Start with book or article
20.
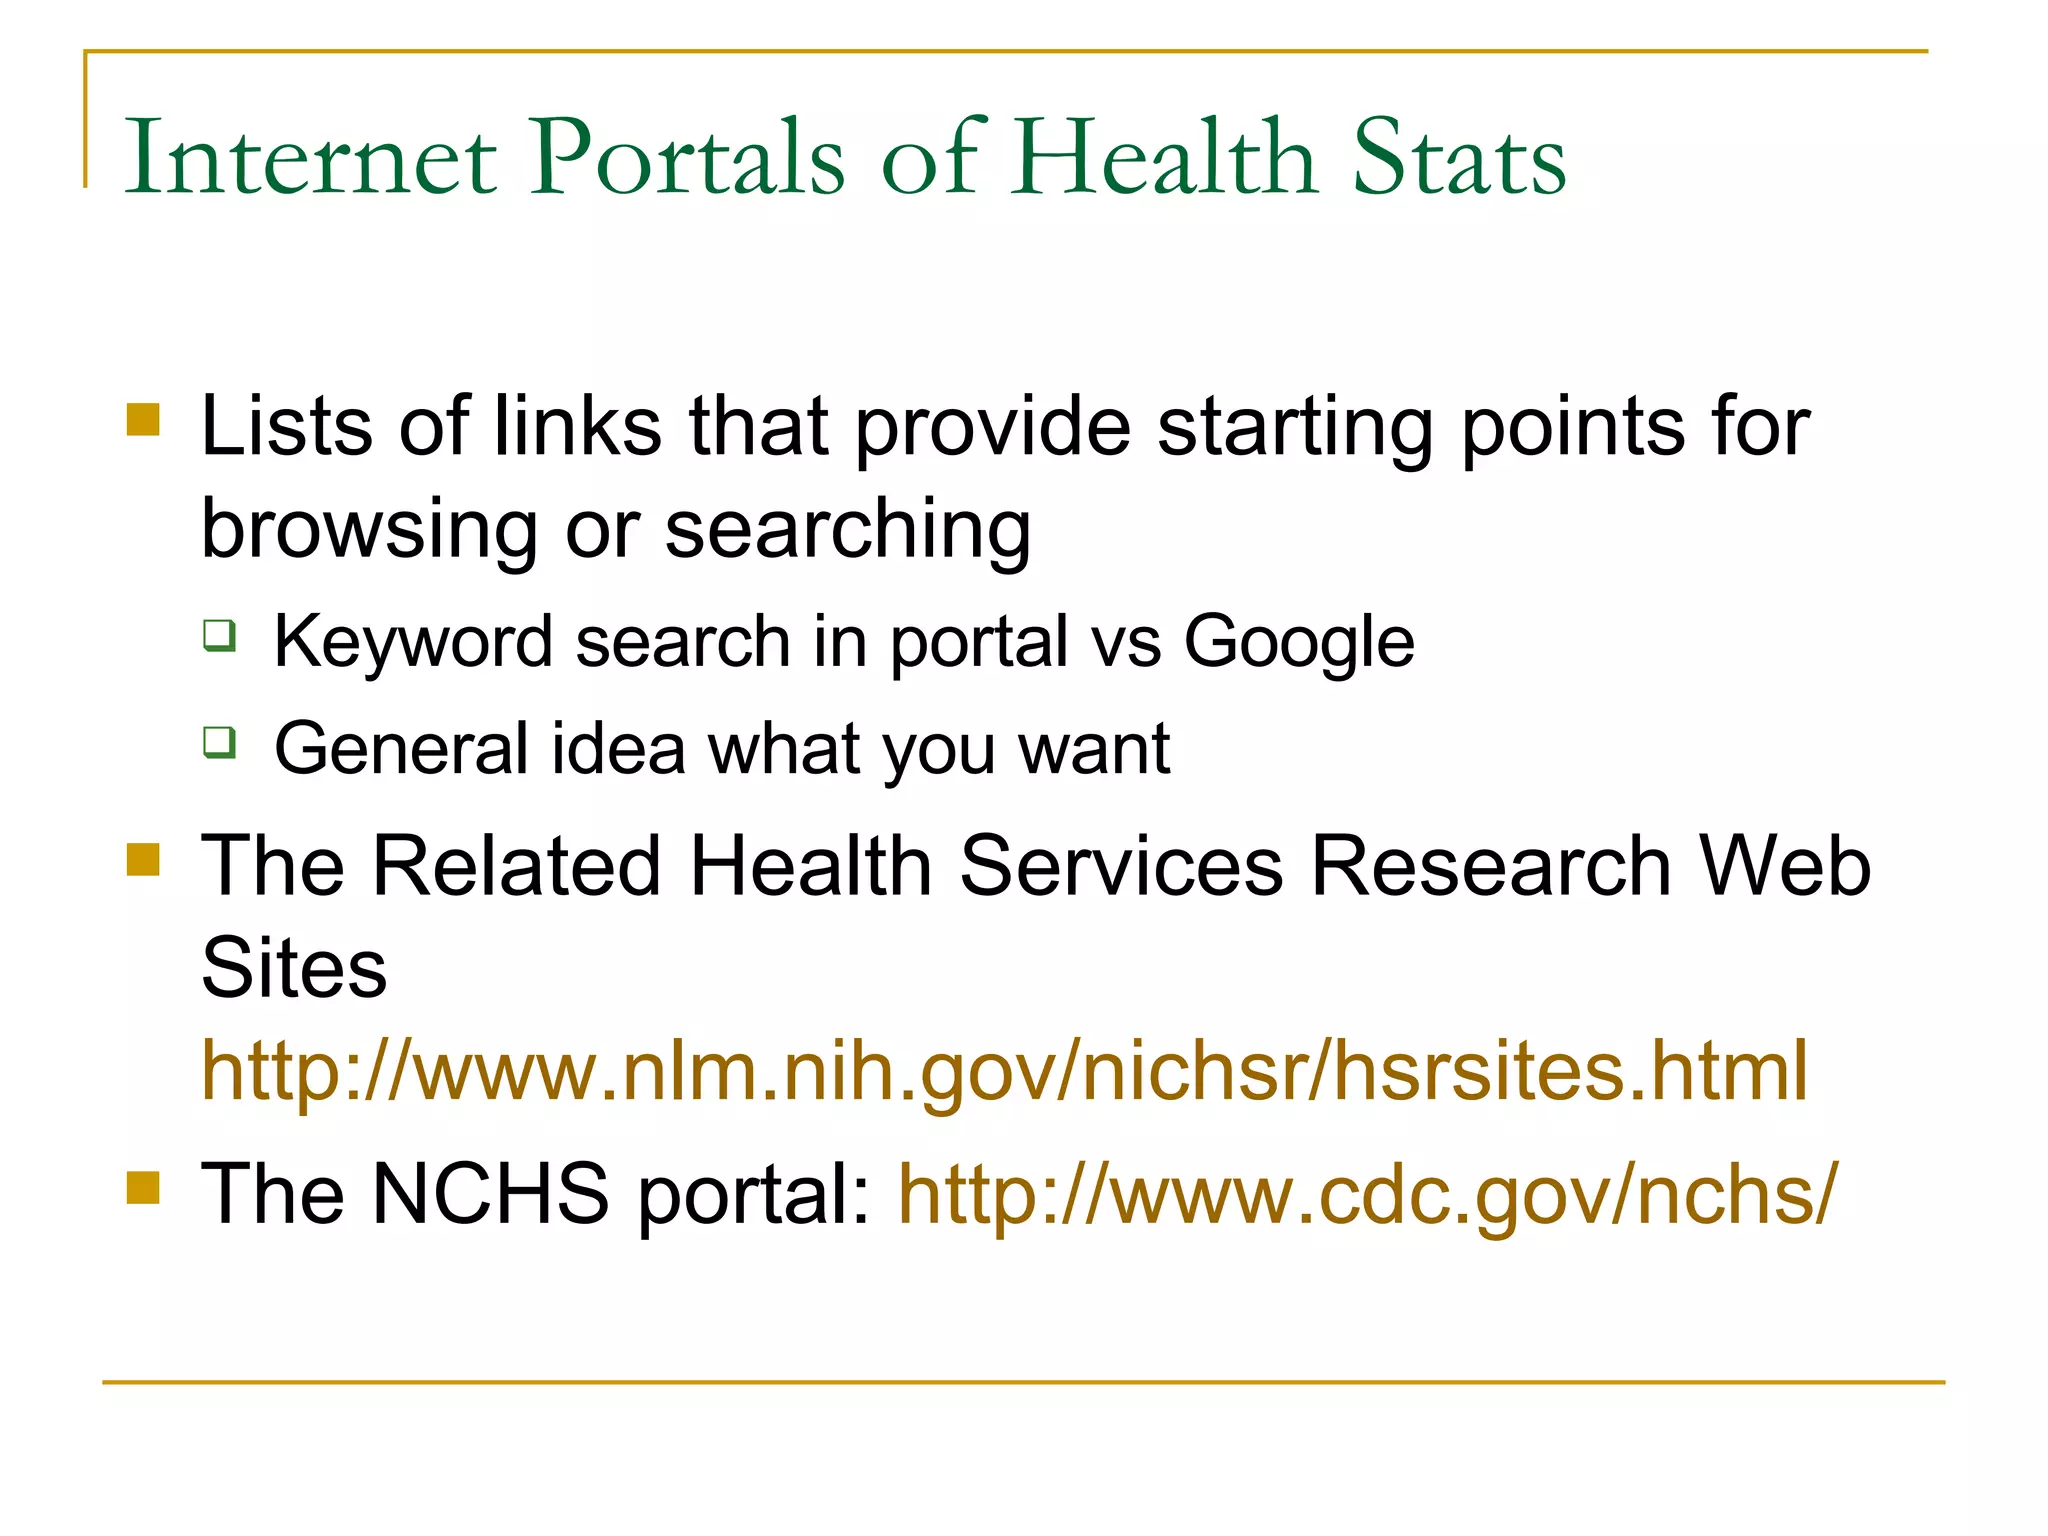
Internet Portals ofHealth Stats Lists of links that provide starting points for browsing or searching Keyword search in portal vs Google General idea what you want The Related Health Services Research Web Sites http://www.nlm.nih.gov/nichsr/hsrsites.html The NCHS portal: http://www.cdc.gov/nchs/
21.
Other Statistical WebSites CDC Data and Statistics http://www.cdc.gov/scientific.htm FedStats Home Page http://www.fedstats.gov/ Compare these two U Michigan’s Statistical Resources on the WEB – HEALTH What type of stats
22.
Lexis-Nexis Statistical UniverseSubscription resource Searches stat data Subject List Limit search Reports or tables http://web.lexis-nexis.com/statuniv?B1=Connect+to+Statistical+Universe
Health Care DataHealthcare Cost and Utilization Project HCUPnet Hospital discharges Ambulatory service Costs Amount of care By diagnosis and procedure Surveys of hosp, physicians, nursing homes
25.
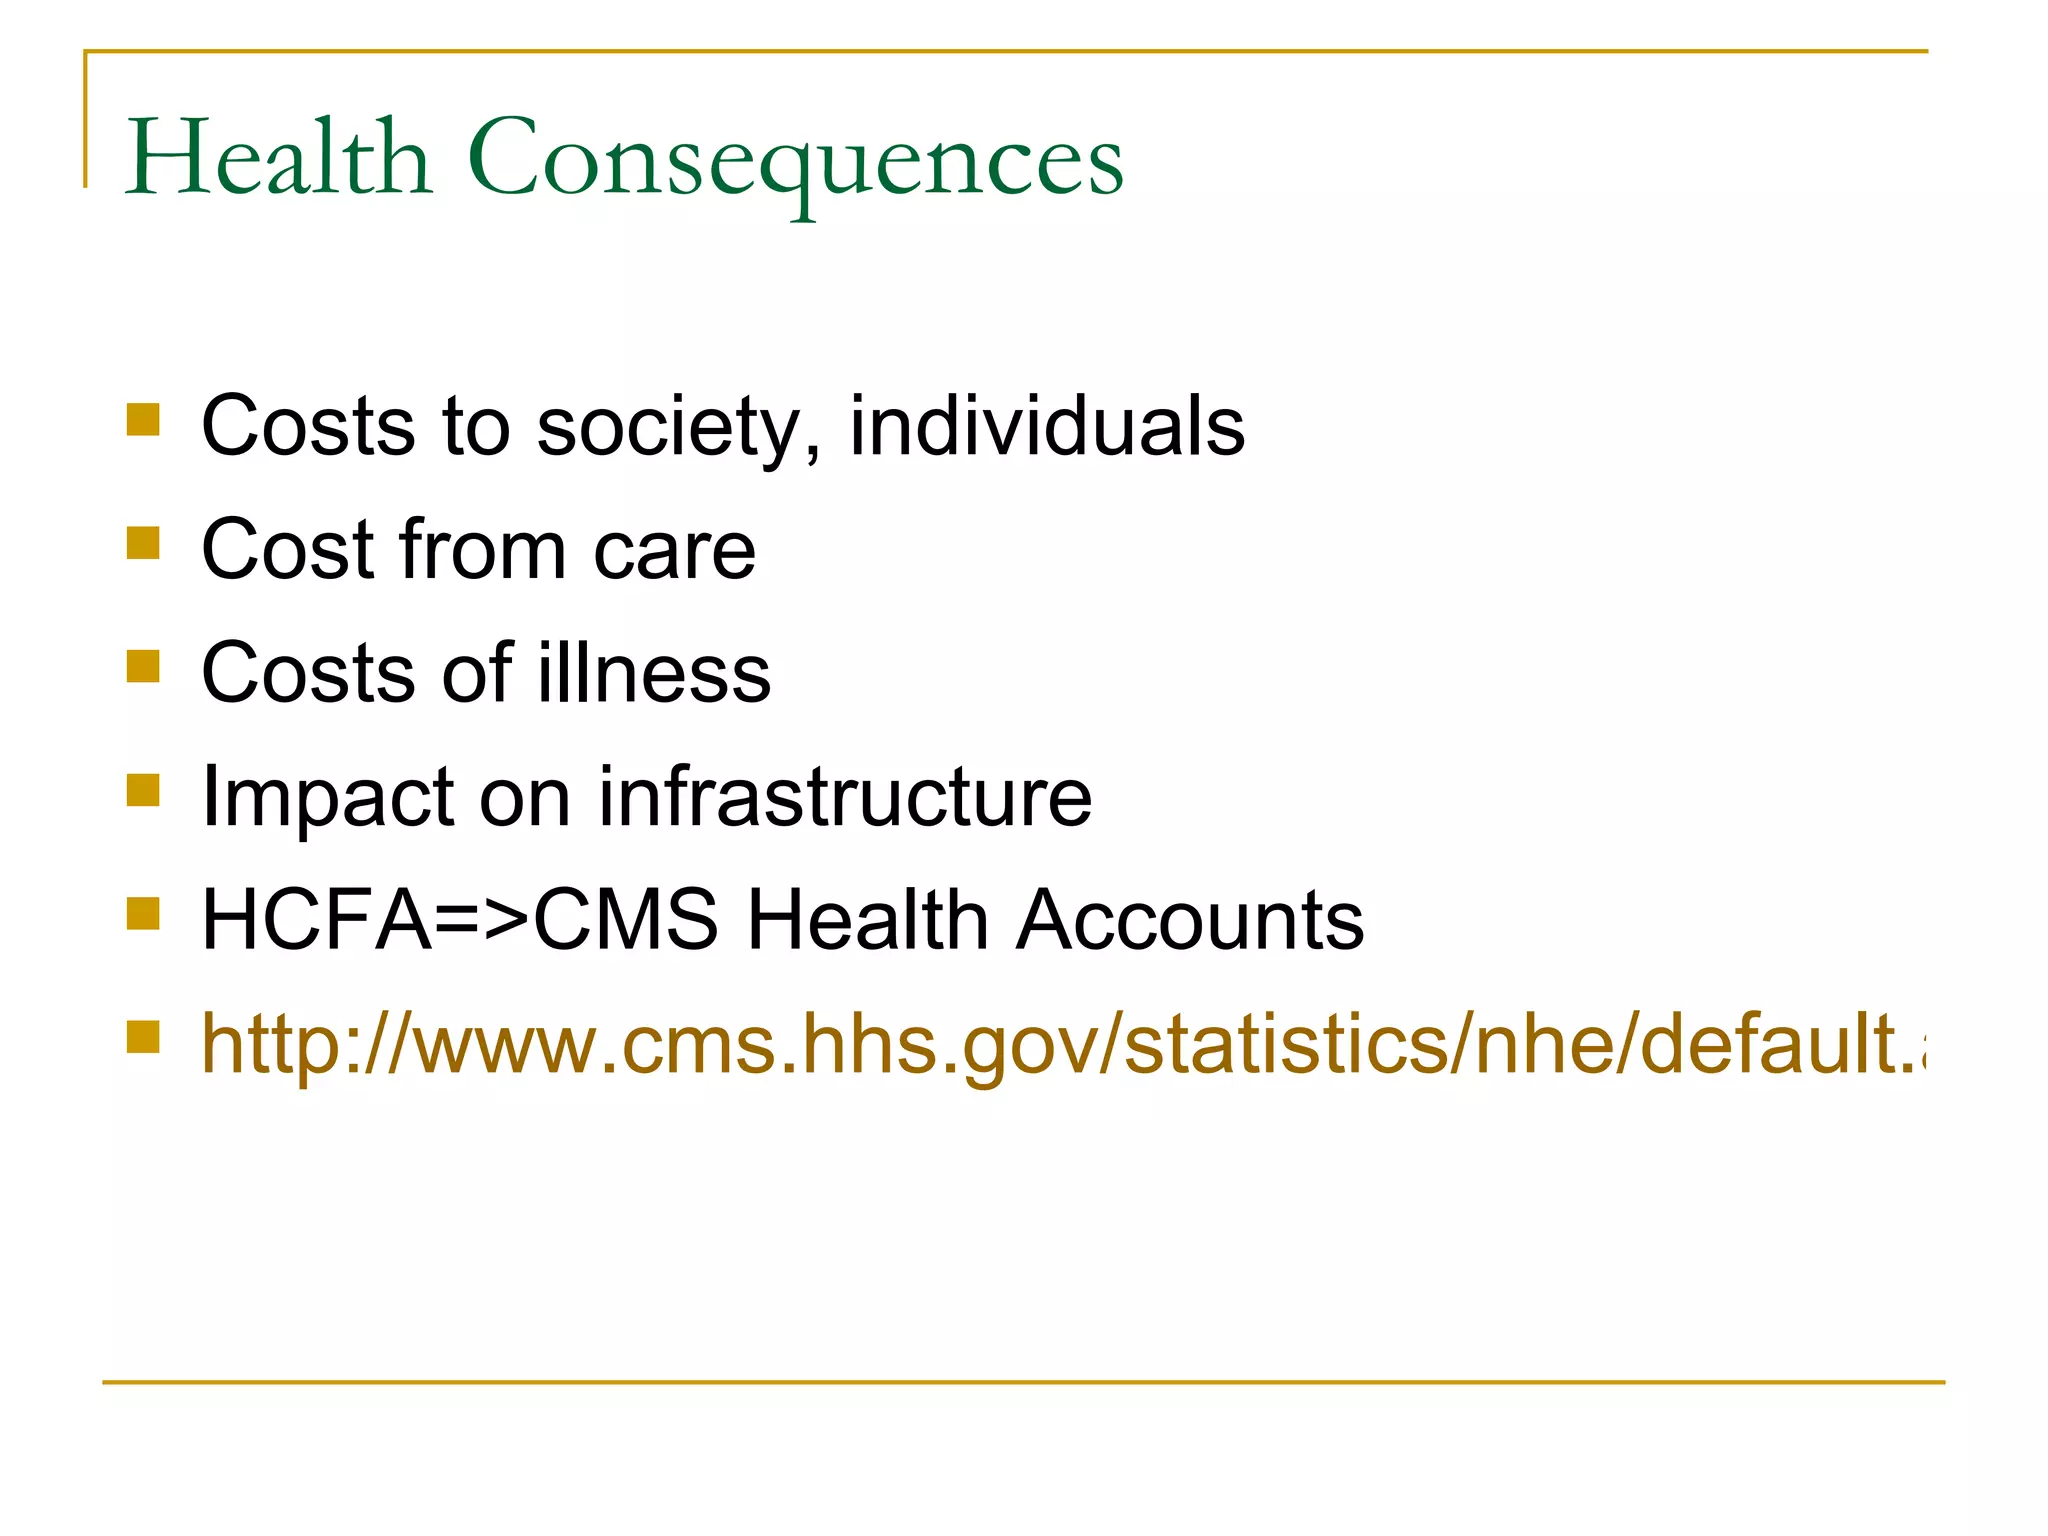
Health Consequences Costs to society, individuals Cost from care Costs of illness Impact on infrastructure HCFA=>CMS Health Accounts http://www.cms.hhs.gov/statistics/nhe/default.asp
26.
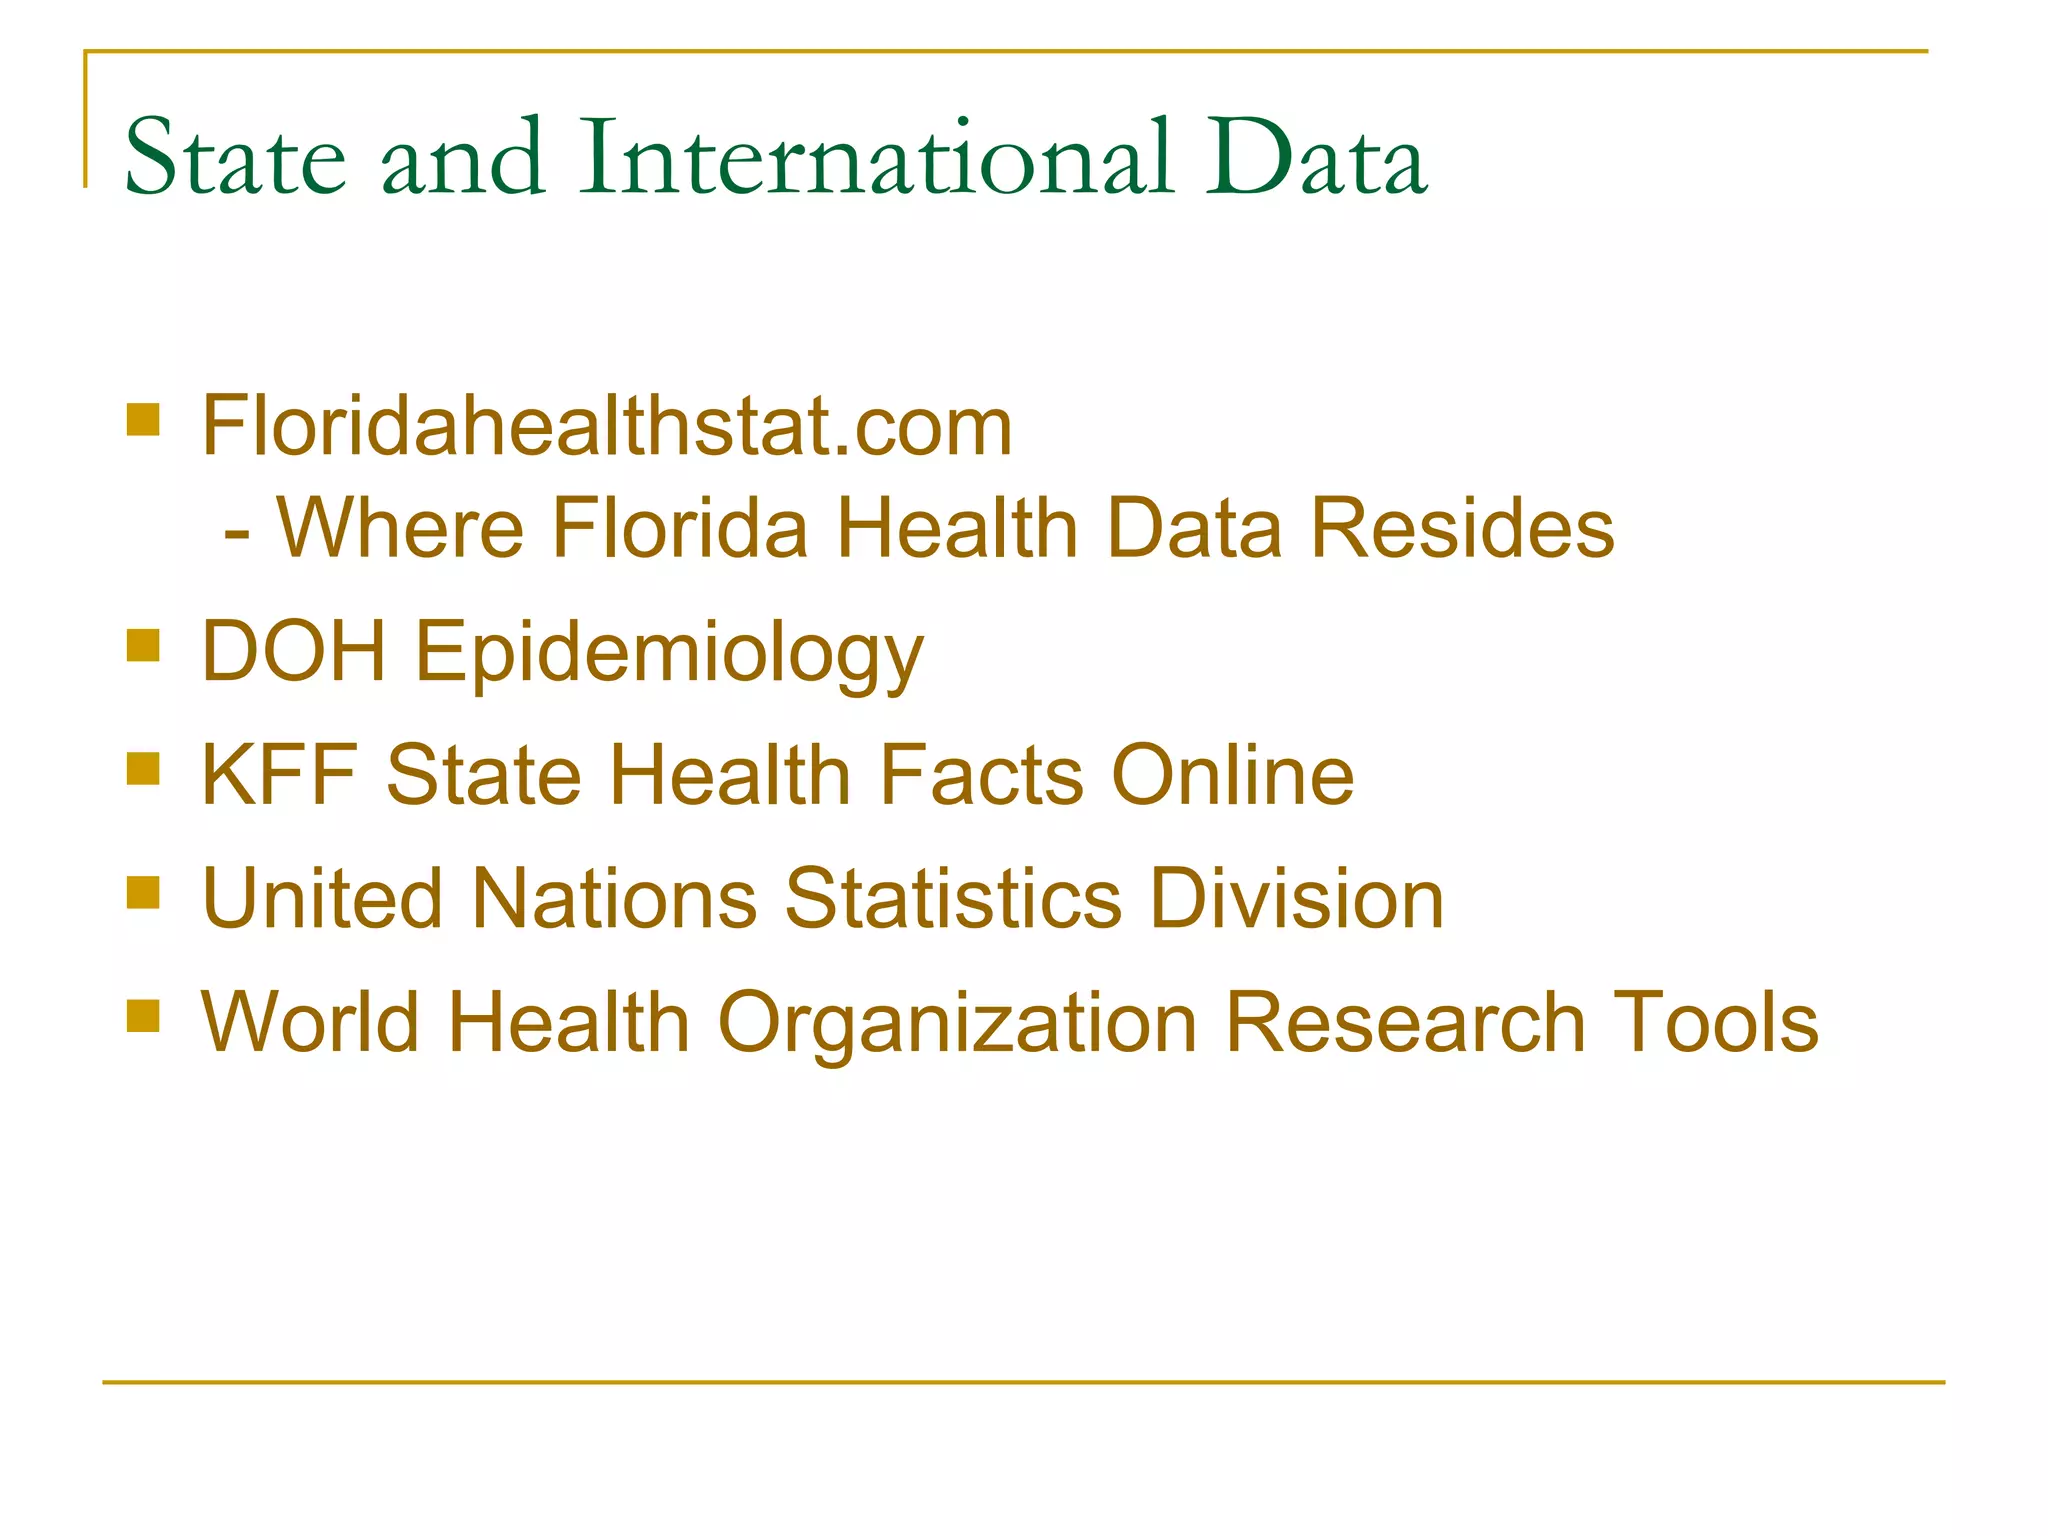
State and InternationalData Floridahealthstat.com - Where Florida Health Data Resides DOH Epidemiology KFF State Health Facts Online United Nations Statistics Division World Health Organization Research Tools
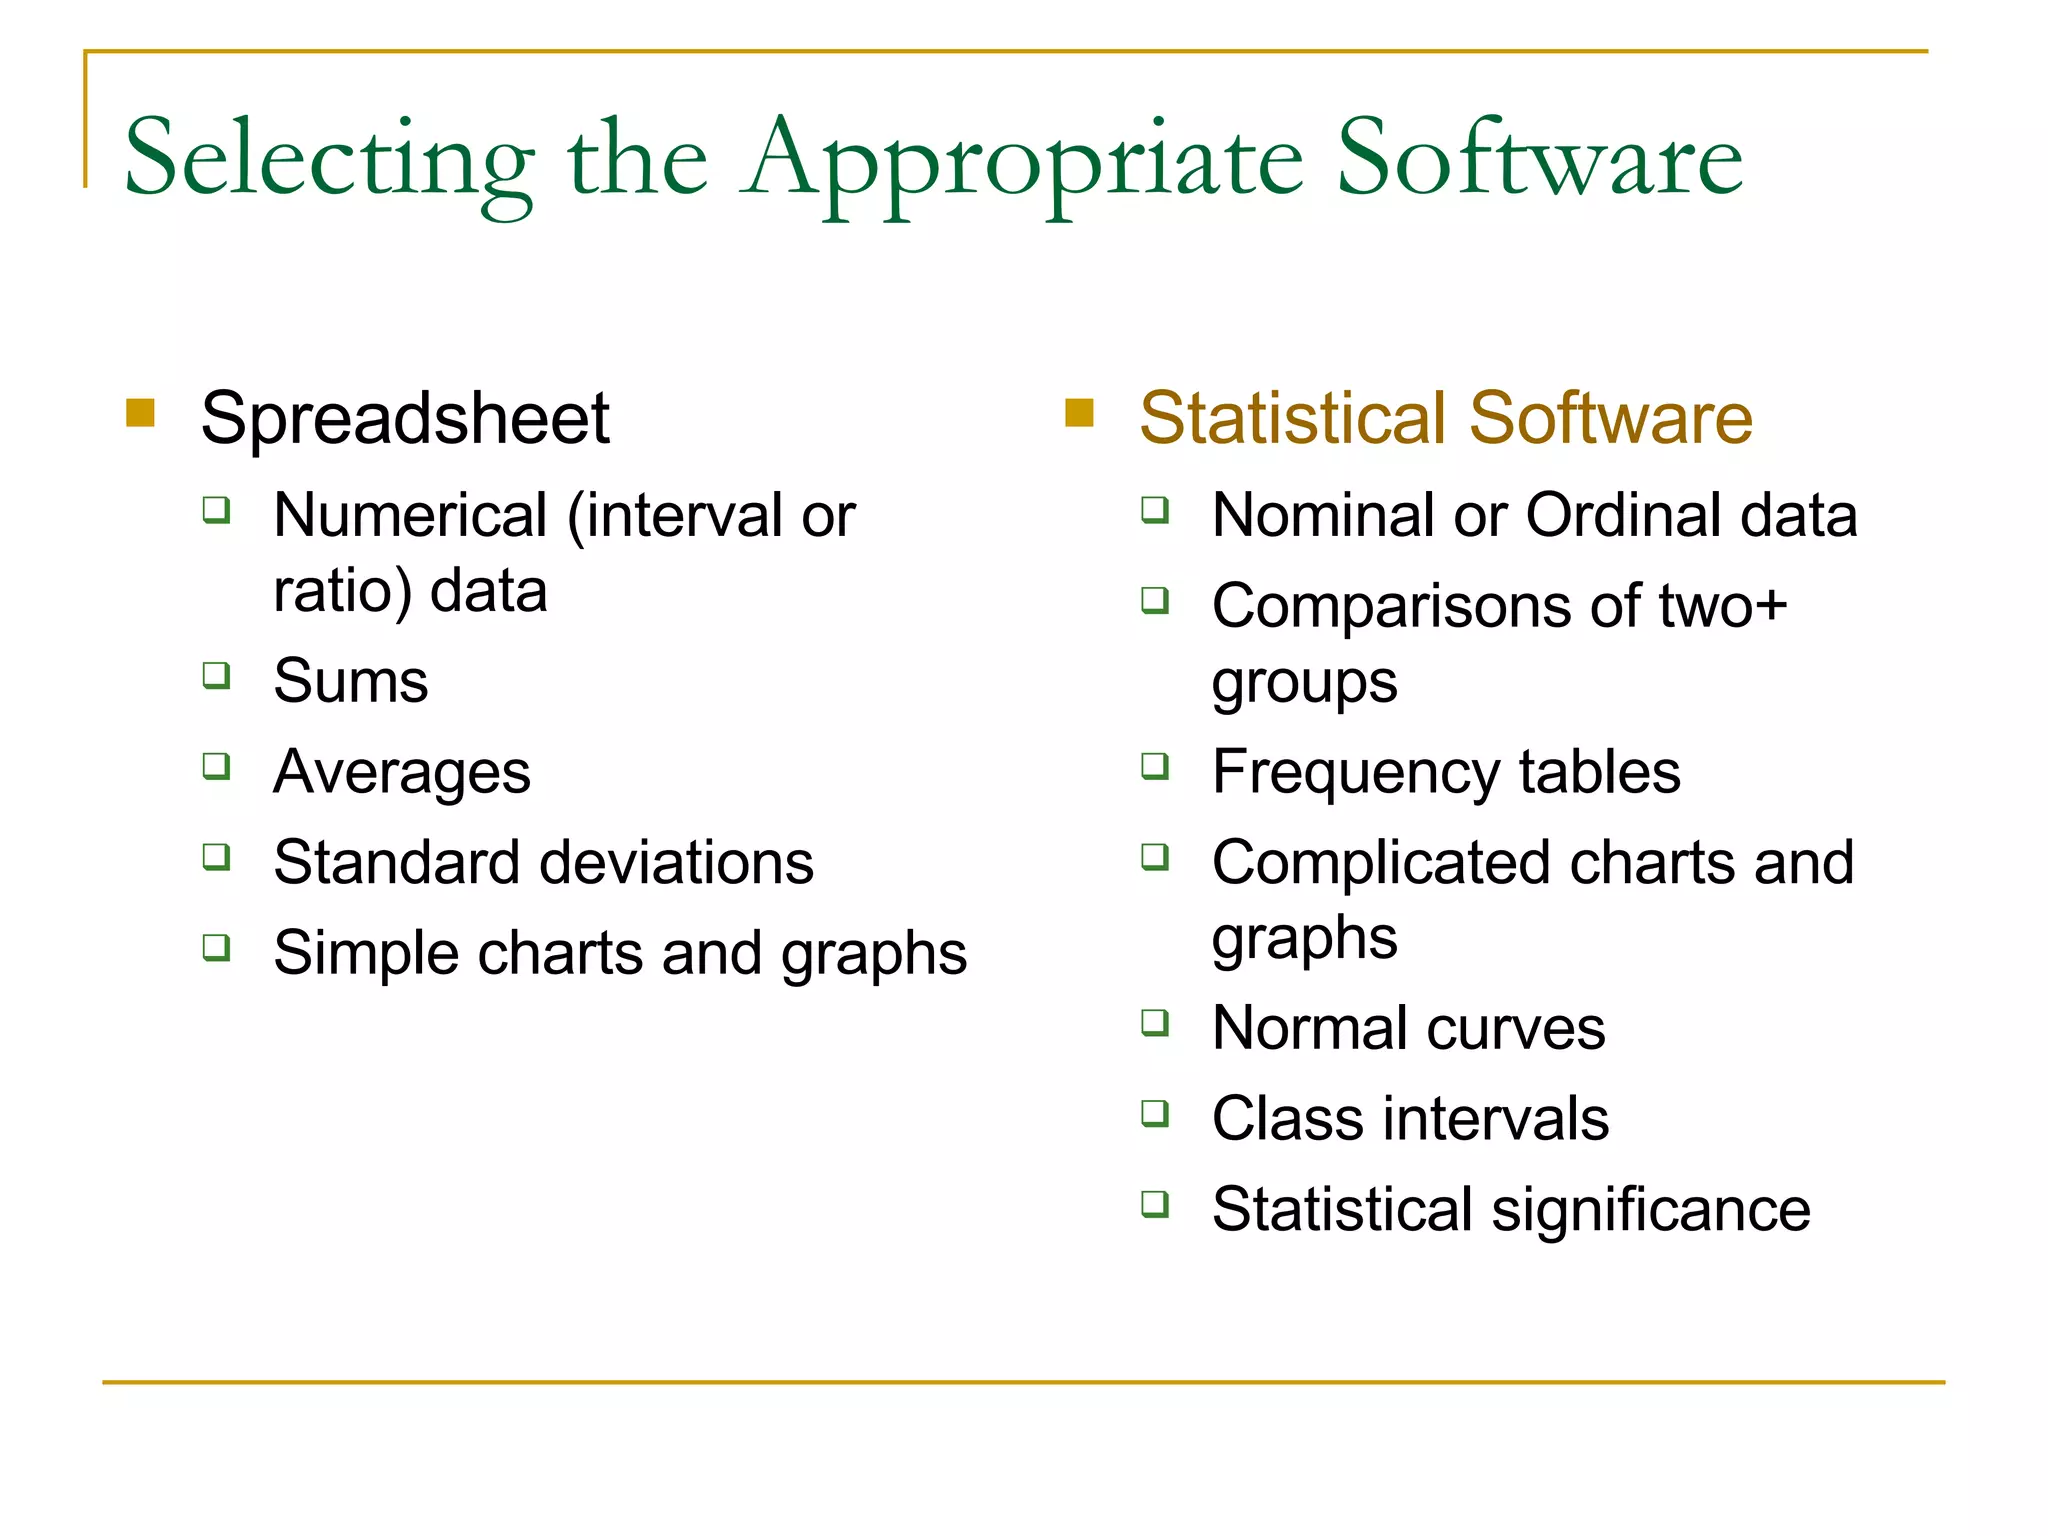
Selecting the AppropriateSoftware Spreadsheet Numerical (interval or ratio) data Sums Averages Standard deviations Simple charts and graphs Statistical Software Nominal or Ordinal data Comparisons of two+ groups Frequency tables Complicated charts and graphs Normal curves Class intervals Statistical significance
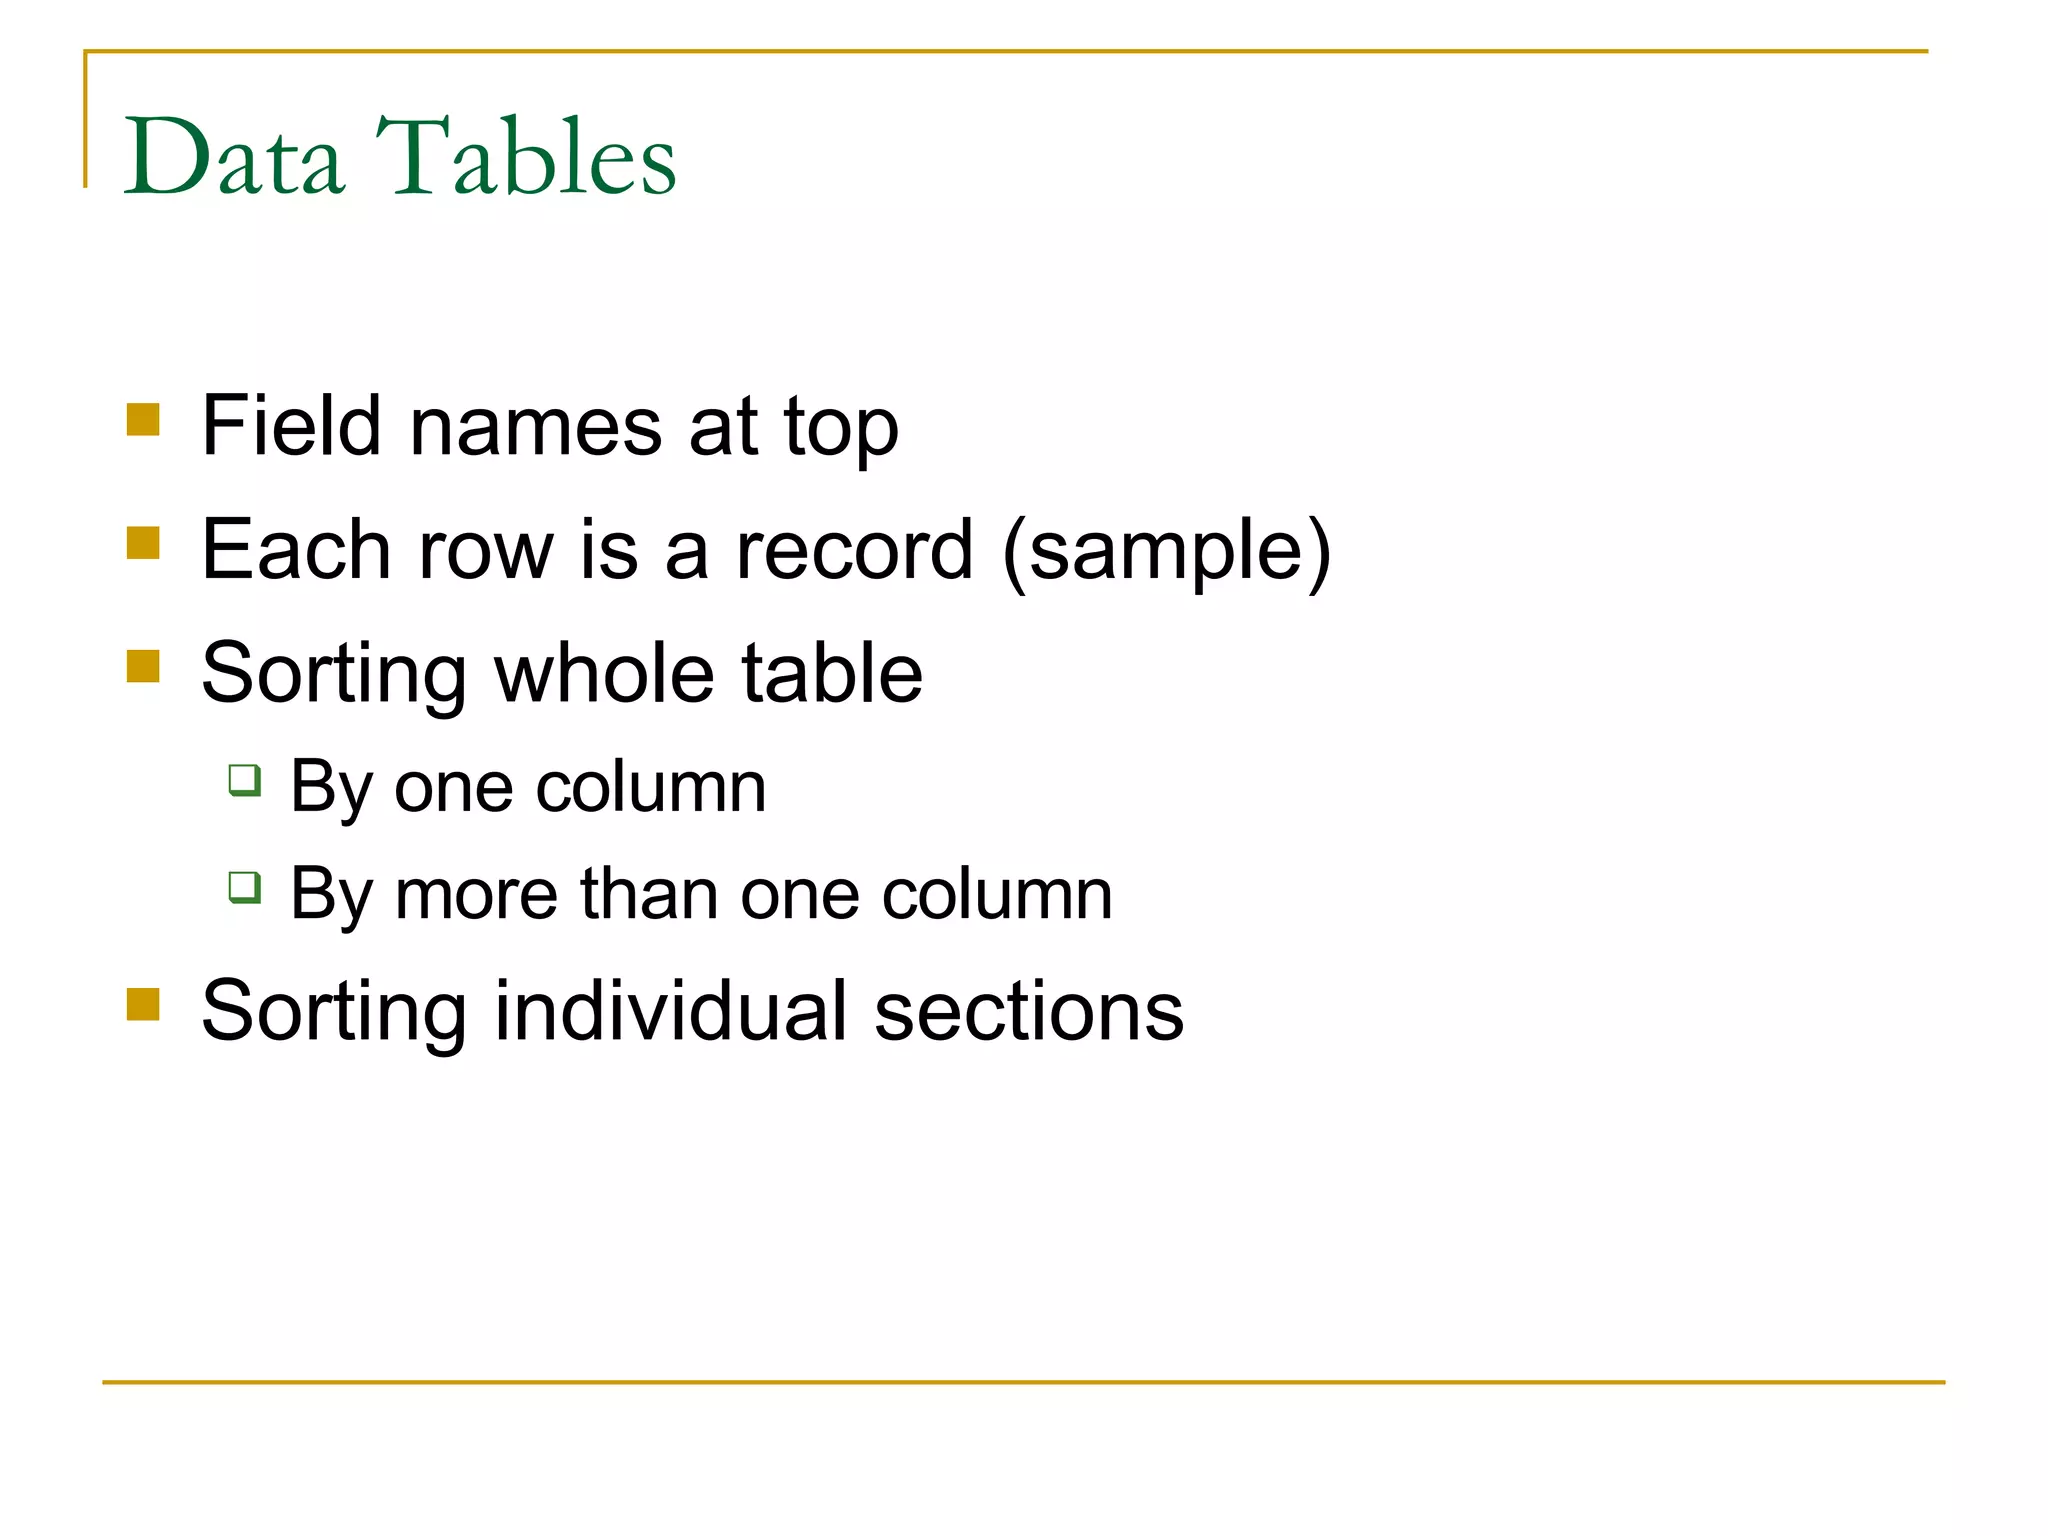
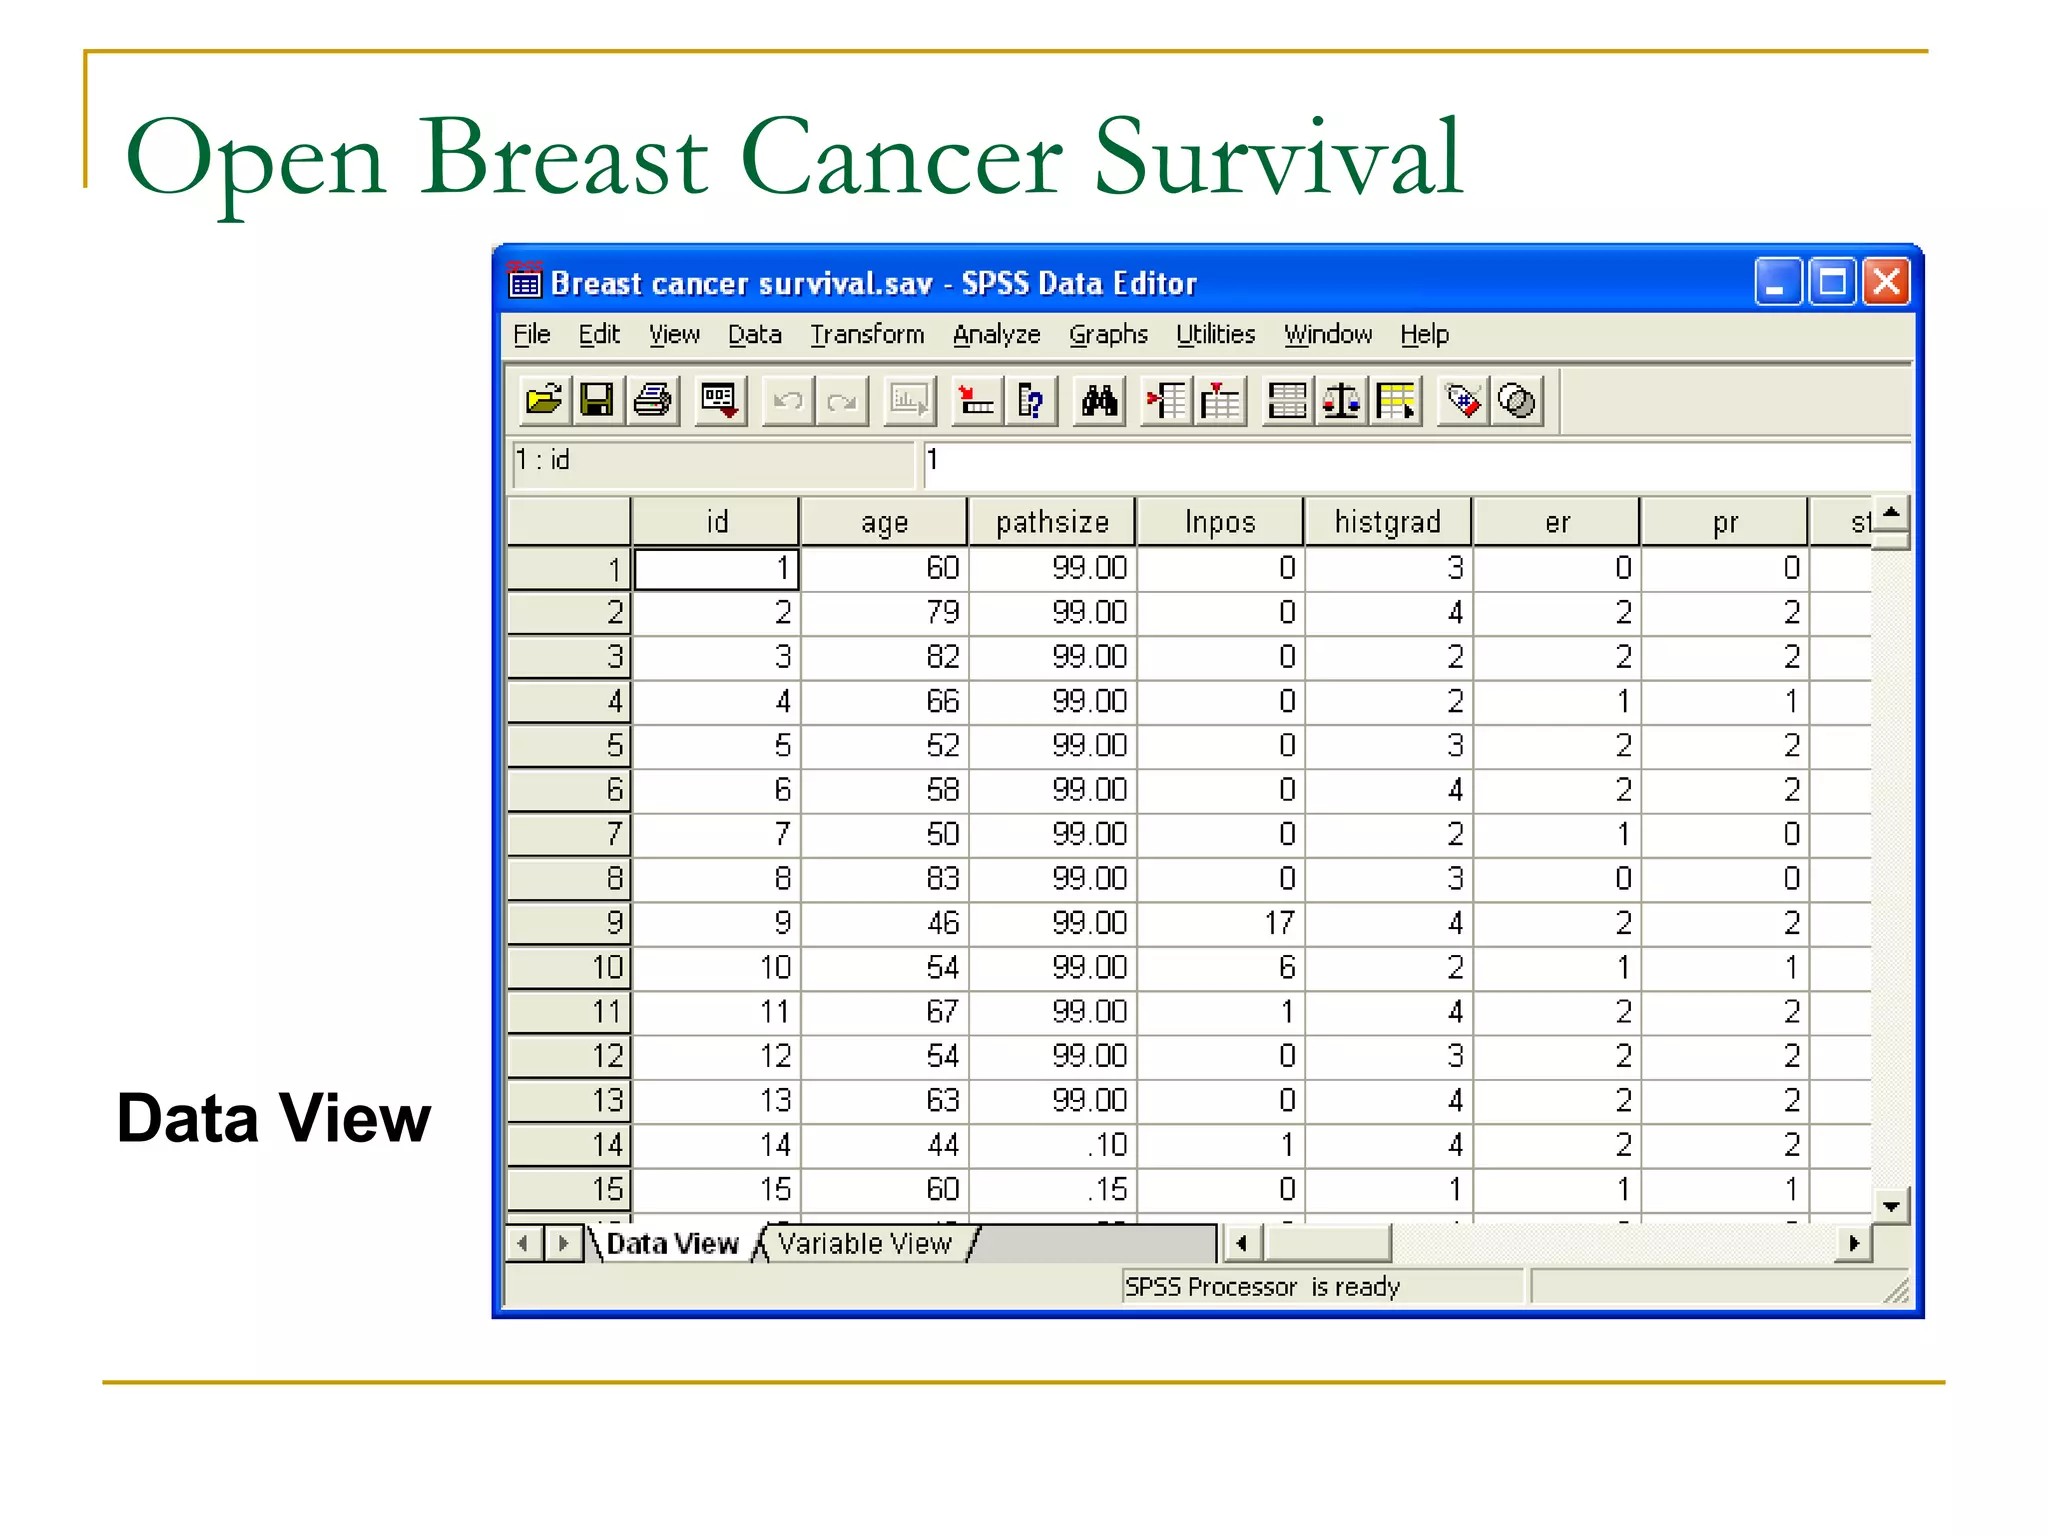
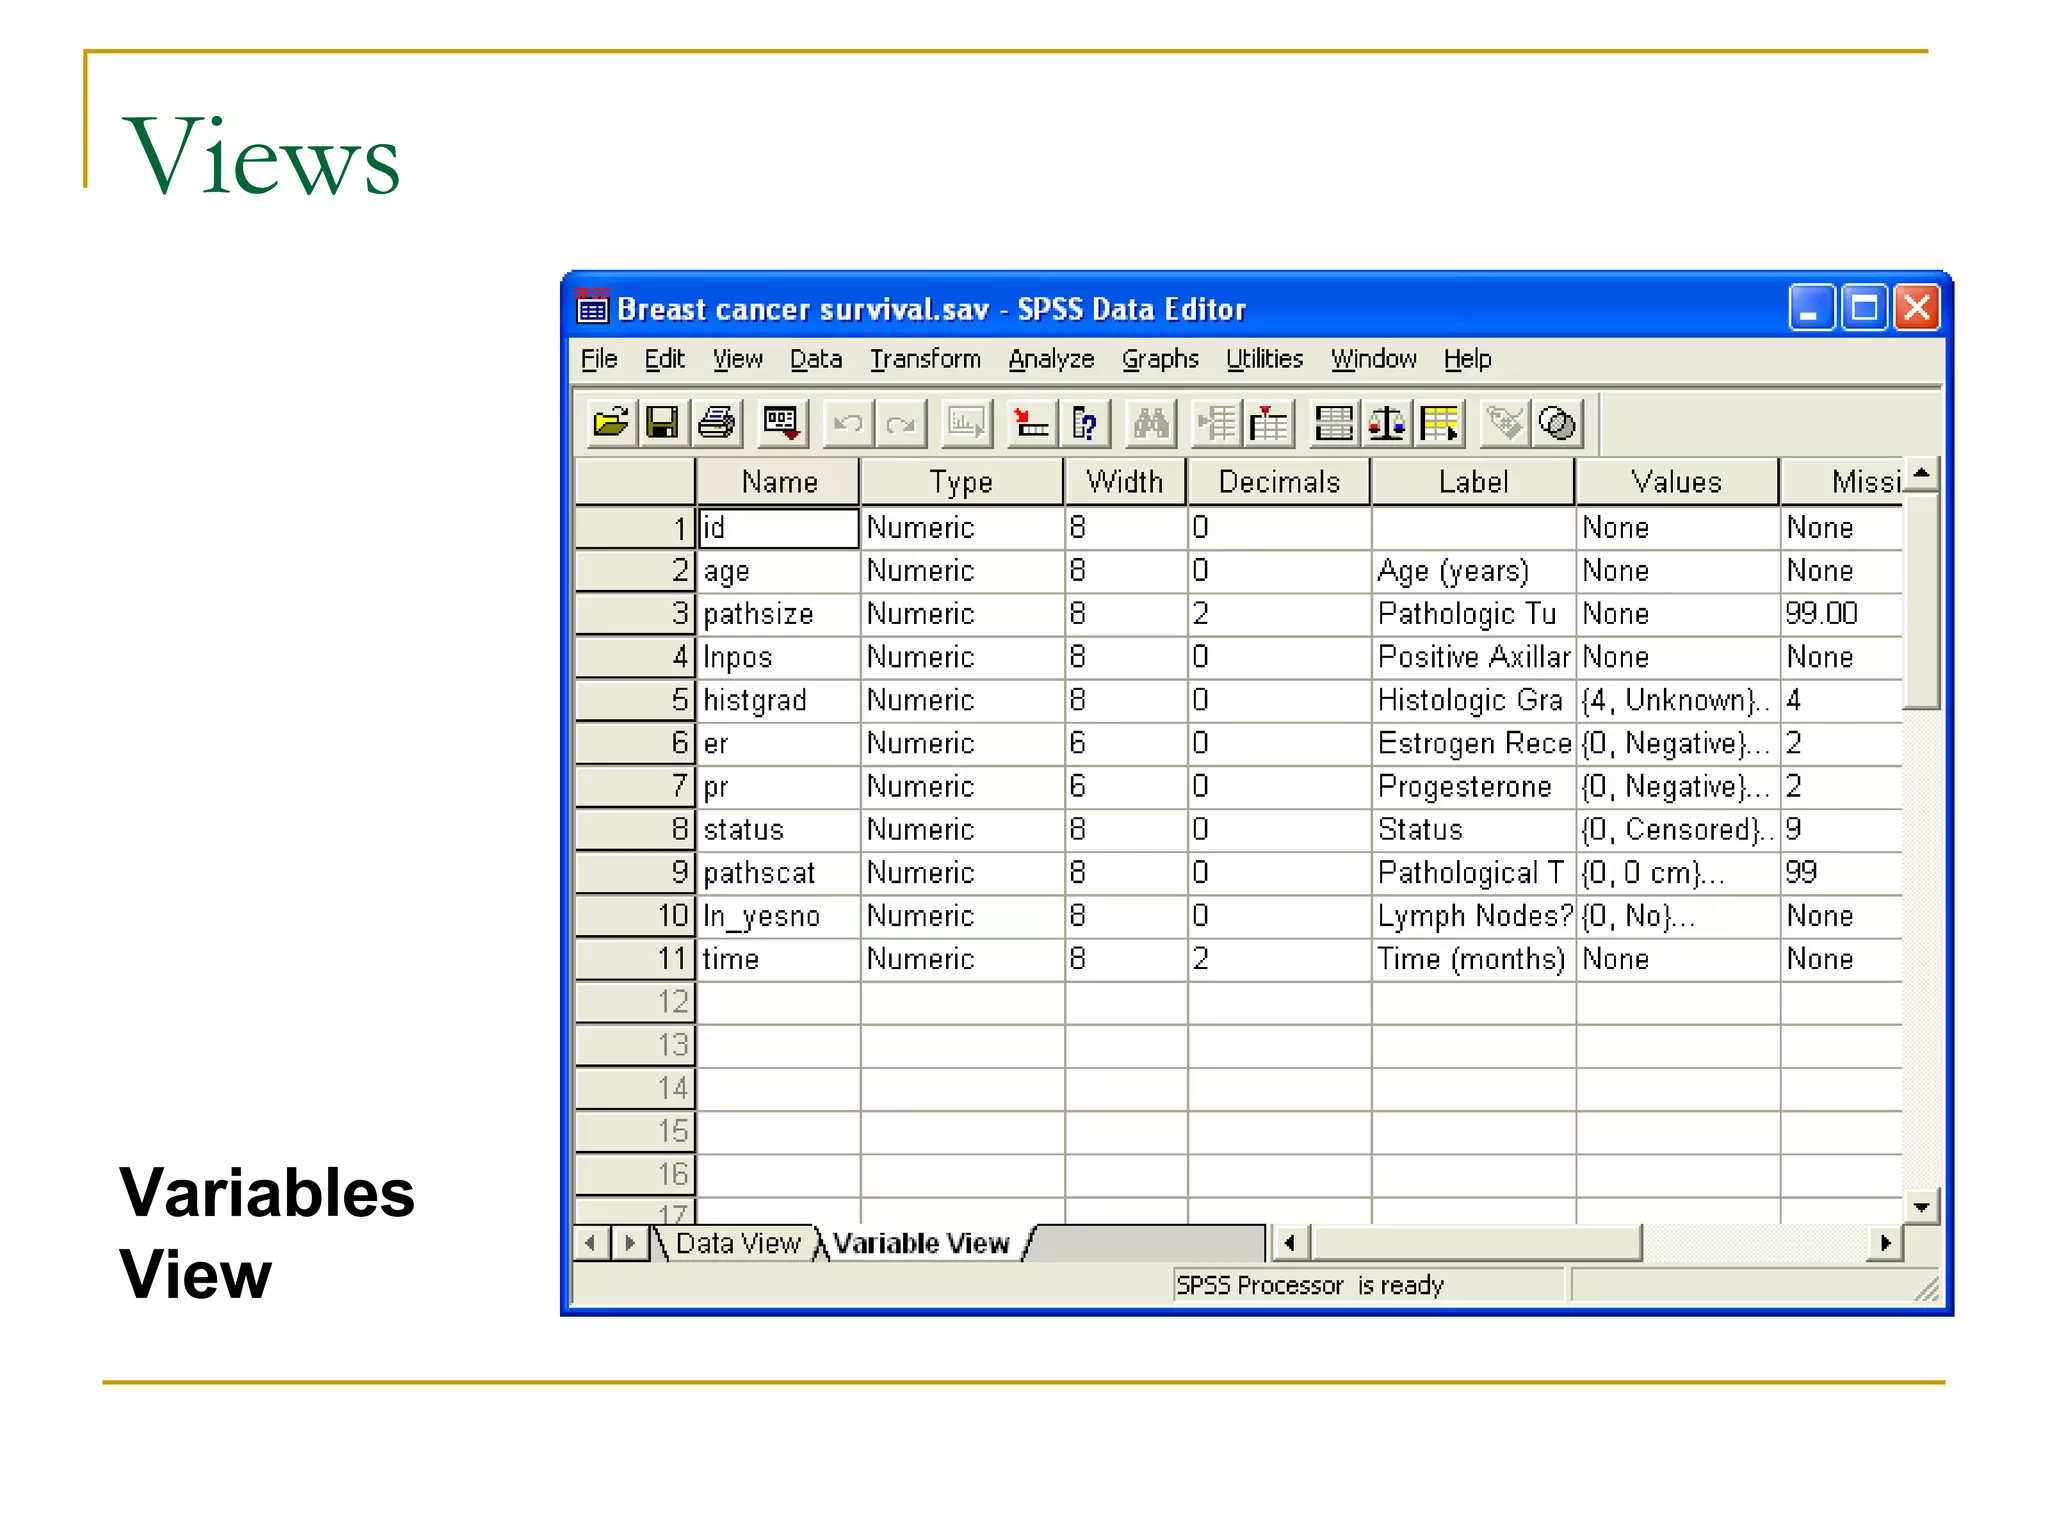
Data Tables Fieldnames at top Each row is a record (sample) Sorting whole table By one column By more than one column Sorting individual sections
32.
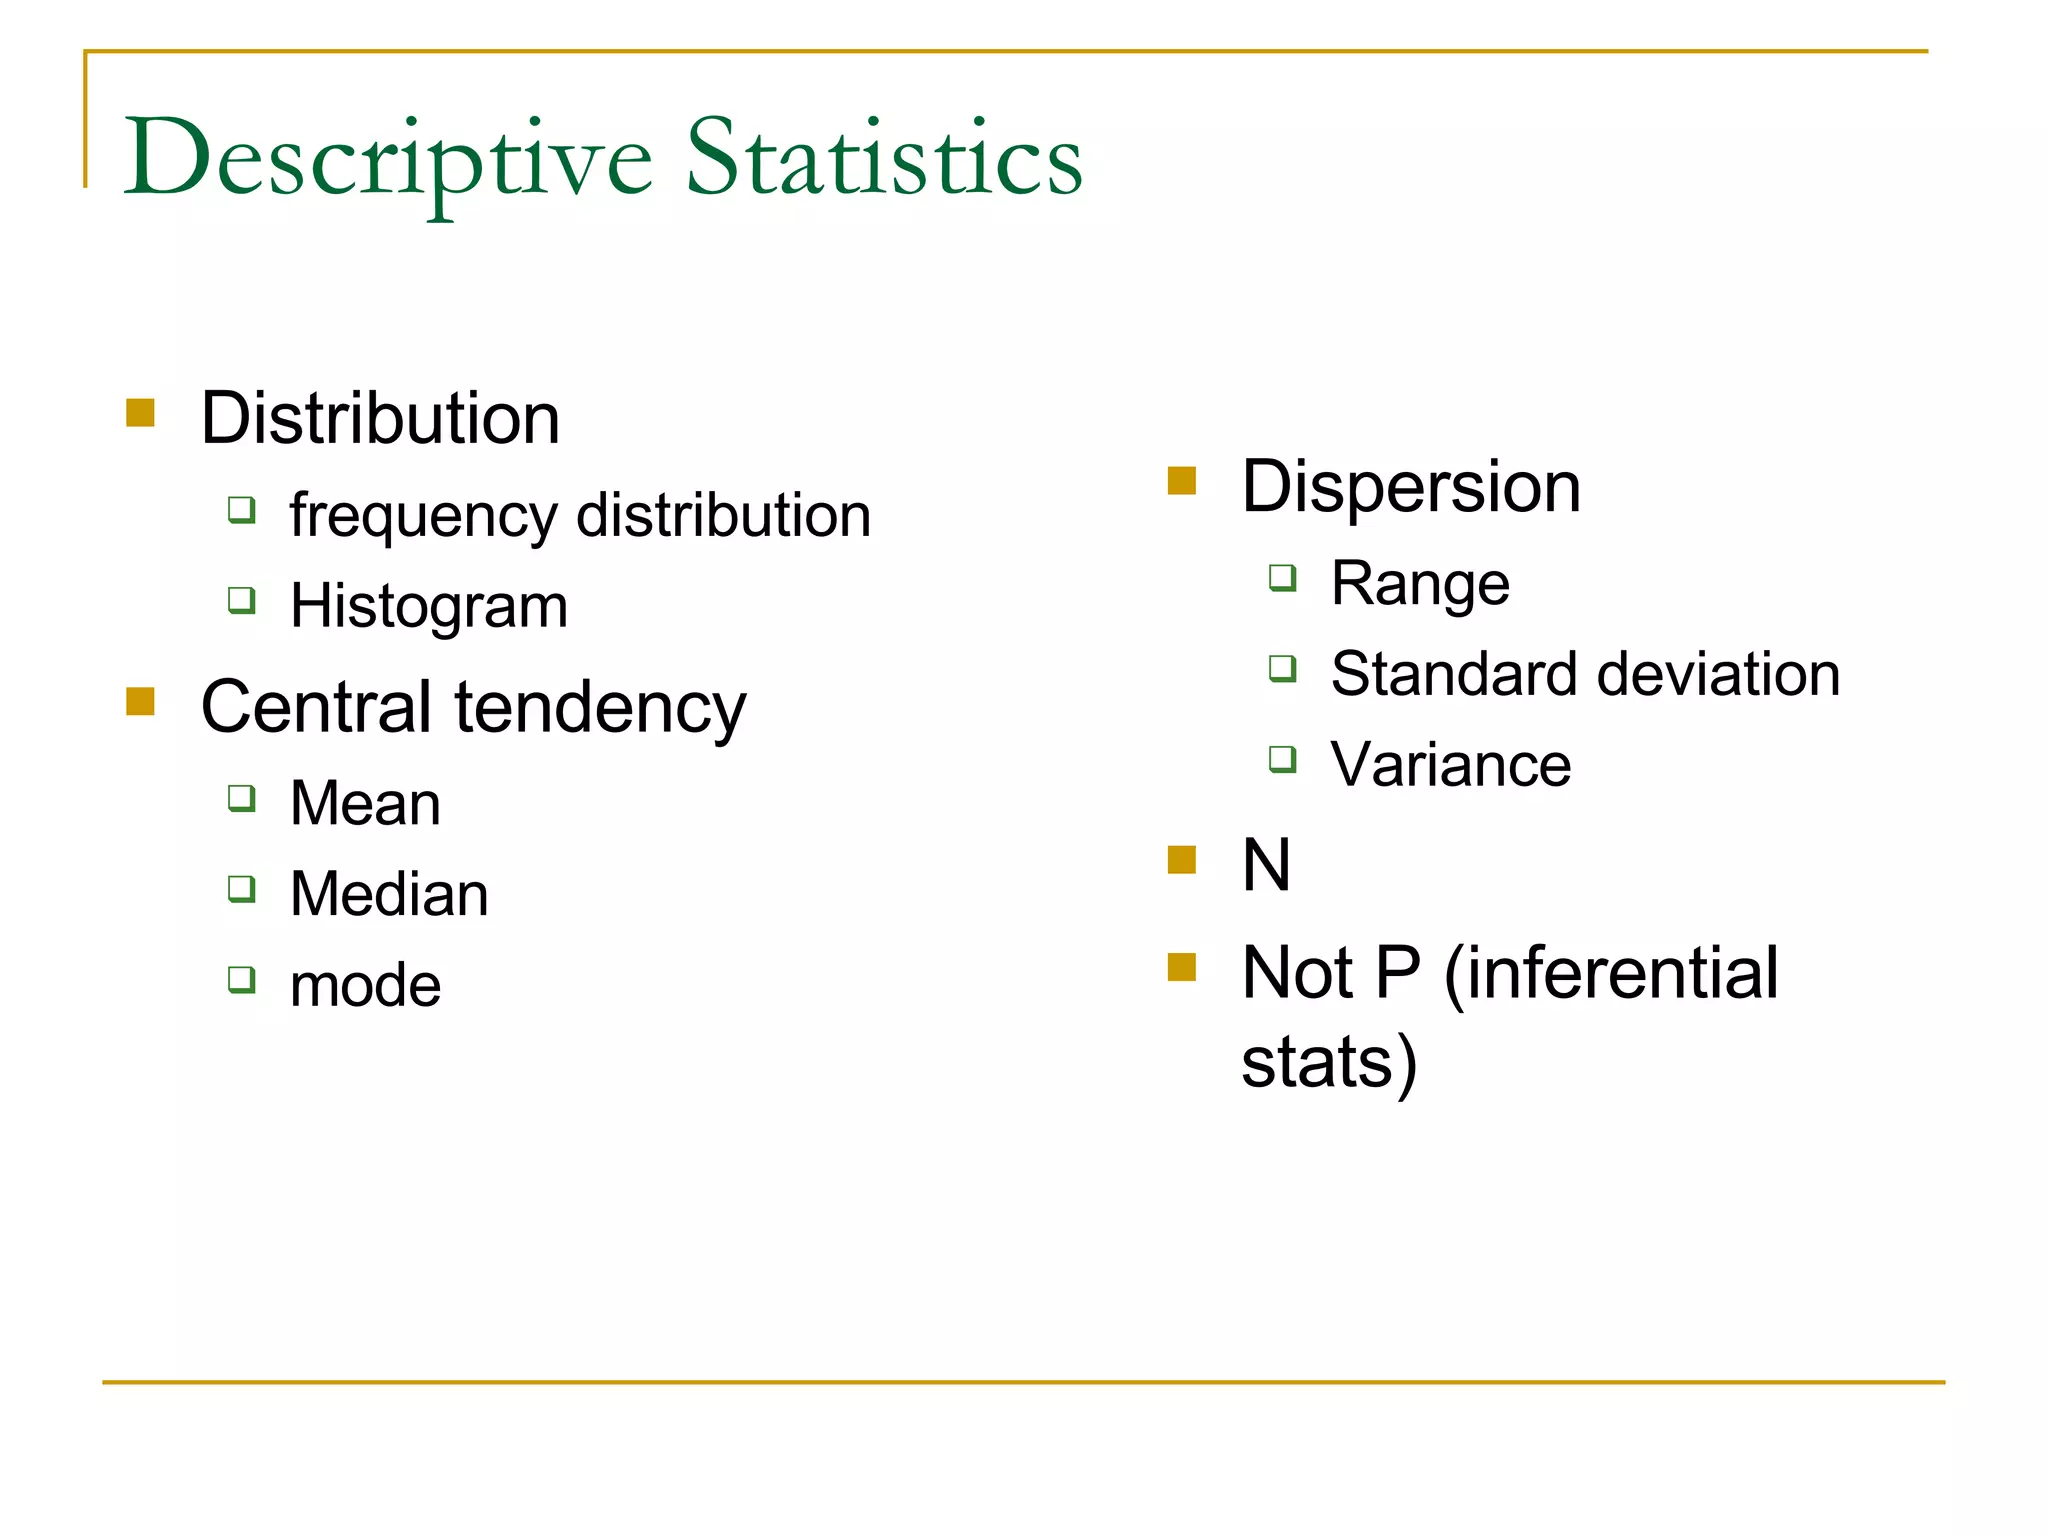
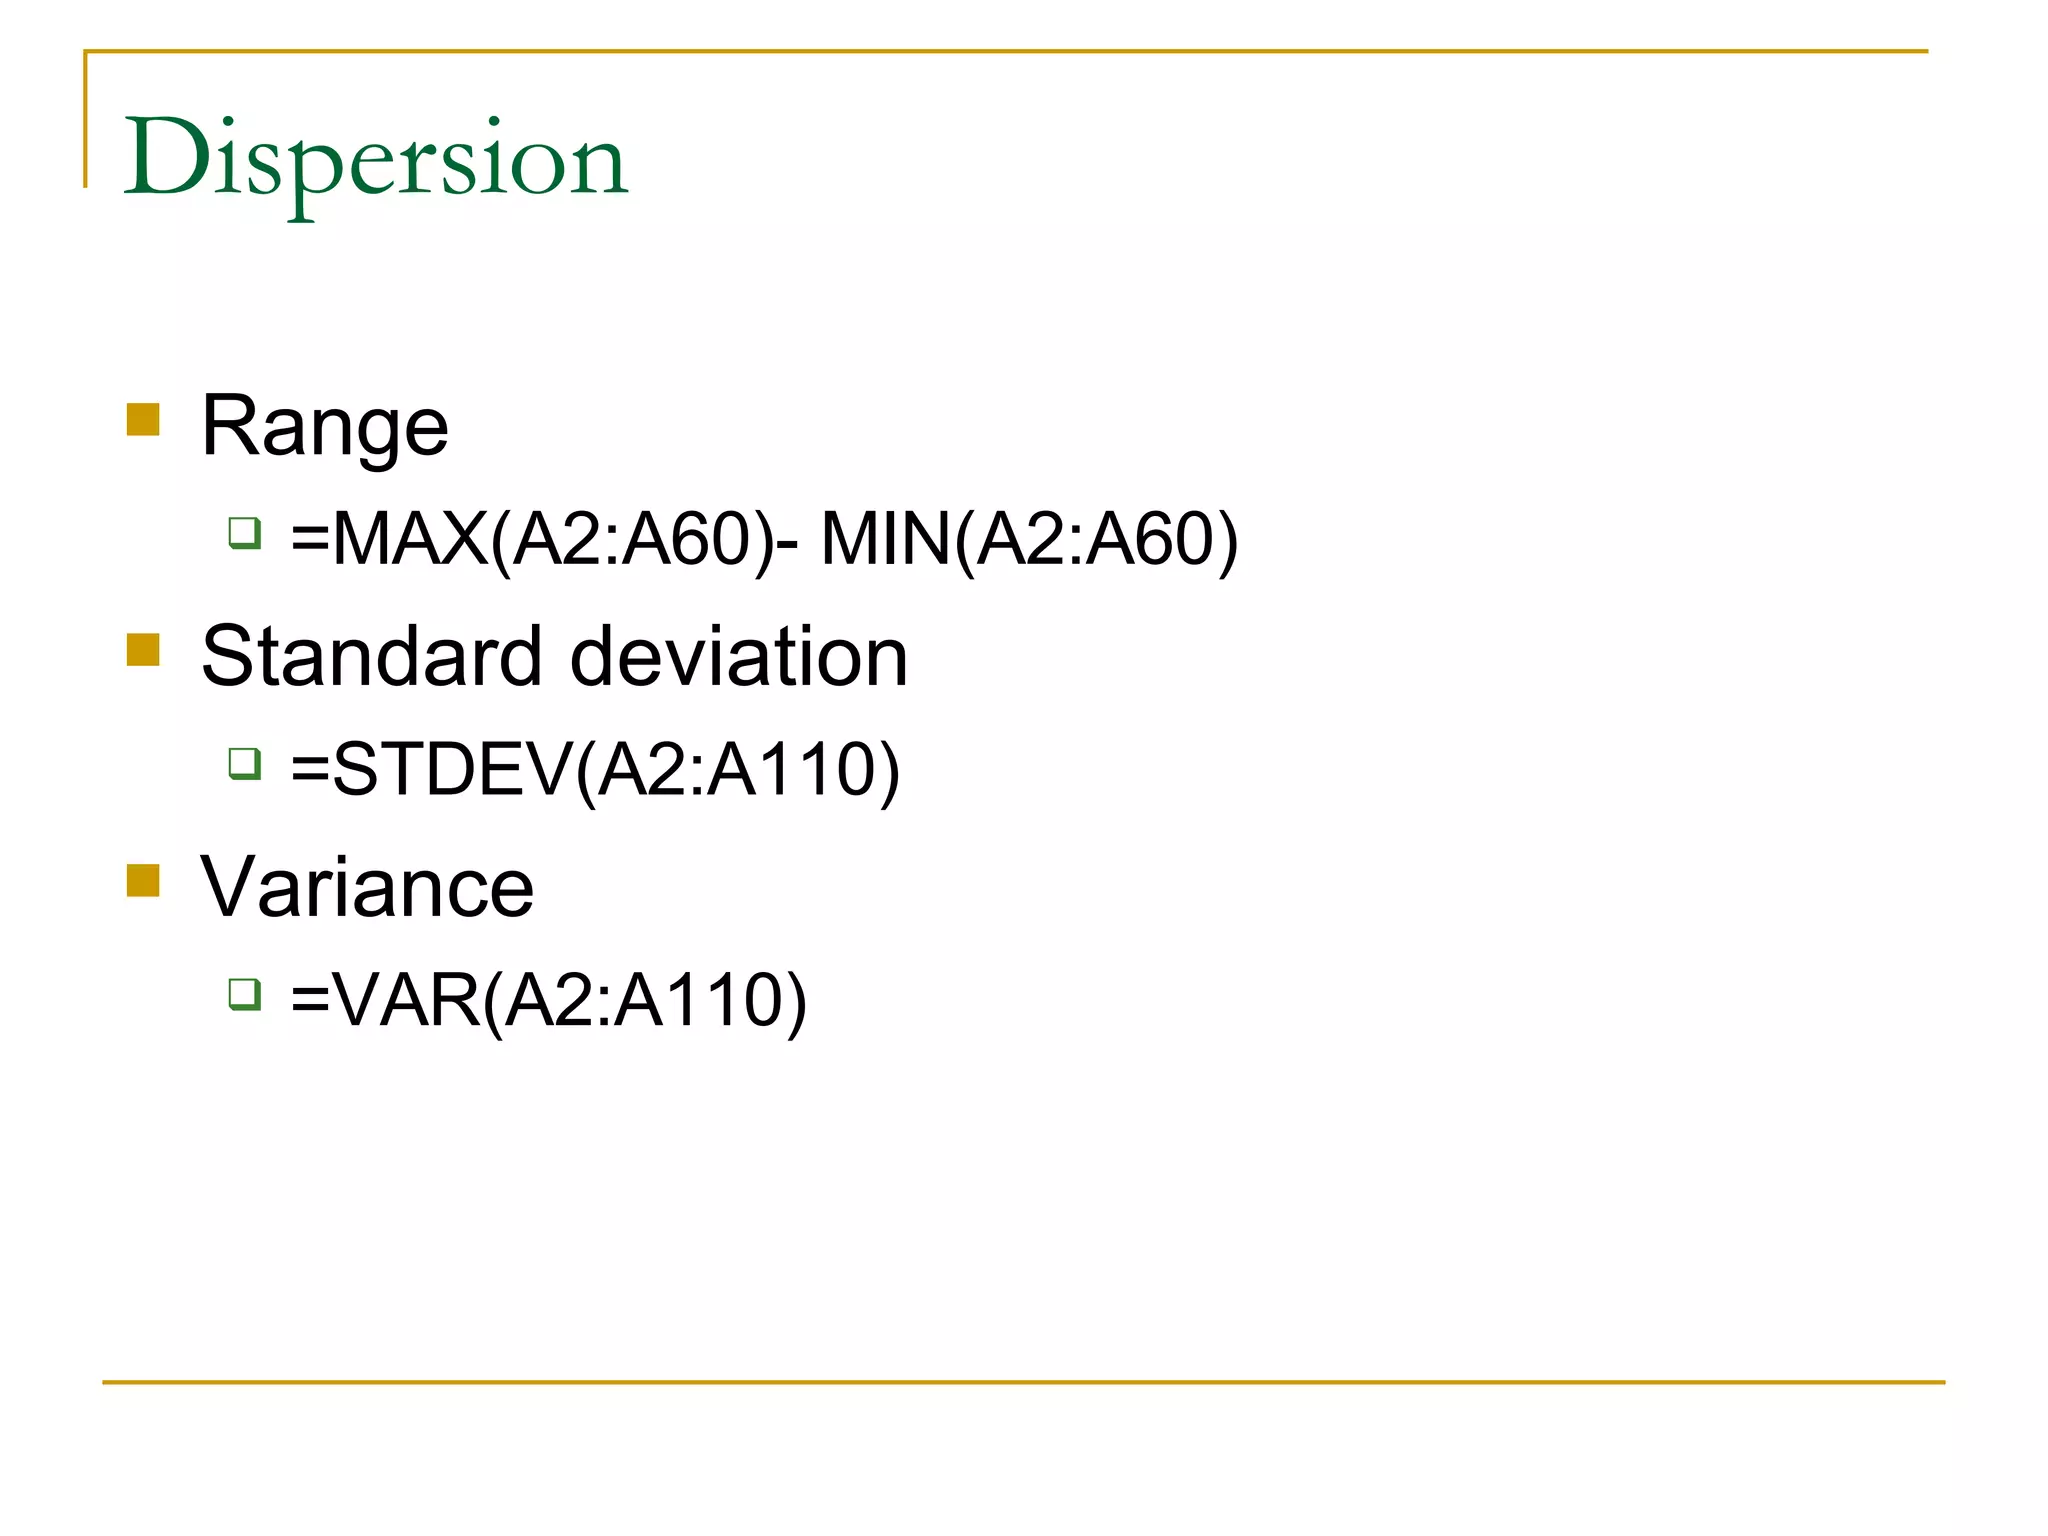
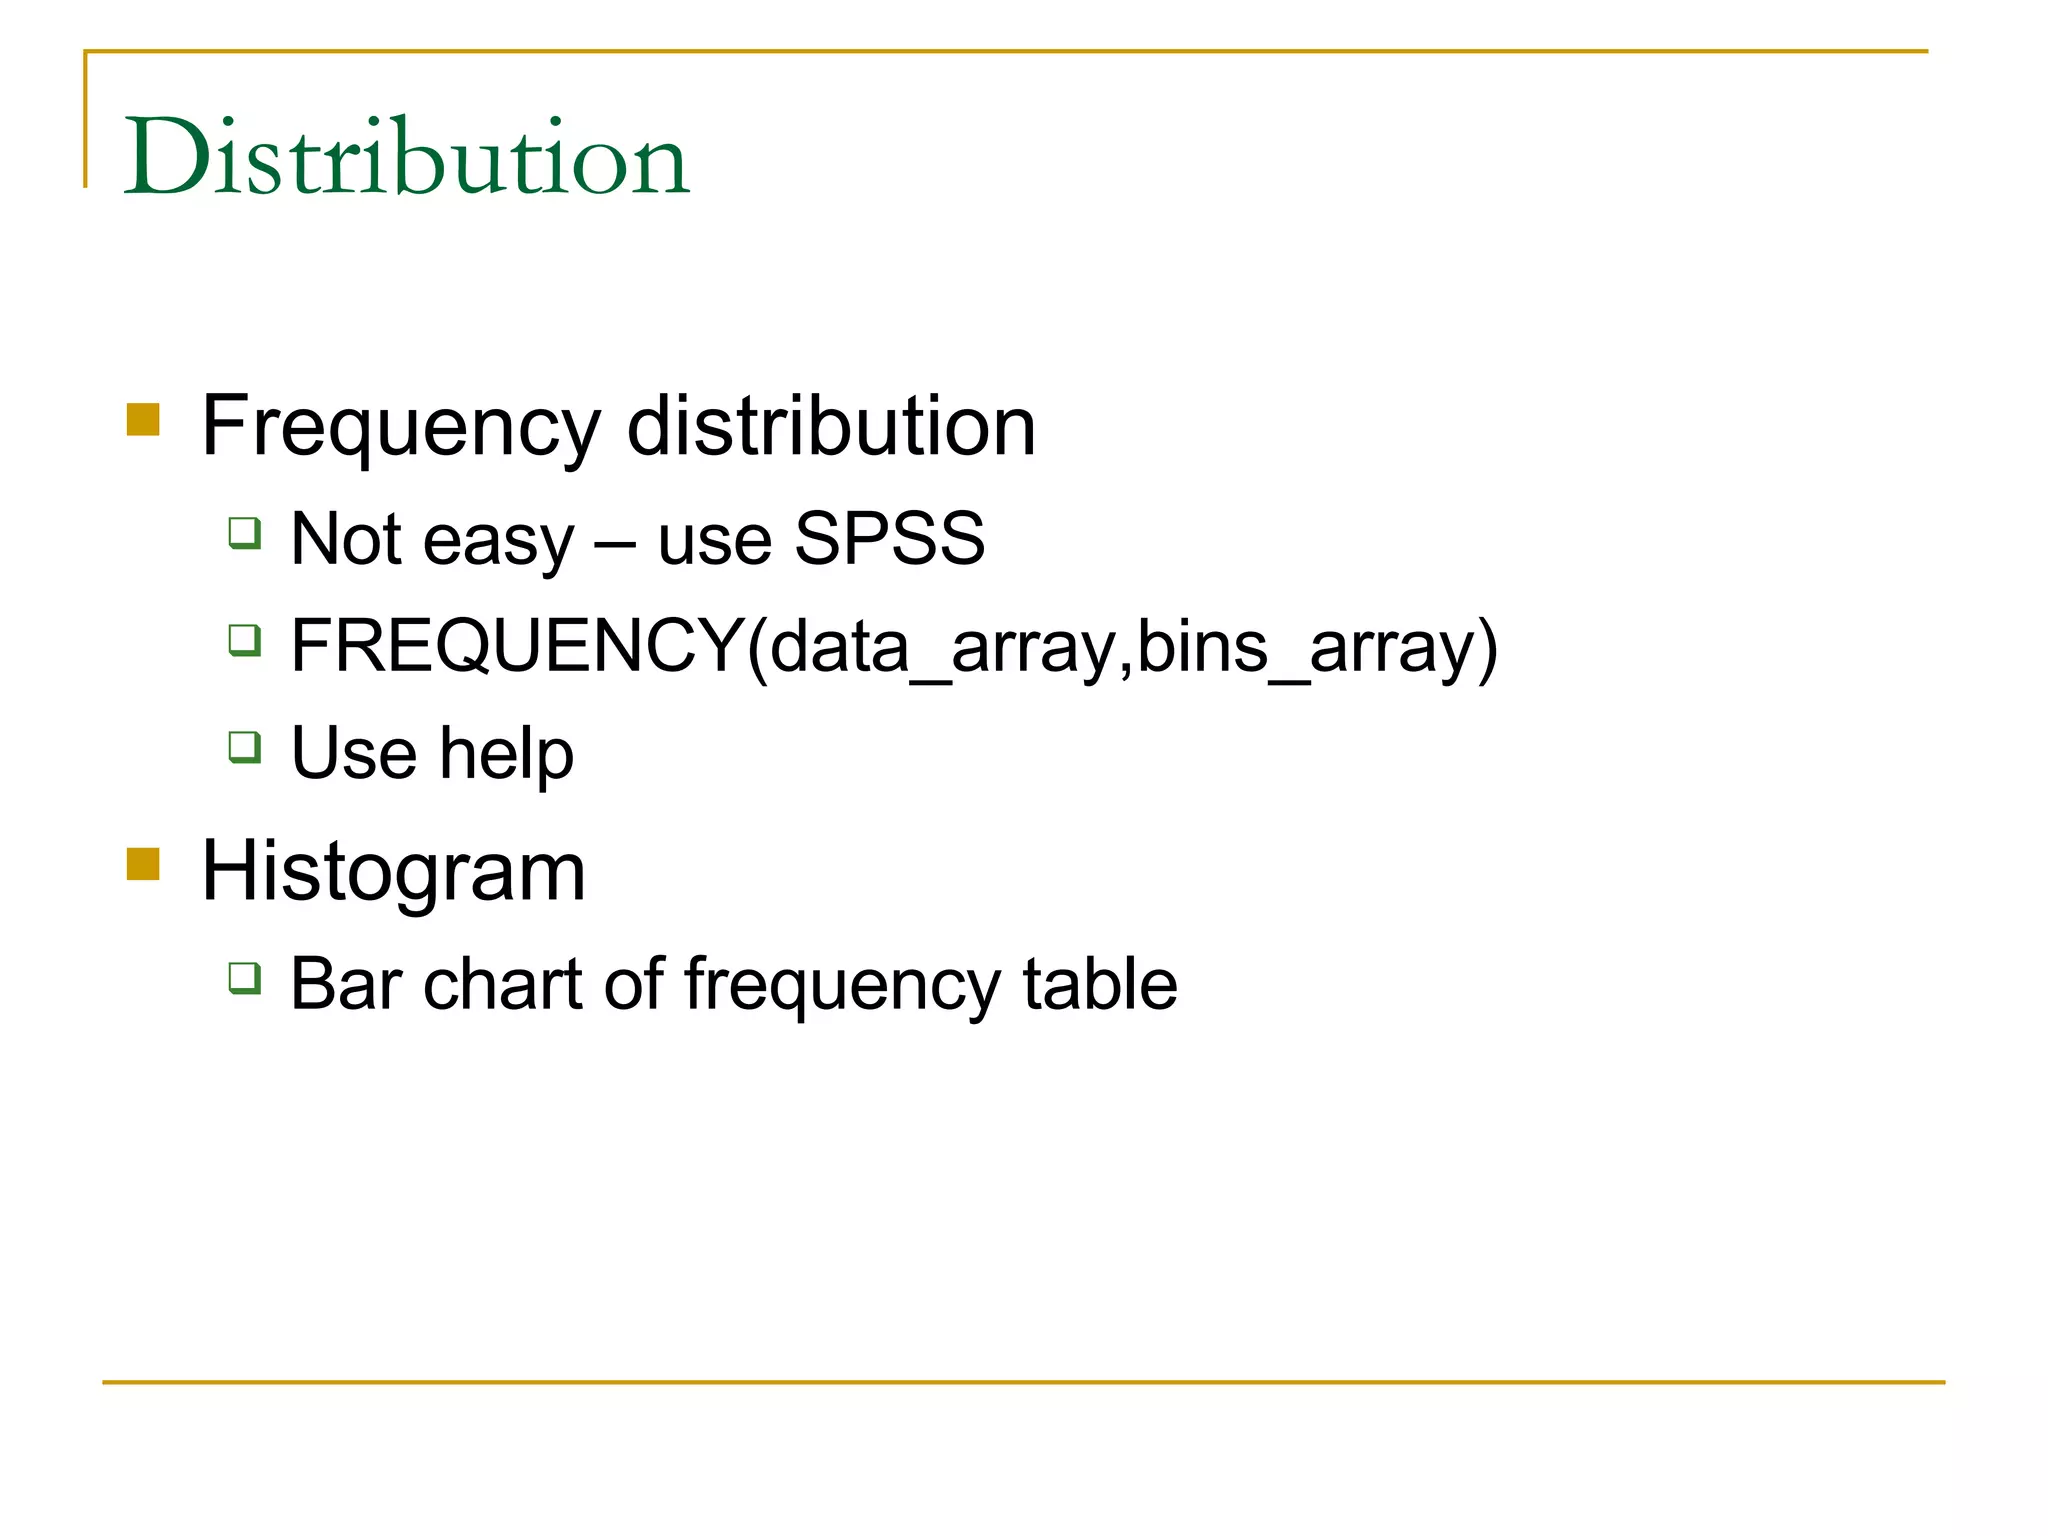
Descriptive Statistics Distributionfrequency distribution Histogram Central tendency Mean Median mode Dispersion Range Standard deviation Variance N Not P (inferential stats)
33.
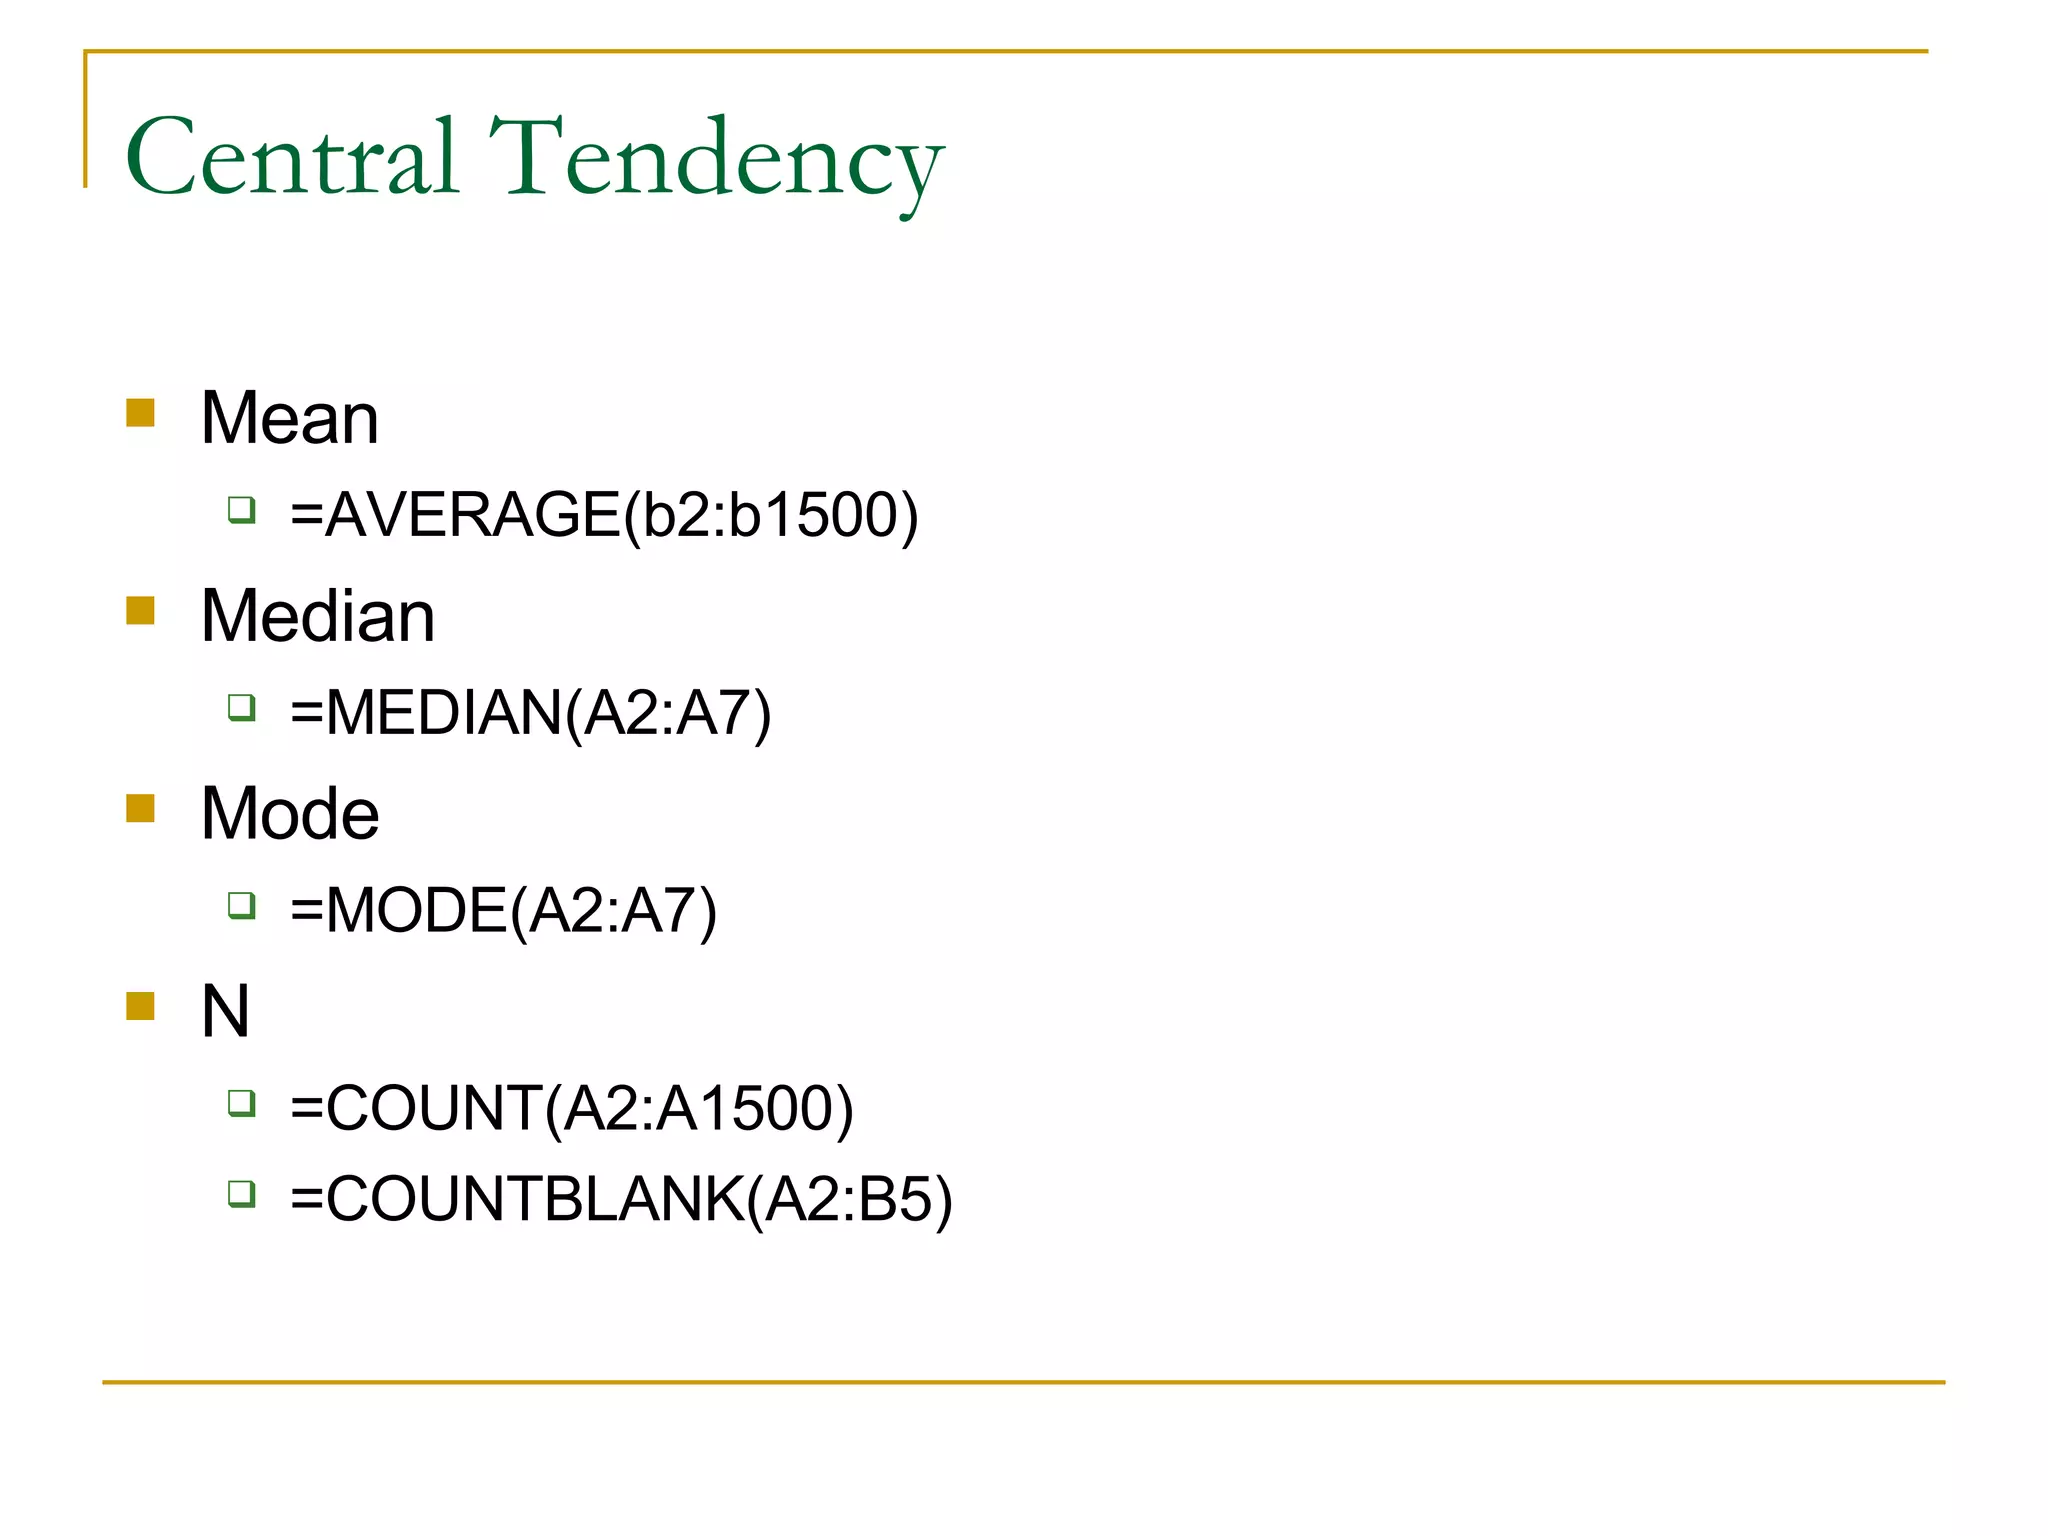
Central Tendency Mean=AVERAGE(b2:b1500) Median =MEDIAN(A2:A7) Mode =MODE(A2:A7) N =COUNT(A2:A1500) =COUNTBLANK(A2:B5)
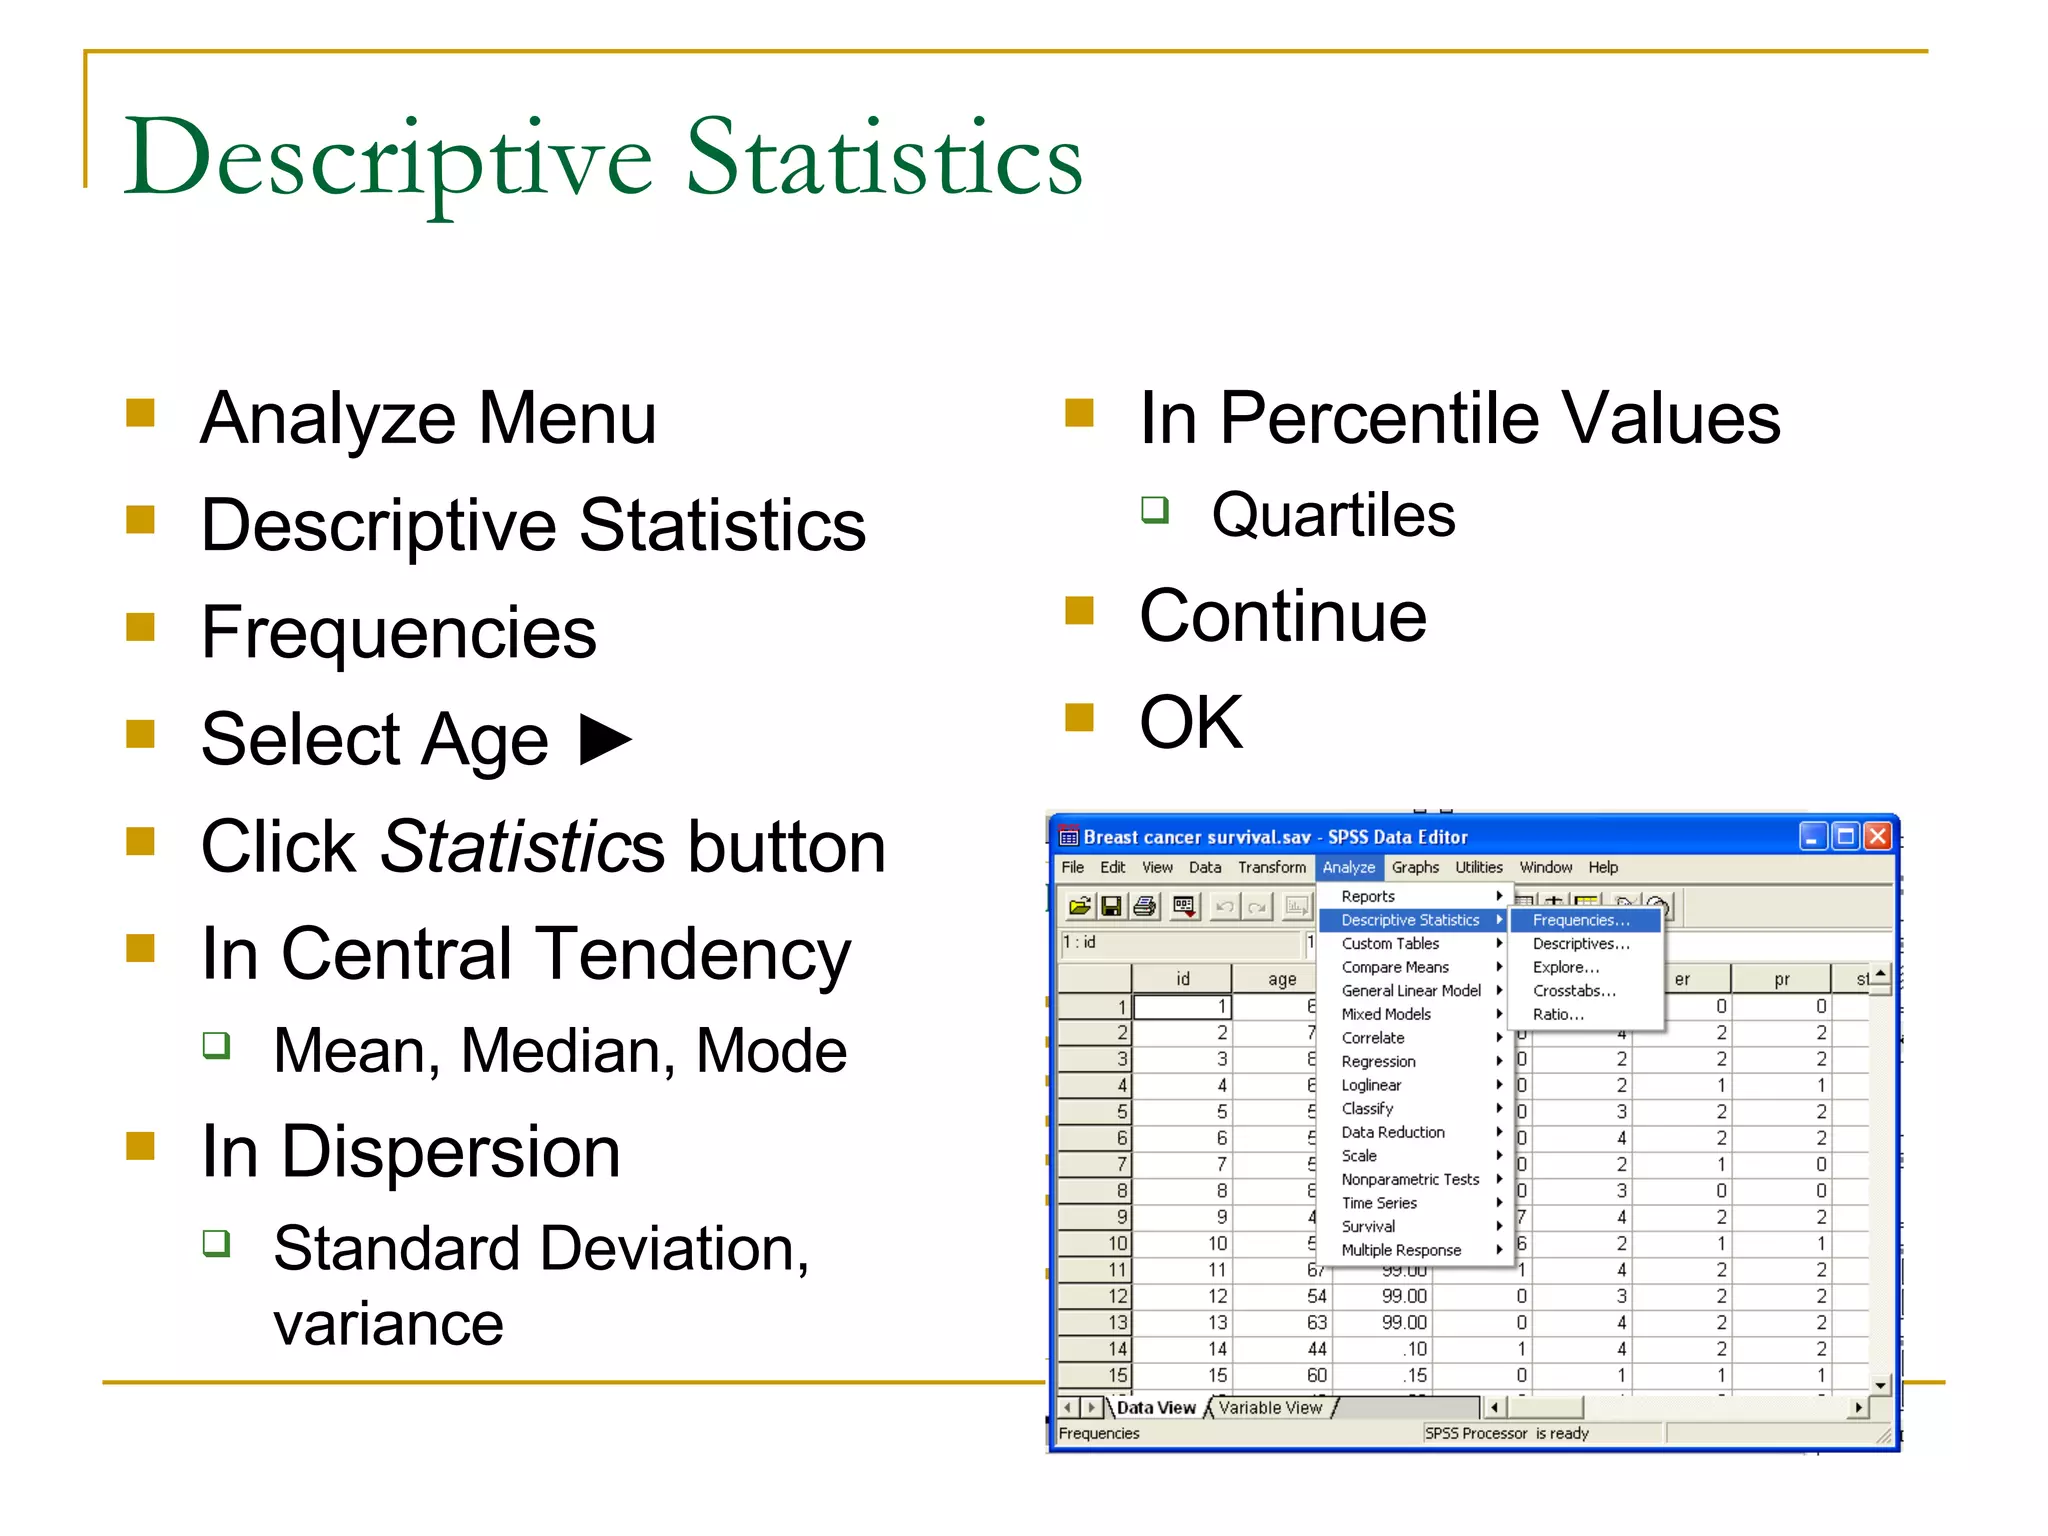
Descriptive Statistics AnalyzeMenu Descriptive Statistics Frequencies Select Age ► Click Statistic s button In Central Tendency Mean, Median, Mode In Dispersion Standard Deviation, variance In Percentile Values Quartiles Continue OK
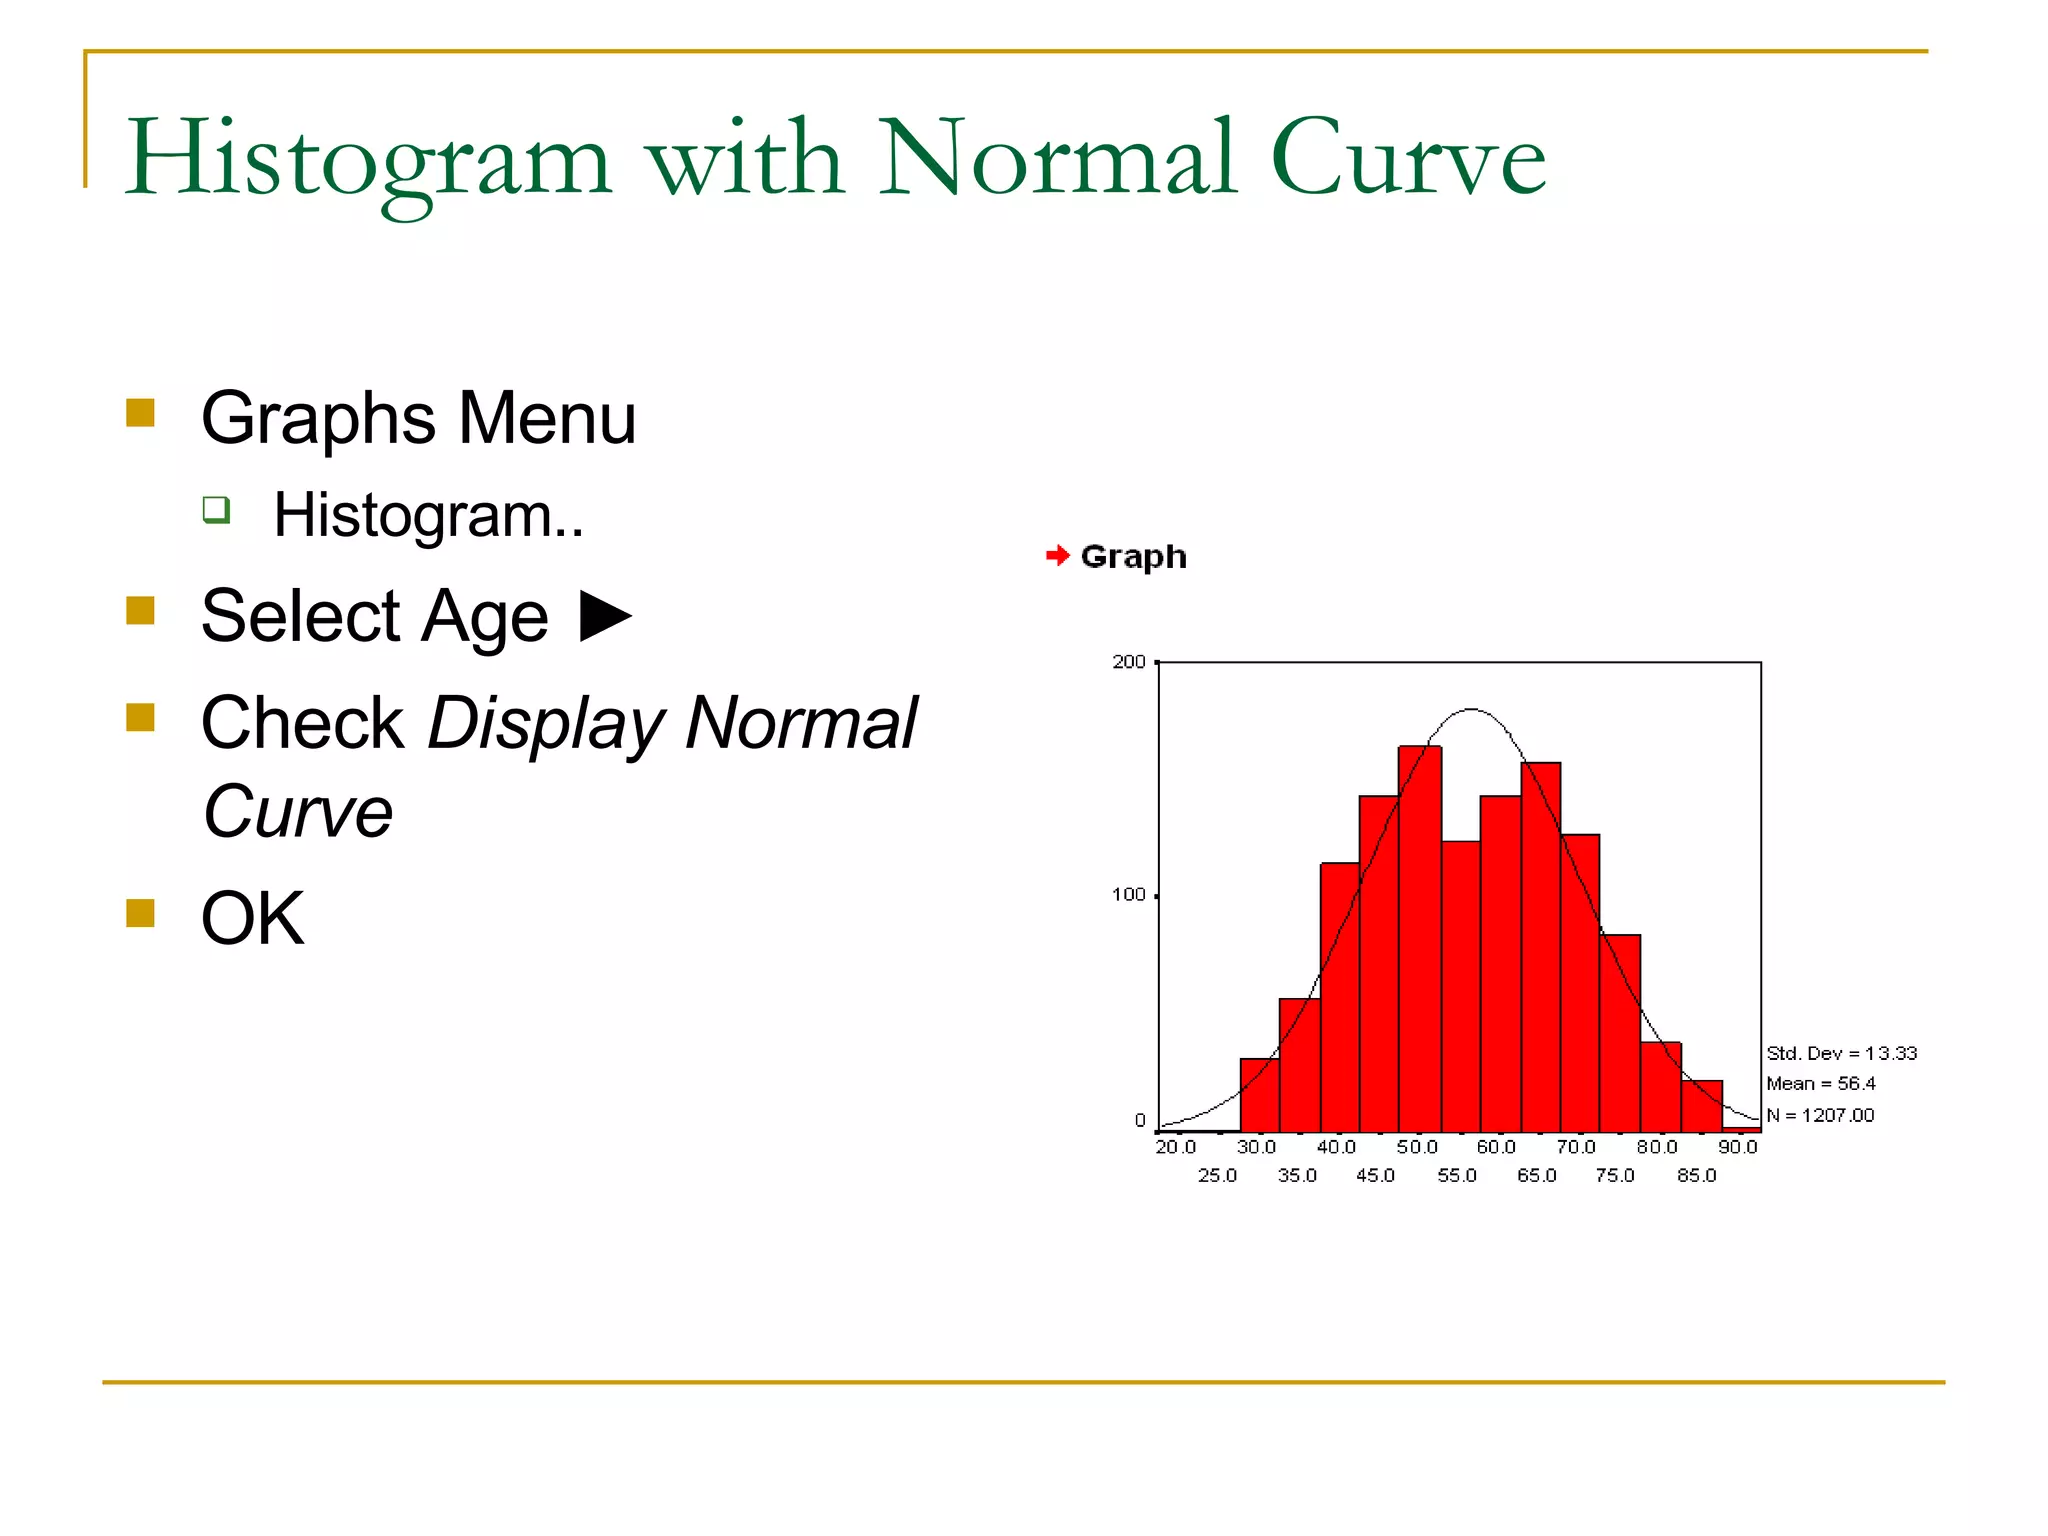
Histogram with NormalCurve Graphs Menu Histogram.. Select Age ► Check Display Normal Curve OK
46.
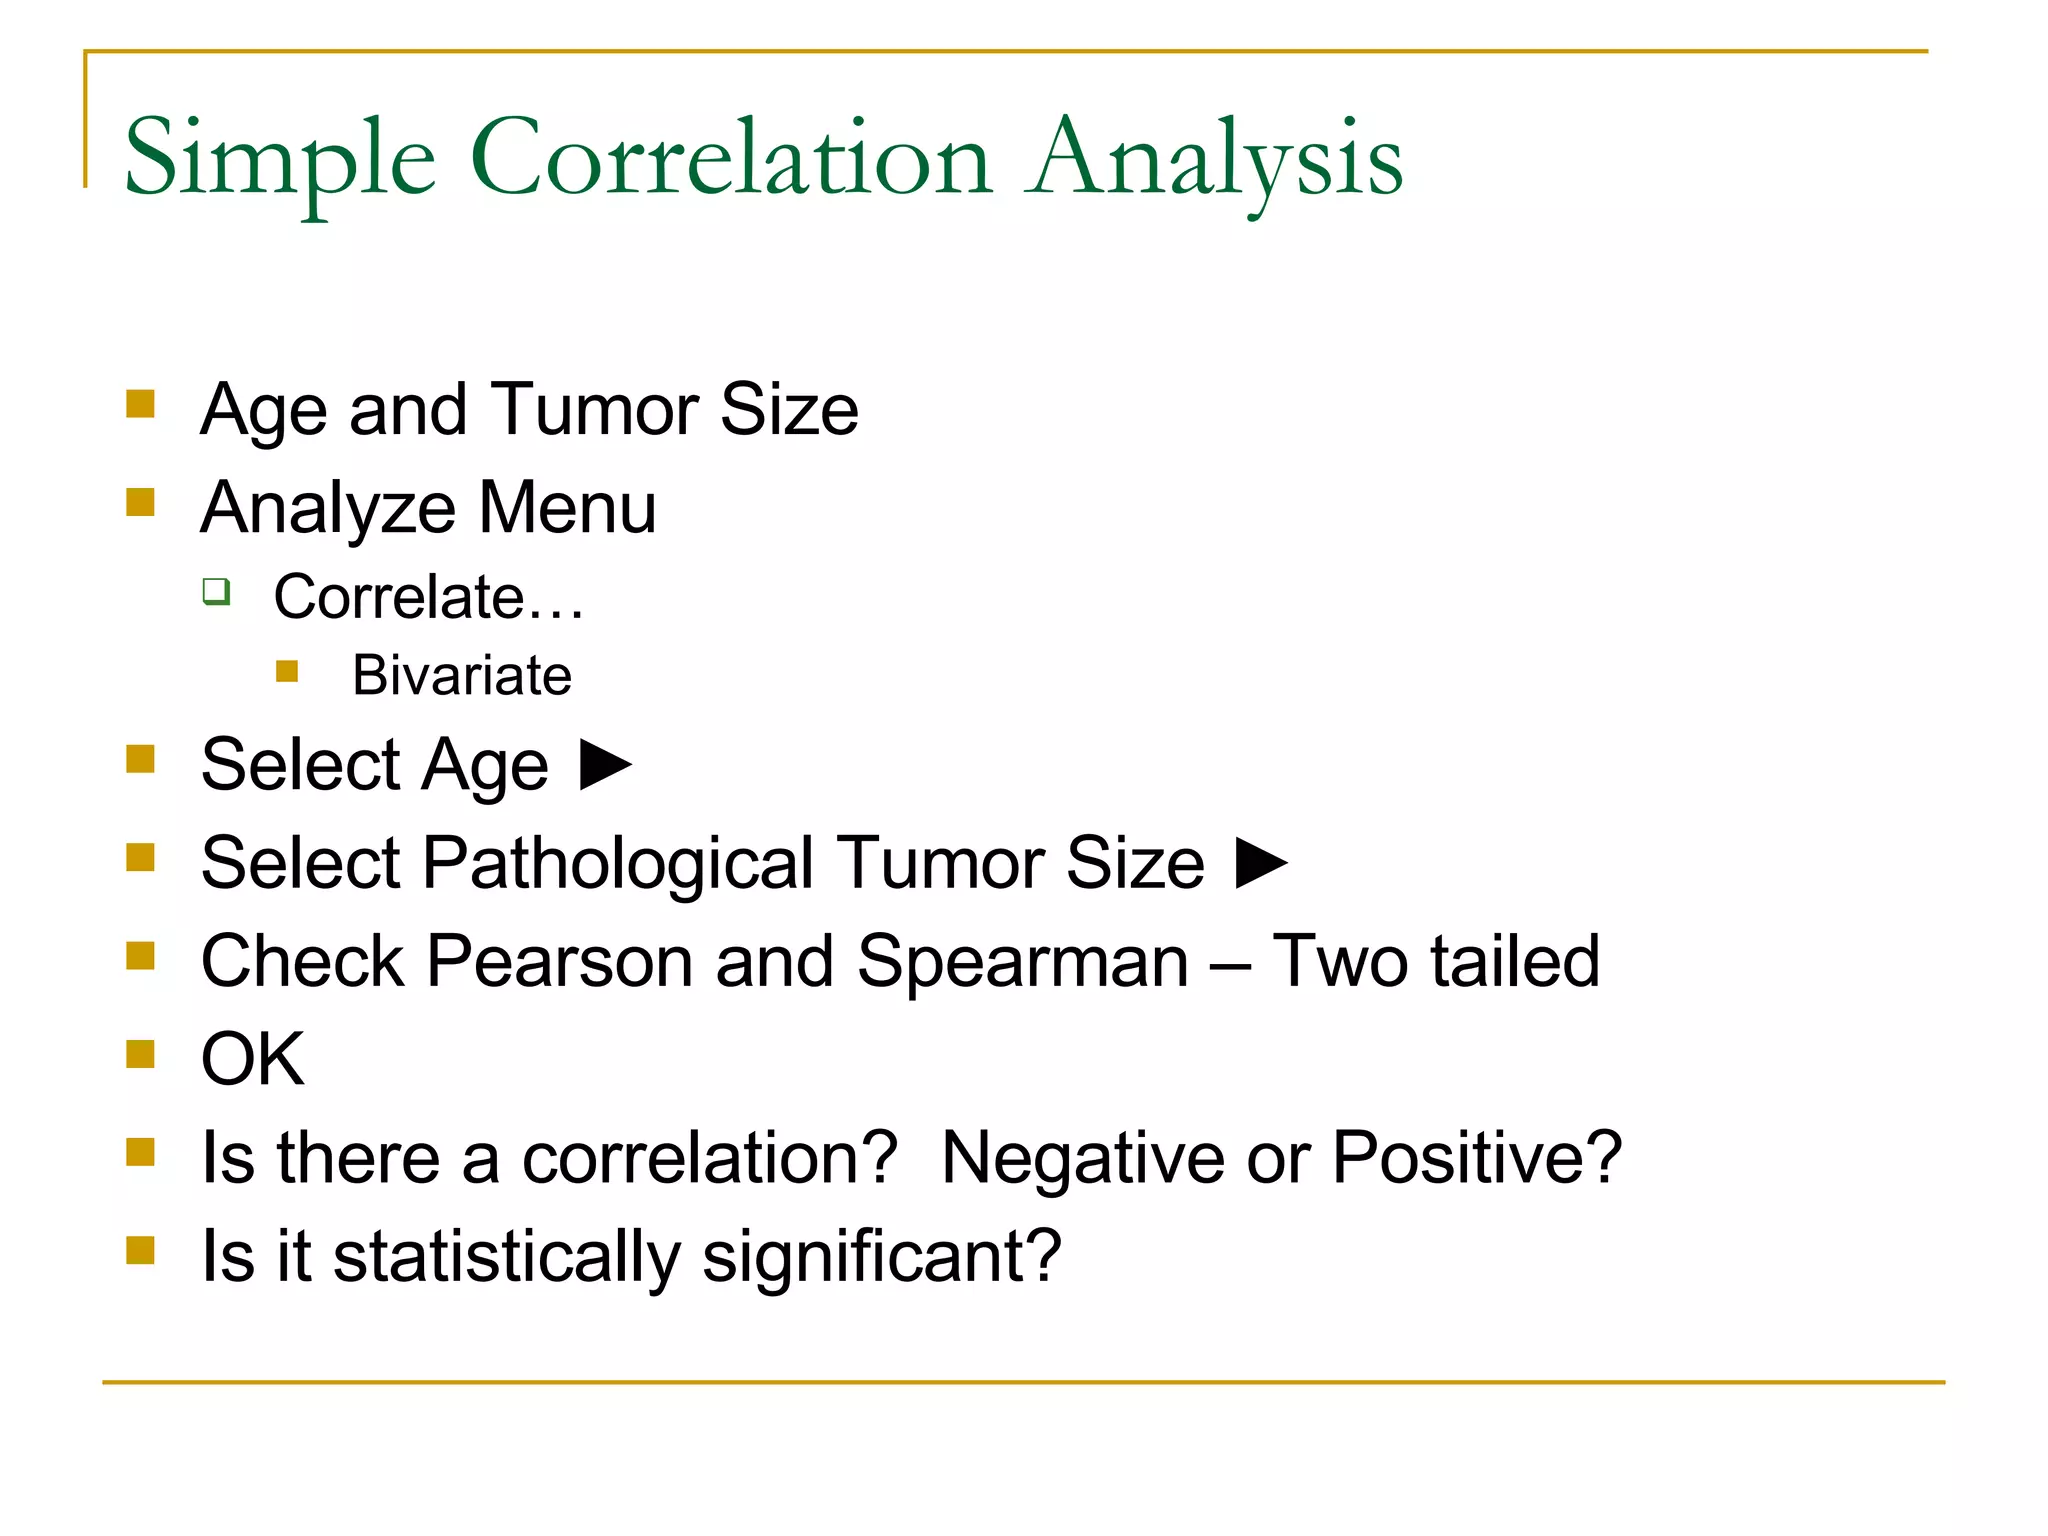
Simple Correlation AnalysisAge and Tumor Size Analyze Menu Correlate… Bivariate Select Age ► Select Pathological Tumor Size ► Check Pearson and Spearman – Two tailed OK Is there a correlation? Negative or Positive? Is it statistically significant?
47.
Save Output Saveon All Users drive Under Nancy.clark SPSS Output Files Name it your name: ie, KerryBachista.spo
48.
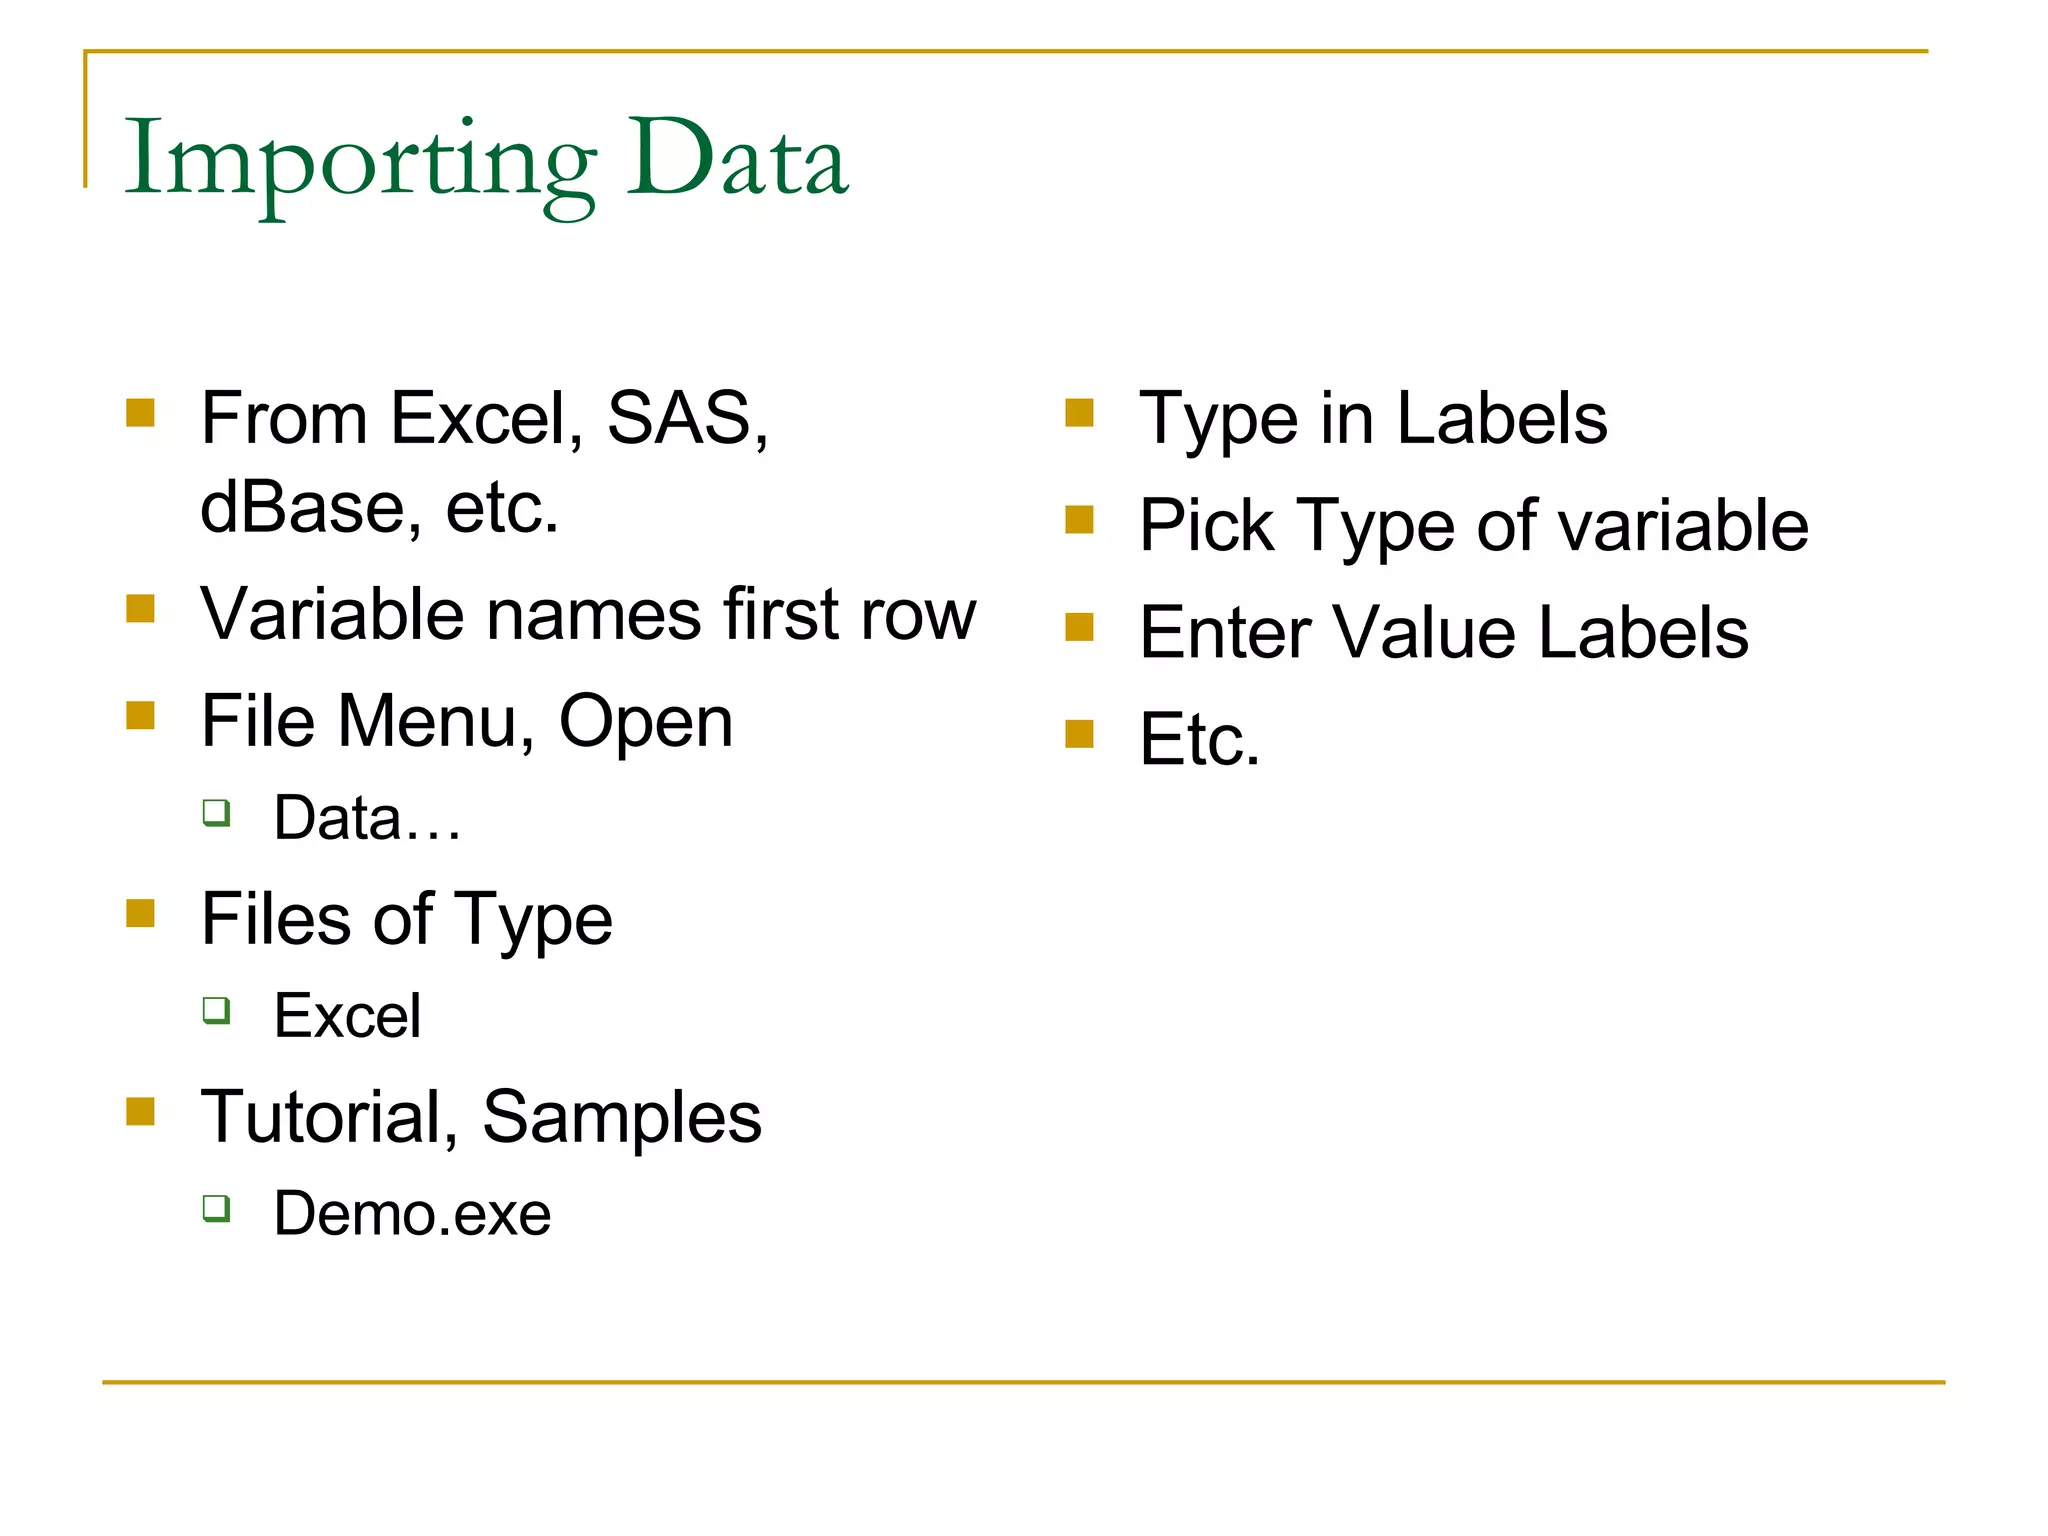
Importing Data FromExcel, SAS, dBase, etc. Variable names first row File Menu, Open Data… Files of Type Excel Tutorial, Samples Demo.exe Type in Labels Pick Type of variable Enter Value Labels Etc.
49.
SPSS Tutorials Inthe Help Menu On Informatics Web page Books: Statistics for Social & Health Research (Sage) Argyrous, George Statistics Applied to Clinical Trials (Klawer Academic Publishers) Cleophas, Ton J., et al
50.
Objectives Determine whatdata exist relative to a clinical question or formal hypothesis use IT to locate existing data sources identify and locate existing data sets Within institution Outside institution Analyze, interpret and report findings Select appropriate computer software: Excel, SPSS Use software to perform simple statistical analysis and portray results graphically Interpret reports