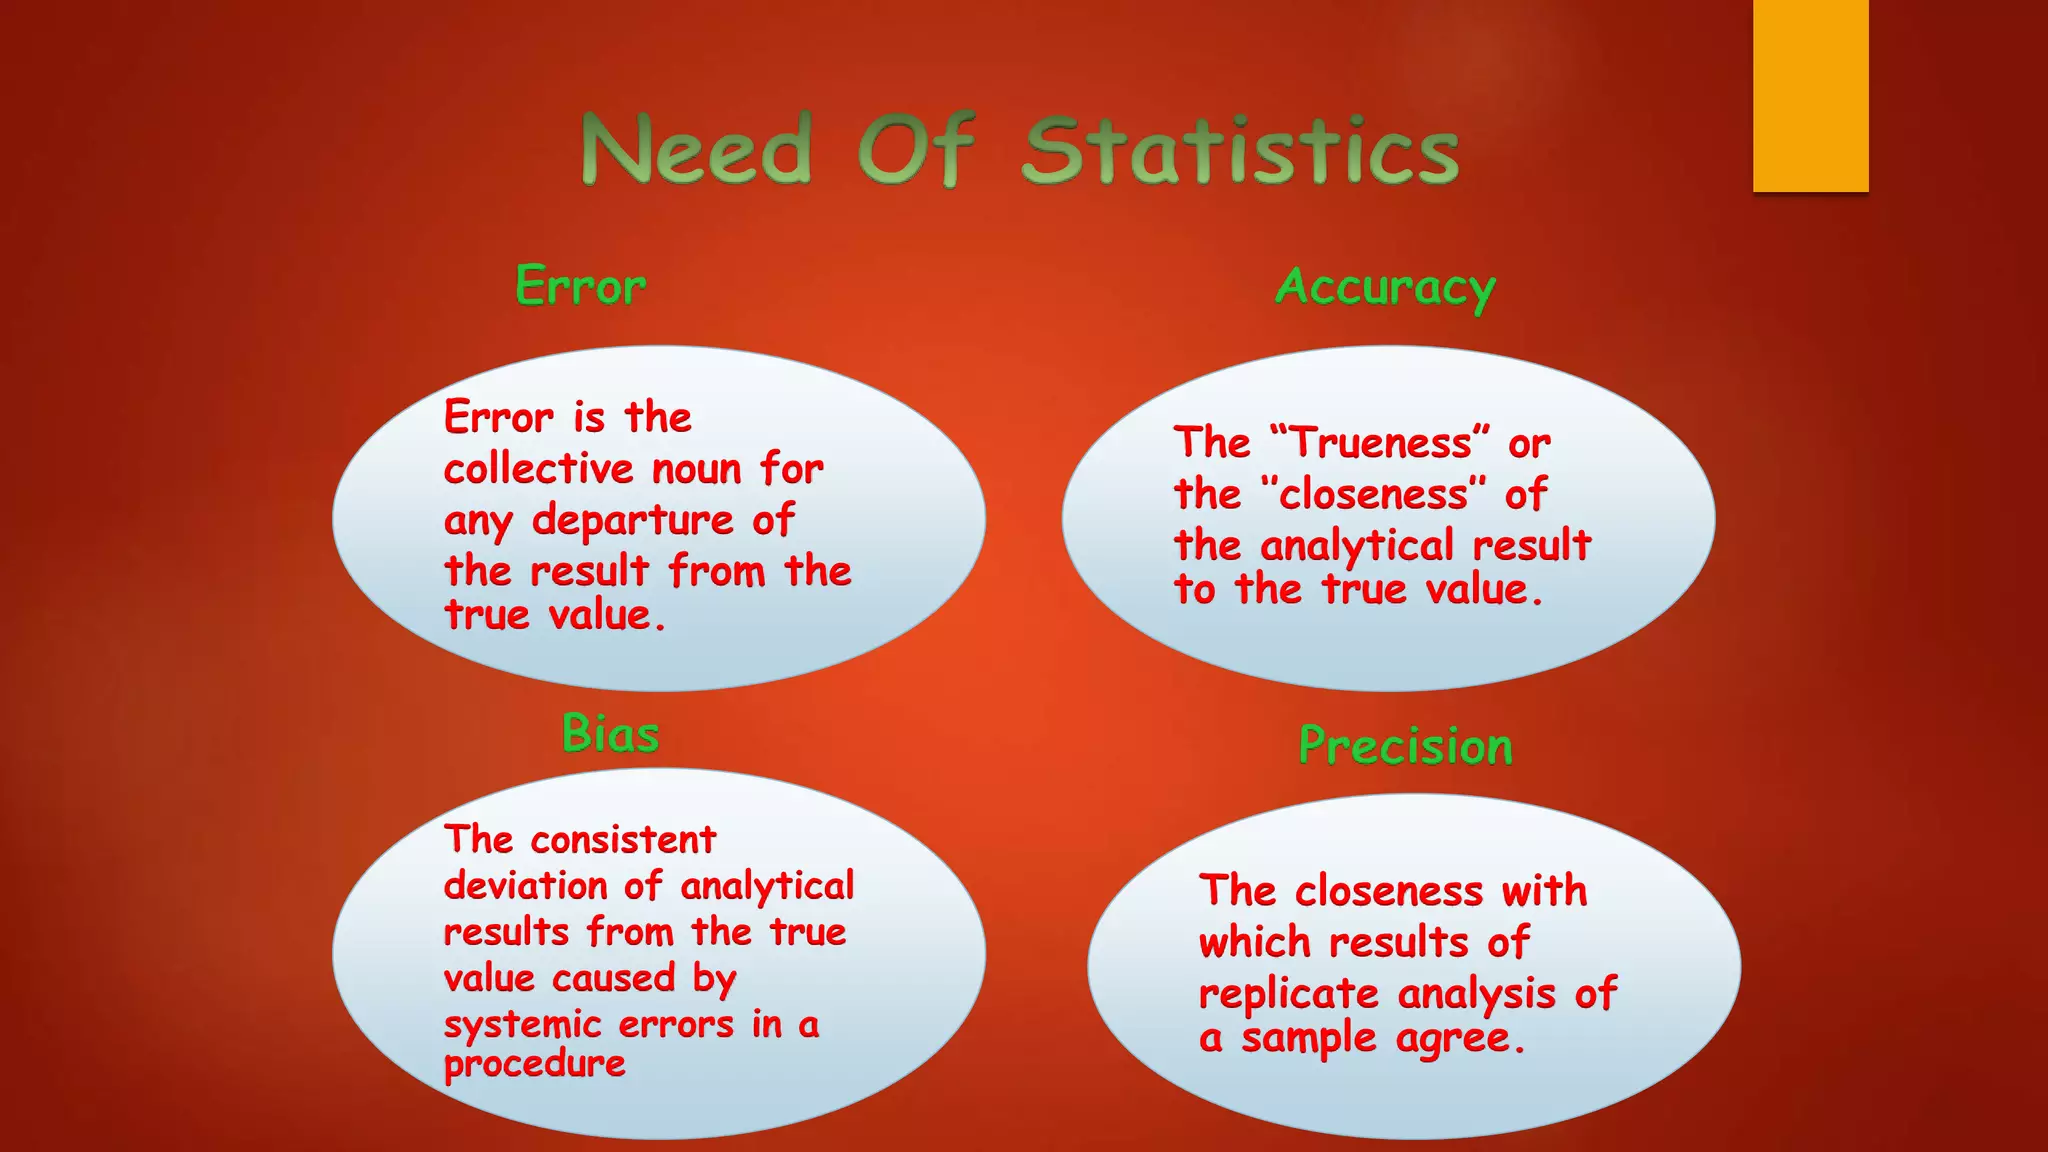
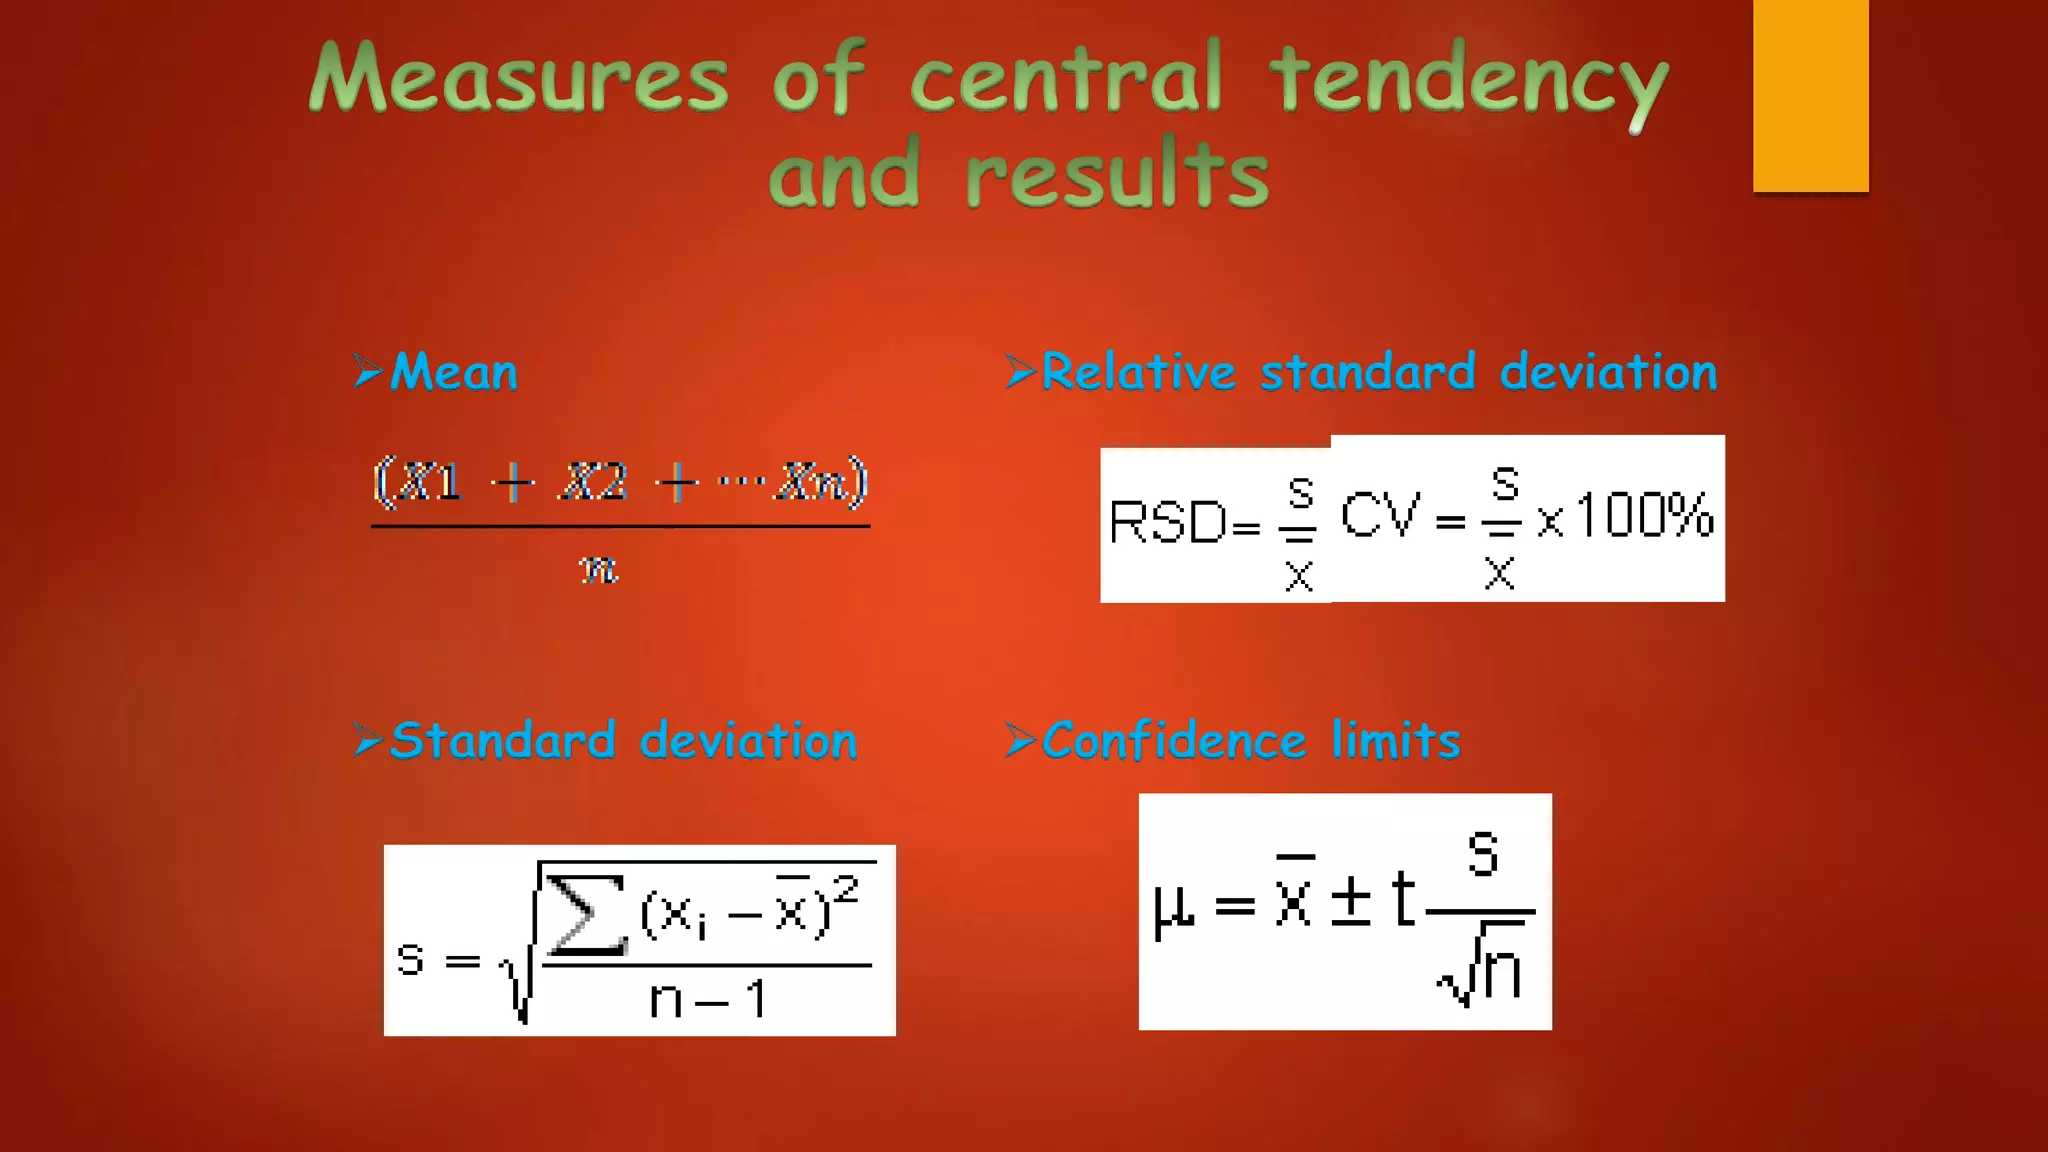
G.S.Nithej,
b.pharm,
s.p.s.p
Definition
Introduction
Statistics Importance
Analytical Chemistry
Error is the
collective noun for
any departure of
the result from the
true value.
Error
Bias
Accuracy
Precision
The “Trueness” or
the ‘’closeness’’ of
the analytical result
to the true value.
The consistent
deviation of analytical
results from the true
value caused by
systemic errors in a
procedure
The closeness with
which results of
replicate analysis of
a sample agree.
Mean
Standard deviation
Relative standard deviation
Confidence limits
I. Propagation of Random errors
II.Propagation of Systematic errors
1.Summation calculations
2.Multiplication calculations
• The calculation of Kjeldahl-Nitrogen may be as
follows
Types of Control charts
 X-bar Charts
 R- Charts
 P-Charts
 C-Charts
X-Charts
R-Charts
P-Charts and c-charts
 These are the control charts for attributes, which are not continuous variables but are things
that can be counted.
 A p-chart and c-chart considers the portion of a sample that is defective, where each item in
the sample is either defective or not.
 If we want to reduce the risk of falsely categorizing a good result as not being significant, we
can use a higher confidence level.
 To reduce the risk of falsely categorizing a non-significant result as significant, we can use a
lower confidence level.
Two-sided vs One-sided test
F-test for Precision
t-Test for bias
Linear correlation and regression
Analysis of variance (ANOVA)
Two-sided vs one sided test
 These tests for comparison, for instance between methods A and B, are based on the assumption
that there is no significant difference.
1. Are A and B different ?
(Two-sided test)
2. Is A higher or lower than B ?
(One-sided test).
t-Test
1.Students t – test
.
Student's t-test for comparison of two independent
standard deviations.
2.Paired t – test
The paired t-test for comparison of strongly
F-Test
The F-test (or Fisher's test) is a comparison of the spread of two sets of data to test if the sets belong
to the same population, in other words if the precisions are similar or dissimilar.
These are calculated by:
df1 = n1-1
df2 = n2-1
Linear correlation and regression
1. When the concentration range is so wide that the errors, both random and systematic, are not
independent which is the assumption for the t-tests.
2. When pairing is inappropriate for other reasons, notably a long time span between the two
analyses.
ANOVA
When results of laboratories or methods are compared where more than one
factor can be of influence and must be distinguished from random effects, then
ANOVA is a powerful statistical tool to be used.
 Statistics
 Need of statistics
 Measures of central tendancy and results
 Statistical process control analysis : control charts
 Statistical tests
1. www.fao.org/docrep/w7295E/w 7295e08.htm
2. www.inorganicventures.com
3. Statistical process control charts by Dr.Scott Sampson @2012
4. Quantitative Toch for service operations management by Dr.Scott Sampson@2012
5. Skoog/west Fundamentals of analytical chemistry by F.James holler and Stanley
R.Crouch
6. Applied statistics in chemistry.doc by Roy Jensen 2002
7. Abraham, B., & Ledolter, J. (1983). Statistical methods for forecasting. New York:
Wiley.
8. Adorno, T. W., Frenkel-Brunswik, E., Levinson, D. J., & Sanford, R. N. (1950). The
authoritarian personality.New York: Harper.
9. Agrawal, R., Imielinski, T., & Swami, A. (1993). Mining association rules between sets of
items in large databases. Proceedings of the 1993 ACM SIGMOD Conference, Washington,
DC.
10. Agrawal, R. & Srikant, R. (1994). Fast algorithms for mining association
rules. Proceedings of the 20th VLDB Conference. Santiago, Chile.
11. Agresti, Alan (1996). An Introduction to Categorical Data Analysis. New York: Wiley.
12. Akaike, H. (1973). Information theory and an extension of the maximum likelihood
principle. In B. N. Petrov and F. Csaki (Eds.), Second International Symposium on
Information Theory. Budapest: Akademiai Kiado.
13. Akaike, H. (1983). Information measures and model selection. Bulletin of the
International Statistical Institute: Proceedings of the 44th Session, Volume 1. Pages 277-290.
14. Aldrich, J. H., & Nelson, F. D. (1984). Linear probability, logit, and probit models. Beverly
Hills, CA: Sage Publications.
15. Almon, S. (1965). The distributed lag between capital appropriations and
expenditures. Econometrica, 33, 178-196.
16. American Supplier Institute (1984-1988). Proceedings of Supplier Symposia on Taguchi
Methods. (April, 1984; November, 1984; October, 1985; October, 1986; October, 1987; October,
1988), Dearborn, MI: American Supplier Institute.
17. Anderson, O. D. (1976). Time series analysis and forecasting. London: Butterworths.
18. Anderson, S. B., & Maier, M. H. (1963). 34,000 pupils and how they grew. Journal of
Teacher Education, 14, 212-216.
19. Anderson, T. W. (1958). An introduction to multivariate statistical analysis. New York: Wiley.
20. Anderson, T. W. (1984). An introduction to multivariate statistical analysis (2nd ed.).
21. Anderson, T. W., & Rubin, H. (1956). Statistical inference in factor
analysis. Proceedings of the Third Berkeley Symposium on Mathematical Statistics and
Probability. Berkeley: The University of California Press.
22. Andrews, D. F. (1972). Plots of high-dimensional data. Biometrics, 28, 125-136.
23. ASQC/AIAG (1990). Measurement systems analysis reference manual. Troy, MI: AIAG.
24. ASQC/AIAG (1991). Fundamental statistical process control reference manual. Troy,
MI: AIAG.
25. AT&T (1956). Statistical quality control handbook, Select code 700-444. Indianapolis,
AT&T Technologies.
THANK
YOU

STATISTICAL TOOLS USED IN ANALYTICAL CHEMISTRY

  • 1.
  • 2.
  • 3.
    Error is the collectivenoun for any departure of the result from the true value. Error Bias Accuracy Precision The “Trueness” or the ‘’closeness’’ of the analytical result to the true value. The consistent deviation of analytical results from the true value caused by systemic errors in a procedure The closeness with which results of replicate analysis of a sample agree.
  • 4.
  • 5.
    I. Propagation ofRandom errors II.Propagation of Systematic errors 1.Summation calculations 2.Multiplication calculations • The calculation of Kjeldahl-Nitrogen may be as follows
  • 6.
    Types of Controlcharts  X-bar Charts  R- Charts  P-Charts  C-Charts
  • 7.
  • 8.
  • 9.
    P-Charts and c-charts These are the control charts for attributes, which are not continuous variables but are things that can be counted.  A p-chart and c-chart considers the portion of a sample that is defective, where each item in the sample is either defective or not.  If we want to reduce the risk of falsely categorizing a good result as not being significant, we can use a higher confidence level.  To reduce the risk of falsely categorizing a non-significant result as significant, we can use a lower confidence level.
  • 10.
    Two-sided vs One-sidedtest F-test for Precision t-Test for bias Linear correlation and regression Analysis of variance (ANOVA)
  • 11.
    Two-sided vs onesided test  These tests for comparison, for instance between methods A and B, are based on the assumption that there is no significant difference. 1. Are A and B different ? (Two-sided test) 2. Is A higher or lower than B ? (One-sided test).
  • 12.
    t-Test 1.Students t –test . Student's t-test for comparison of two independent standard deviations. 2.Paired t – test The paired t-test for comparison of strongly
  • 13.
    F-Test The F-test (orFisher's test) is a comparison of the spread of two sets of data to test if the sets belong to the same population, in other words if the precisions are similar or dissimilar. These are calculated by: df1 = n1-1 df2 = n2-1
  • 14.
    Linear correlation andregression 1. When the concentration range is so wide that the errors, both random and systematic, are not independent which is the assumption for the t-tests. 2. When pairing is inappropriate for other reasons, notably a long time span between the two analyses.
  • 15.
    ANOVA When results oflaboratories or methods are compared where more than one factor can be of influence and must be distinguished from random effects, then ANOVA is a powerful statistical tool to be used.
  • 16.
     Statistics  Needof statistics  Measures of central tendancy and results  Statistical process control analysis : control charts  Statistical tests
  • 17.
    1. www.fao.org/docrep/w7295E/w 7295e08.htm 2.www.inorganicventures.com 3. Statistical process control charts by Dr.Scott Sampson @2012 4. Quantitative Toch for service operations management by Dr.Scott Sampson@2012 5. Skoog/west Fundamentals of analytical chemistry by F.James holler and Stanley R.Crouch 6. Applied statistics in chemistry.doc by Roy Jensen 2002 7. Abraham, B., & Ledolter, J. (1983). Statistical methods for forecasting. New York: Wiley. 8. Adorno, T. W., Frenkel-Brunswik, E., Levinson, D. J., & Sanford, R. N. (1950). The authoritarian personality.New York: Harper.
  • 18.
    9. Agrawal, R.,Imielinski, T., & Swami, A. (1993). Mining association rules between sets of items in large databases. Proceedings of the 1993 ACM SIGMOD Conference, Washington, DC. 10. Agrawal, R. & Srikant, R. (1994). Fast algorithms for mining association rules. Proceedings of the 20th VLDB Conference. Santiago, Chile. 11. Agresti, Alan (1996). An Introduction to Categorical Data Analysis. New York: Wiley. 12. Akaike, H. (1973). Information theory and an extension of the maximum likelihood principle. In B. N. Petrov and F. Csaki (Eds.), Second International Symposium on Information Theory. Budapest: Akademiai Kiado. 13. Akaike, H. (1983). Information measures and model selection. Bulletin of the International Statistical Institute: Proceedings of the 44th Session, Volume 1. Pages 277-290.
  • 19.
    14. Aldrich, J.H., & Nelson, F. D. (1984). Linear probability, logit, and probit models. Beverly Hills, CA: Sage Publications. 15. Almon, S. (1965). The distributed lag between capital appropriations and expenditures. Econometrica, 33, 178-196. 16. American Supplier Institute (1984-1988). Proceedings of Supplier Symposia on Taguchi Methods. (April, 1984; November, 1984; October, 1985; October, 1986; October, 1987; October, 1988), Dearborn, MI: American Supplier Institute. 17. Anderson, O. D. (1976). Time series analysis and forecasting. London: Butterworths. 18. Anderson, S. B., & Maier, M. H. (1963). 34,000 pupils and how they grew. Journal of Teacher Education, 14, 212-216. 19. Anderson, T. W. (1958). An introduction to multivariate statistical analysis. New York: Wiley. 20. Anderson, T. W. (1984). An introduction to multivariate statistical analysis (2nd ed.).
  • 20.
    21. Anderson, T.W., & Rubin, H. (1956). Statistical inference in factor analysis. Proceedings of the Third Berkeley Symposium on Mathematical Statistics and Probability. Berkeley: The University of California Press. 22. Andrews, D. F. (1972). Plots of high-dimensional data. Biometrics, 28, 125-136. 23. ASQC/AIAG (1990). Measurement systems analysis reference manual. Troy, MI: AIAG. 24. ASQC/AIAG (1991). Fundamental statistical process control reference manual. Troy, MI: AIAG. 25. AT&T (1956). Statistical quality control handbook, Select code 700-444. Indianapolis, AT&T Technologies.
  • 21.