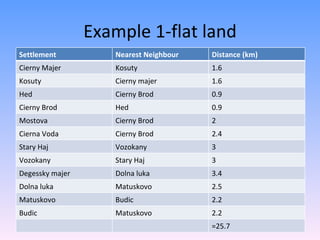
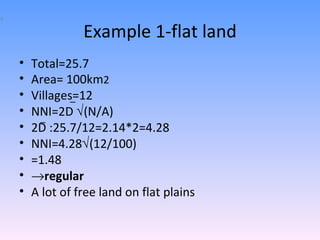
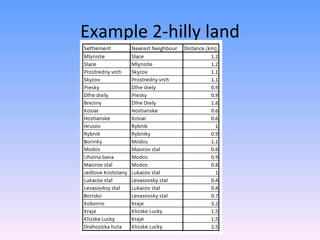
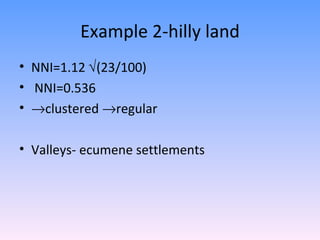
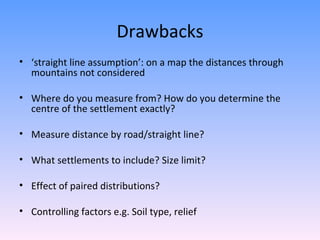
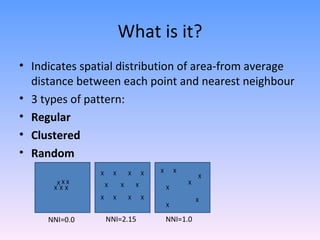
Nearest Neighbour Index Eliska NNI/Rn
What is it? Indicates spatial distribution of area-from average distance between each point and nearest neighbour 3 types of pattern: Regular Clustered Random X X X X X X X X X X X X X X X X X X X NNI=0.0 NNI=2.15 NNI=1.0 X X X X X
Formula NNI=2D   (N/A) D : average distance between each point & its nearest neighbour ( ∑d/N ) [ d =each individual distance] N : number of studied points A : size of the studied area ! SAME UNITS! _ _
Example 1-flat land Settlement Nearest Neighbour Distance (km) Cierny Majer Kosuty 1.6 Kosuty Cierny majer 1.6 Hed Cierny Brod 0.9 Cierny Brod Hed 0.9 Mostova Cierny Brod 2 Cierna Voda Cierny Brod 2.4 Stary Haj Vozokany 3 Vozokany Stary Haj 3 Degessky majer Dolna luka 3.4 Dolna luka Matuskovo 2.5 Matuskovo Budic 2.2 Budic Matuskovo 2.2 =25.7
Example 1-flat land Total=25.7 Area= 100km 2 Villages=12 NNI=2D   (N/A) 2D :25.7/12=2.14*2=4.28 NNI=4.28  (12/100) =1.48  regular A lot of free land on flat plains _ _
Example 2-hilly land
Example 2-hilly land NNI=1.12   (23/100) NNI=0.536  clustered   regular Valleys- ecumene settlements
Drawbacks ‘ straight line assumption’: on a map the distances through mountains not considered Where do you measure from? How do you determine the centre of the settlement exactly? Measure distance by road/straight line? What settlements to include? Size limit? Effect of paired distributions? Controlling factors e.g. Soil type, relief
Practical use? Comparison of distributions-quantifiable measure of a distribution pattern

Nearest Neighbour Index

  • 1.
  • 2.
    What is it?Indicates spatial distribution of area-from average distance between each point and nearest neighbour 3 types of pattern: Regular Clustered Random X X X X X X X X X X X X X X X X X X X NNI=0.0 NNI=2.15 NNI=1.0 X X X X X
  • 3.
    Formula NNI=2D  (N/A) D : average distance between each point & its nearest neighbour ( ∑d/N ) [ d =each individual distance] N : number of studied points A : size of the studied area ! SAME UNITS! _ _
  • 4.
    Example 1-flat landSettlement Nearest Neighbour Distance (km) Cierny Majer Kosuty 1.6 Kosuty Cierny majer 1.6 Hed Cierny Brod 0.9 Cierny Brod Hed 0.9 Mostova Cierny Brod 2 Cierna Voda Cierny Brod 2.4 Stary Haj Vozokany 3 Vozokany Stary Haj 3 Degessky majer Dolna luka 3.4 Dolna luka Matuskovo 2.5 Matuskovo Budic 2.2 Budic Matuskovo 2.2 =25.7
  • 5.
    Example 1-flat landTotal=25.7 Area= 100km 2 Villages=12 NNI=2D  (N/A) 2D :25.7/12=2.14*2=4.28 NNI=4.28  (12/100) =1.48  regular A lot of free land on flat plains _ _
  • 6.
  • 7.
    Example 2-hilly landNNI=1.12  (23/100) NNI=0.536  clustered  regular Valleys- ecumene settlements
  • 8.
    Drawbacks ‘ straightline assumption’: on a map the distances through mountains not considered Where do you measure from? How do you determine the centre of the settlement exactly? Measure distance by road/straight line? What settlements to include? Size limit? Effect of paired distributions? Controlling factors e.g. Soil type, relief
  • 9.
    Practical use? Comparisonof distributions-quantifiable measure of a distribution pattern