Downloaded 192 times
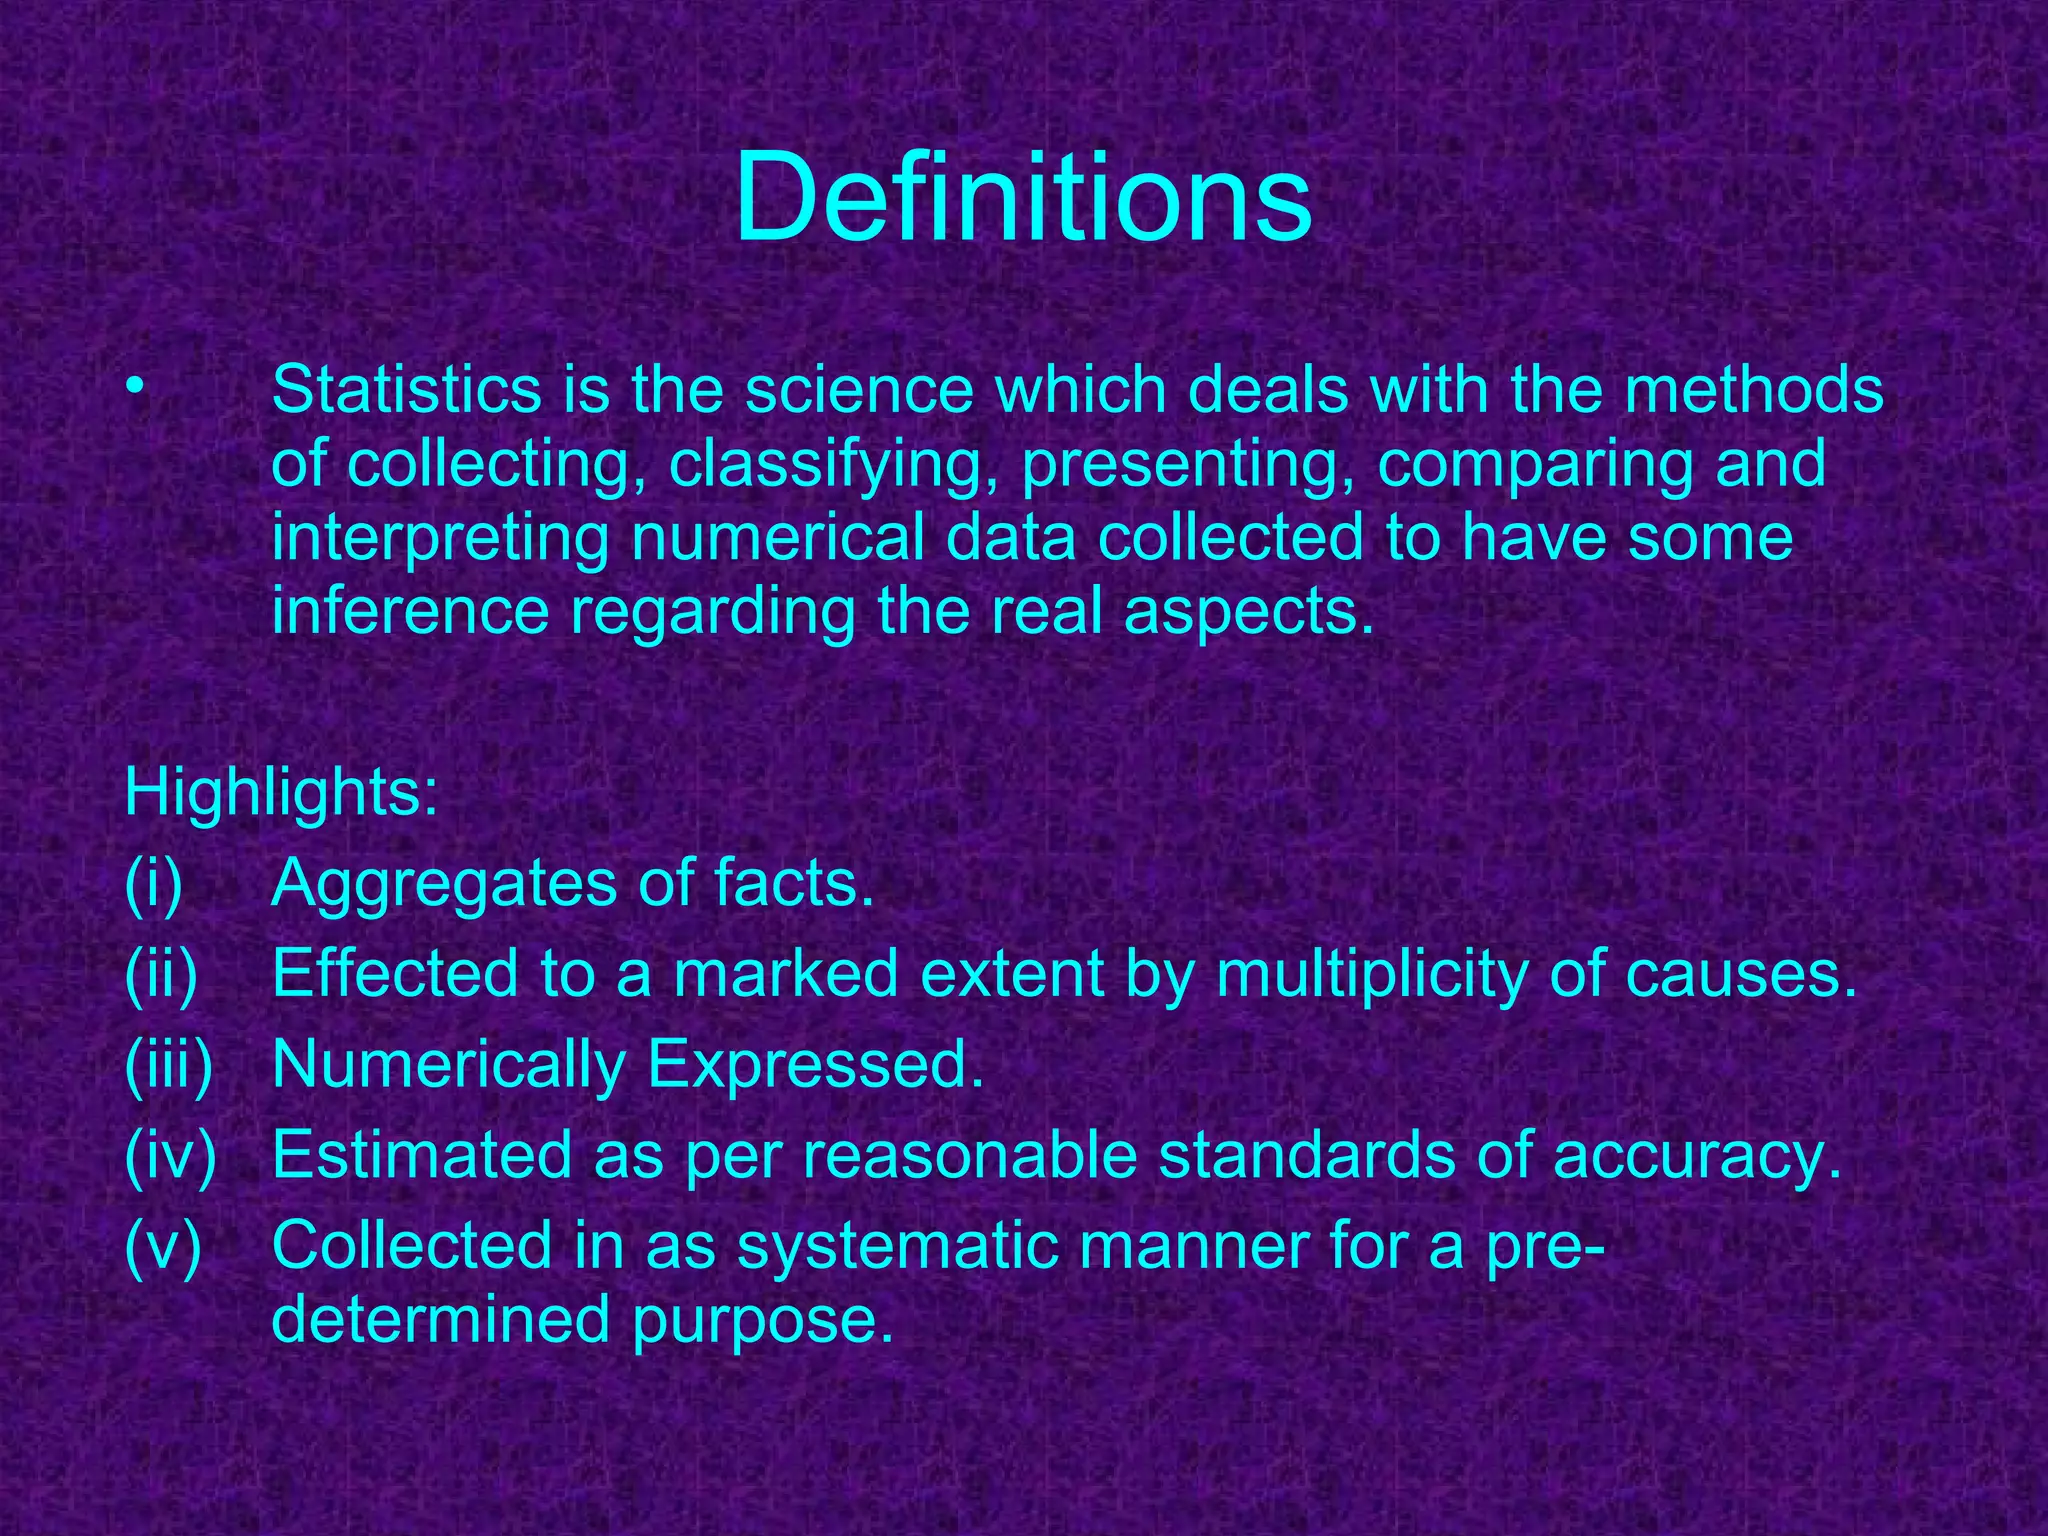
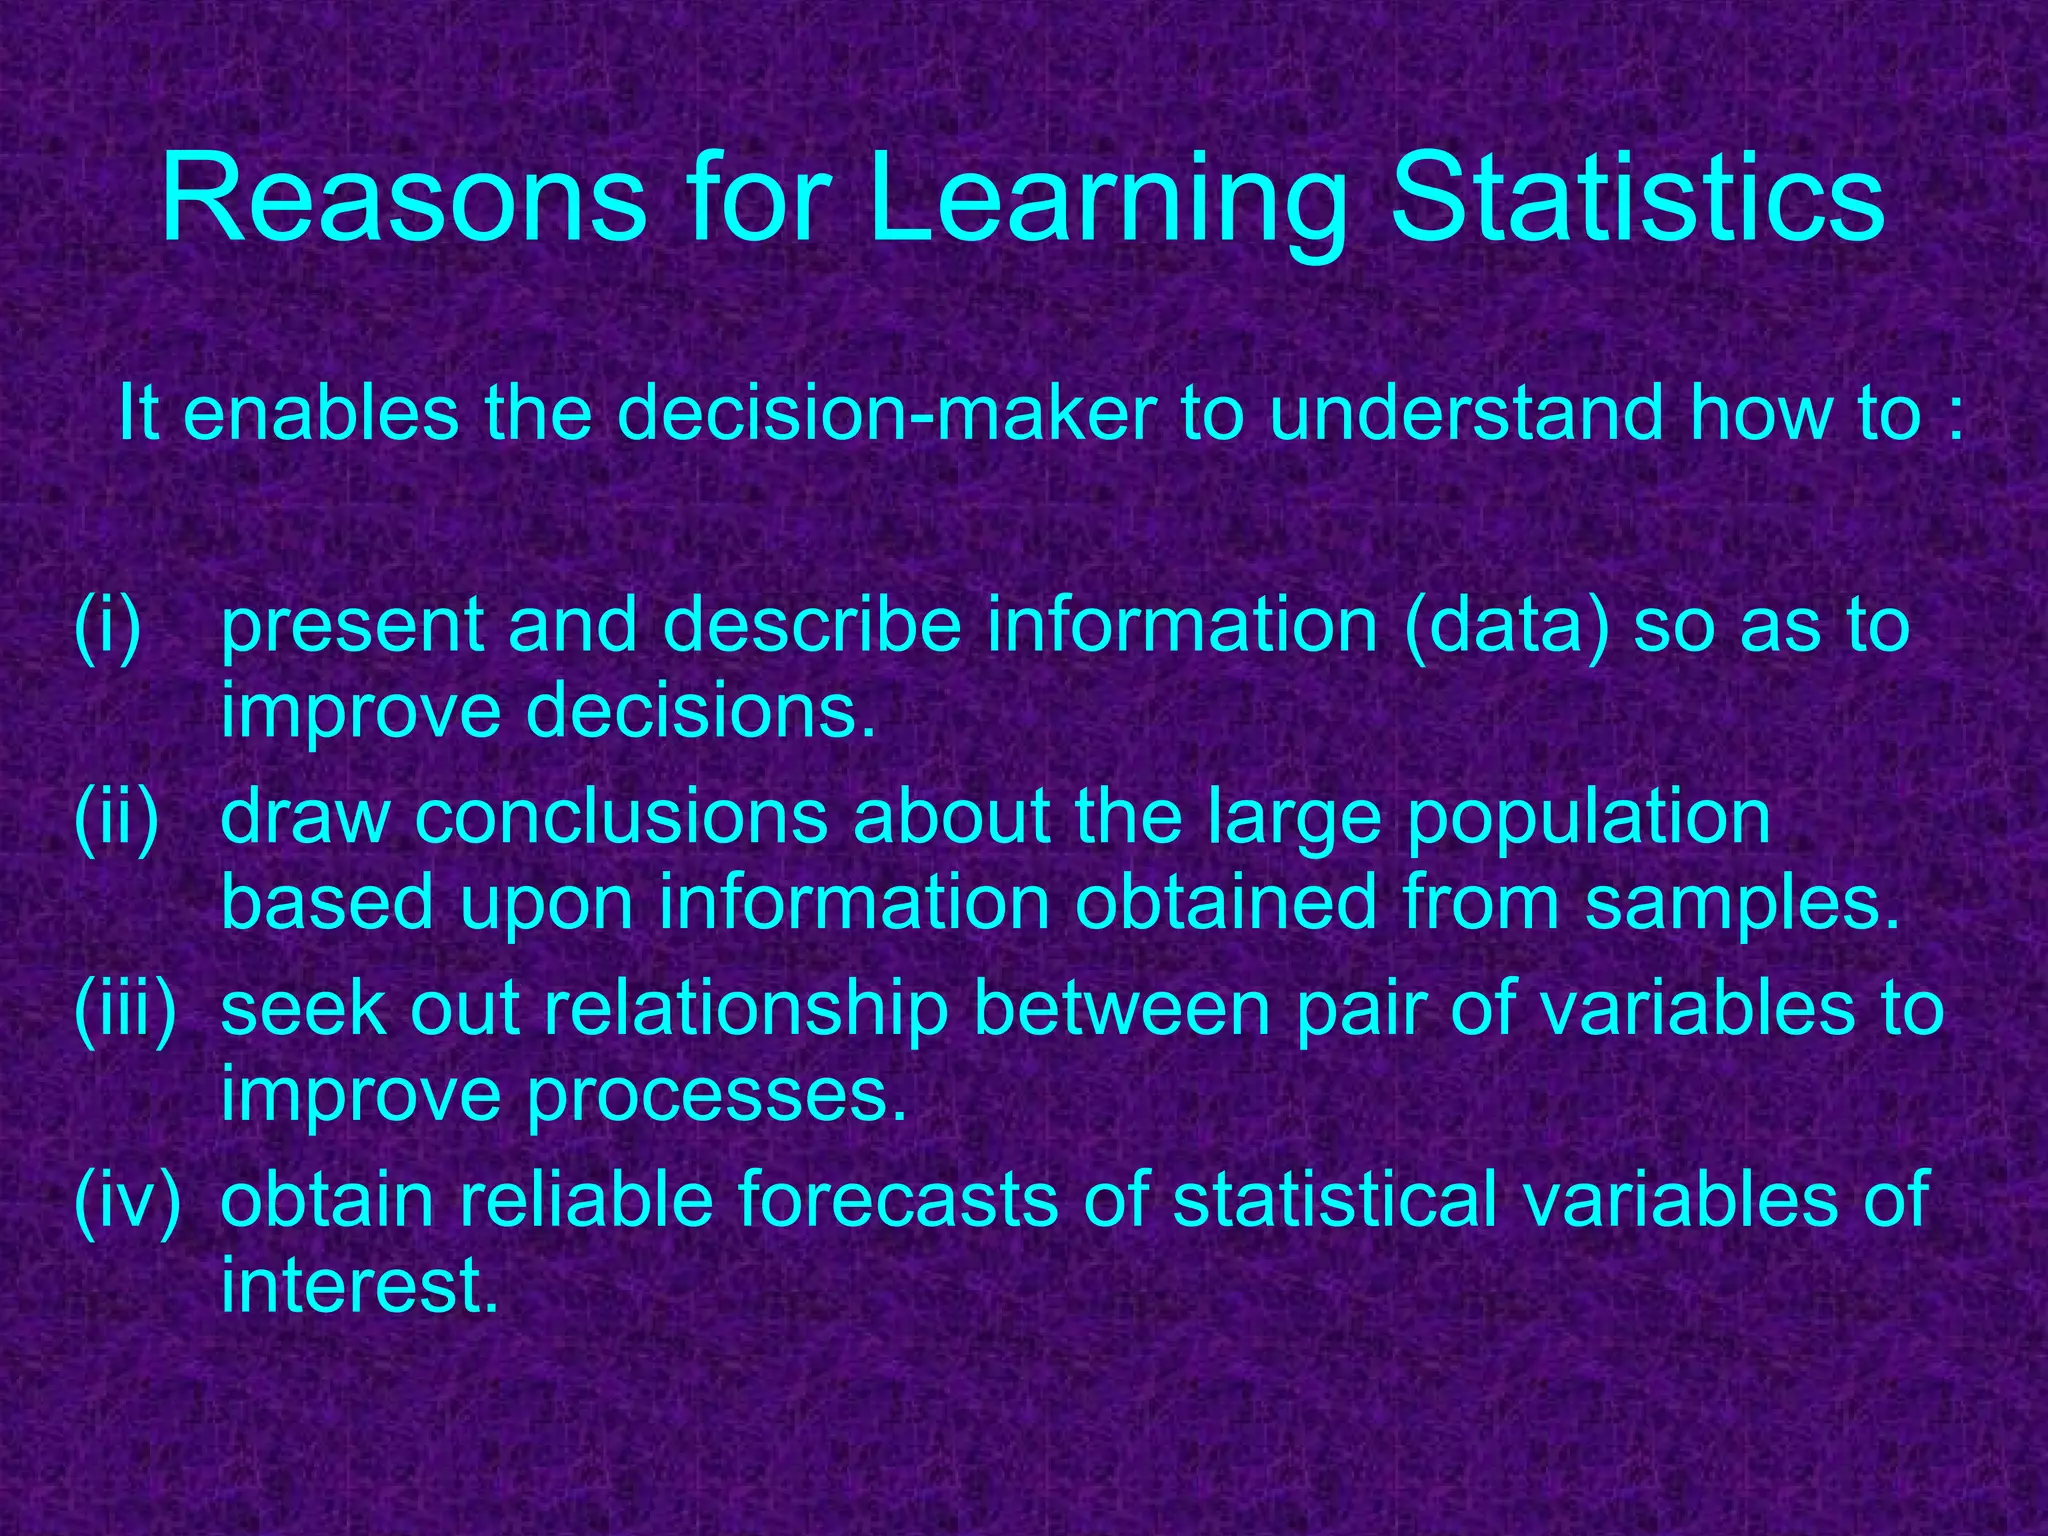
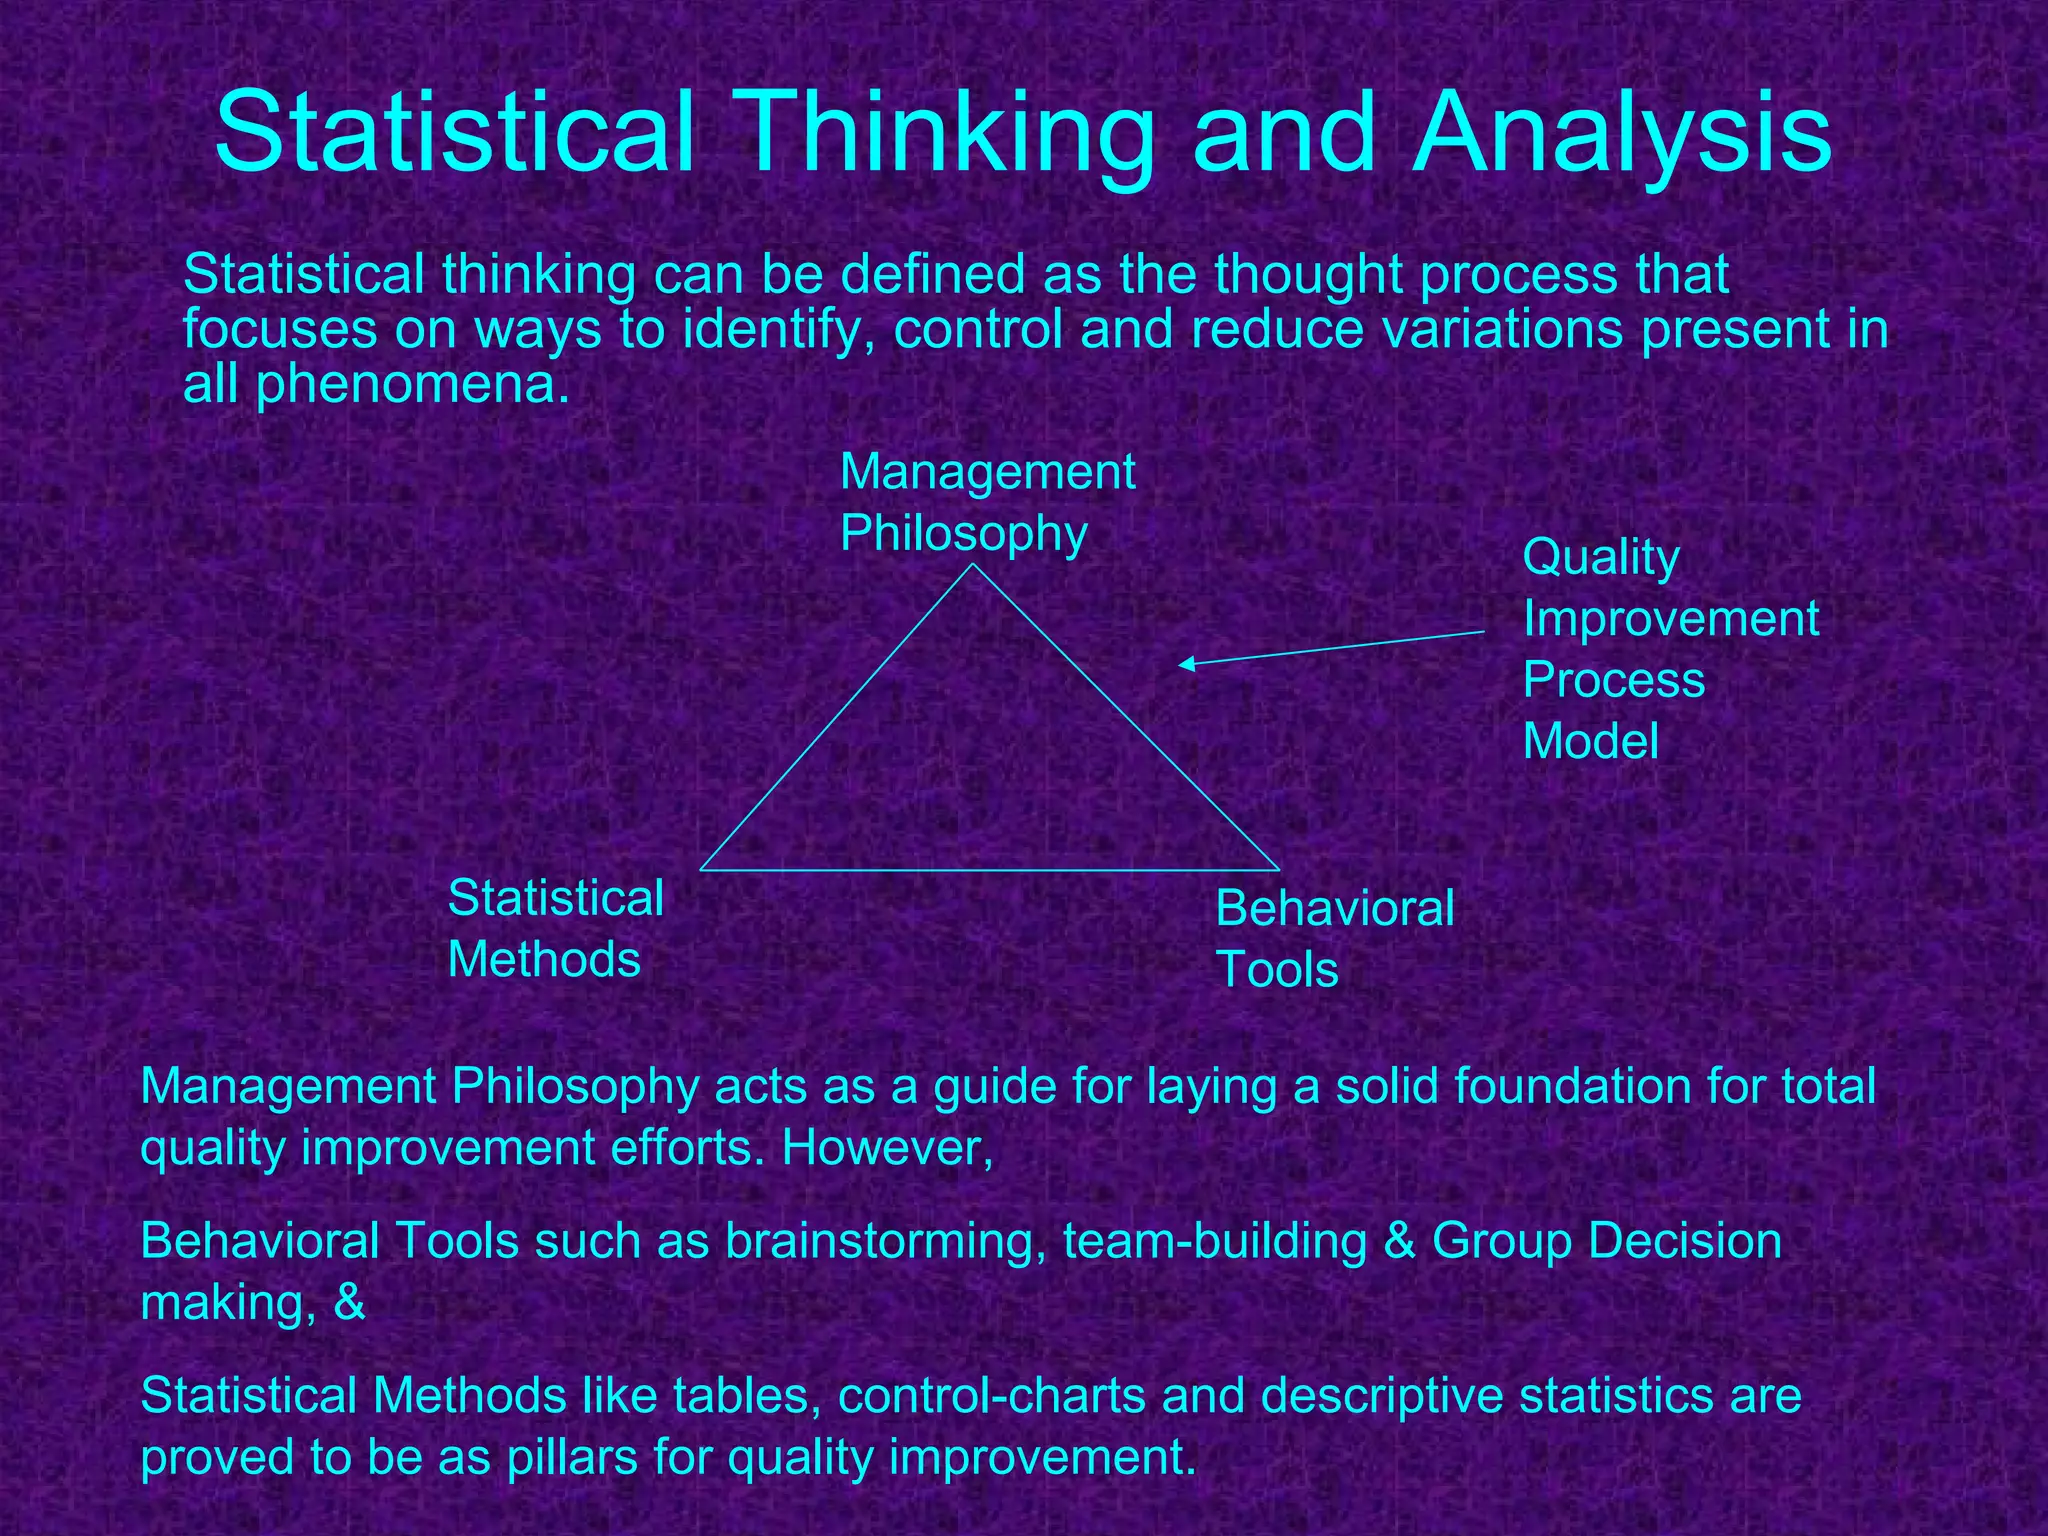
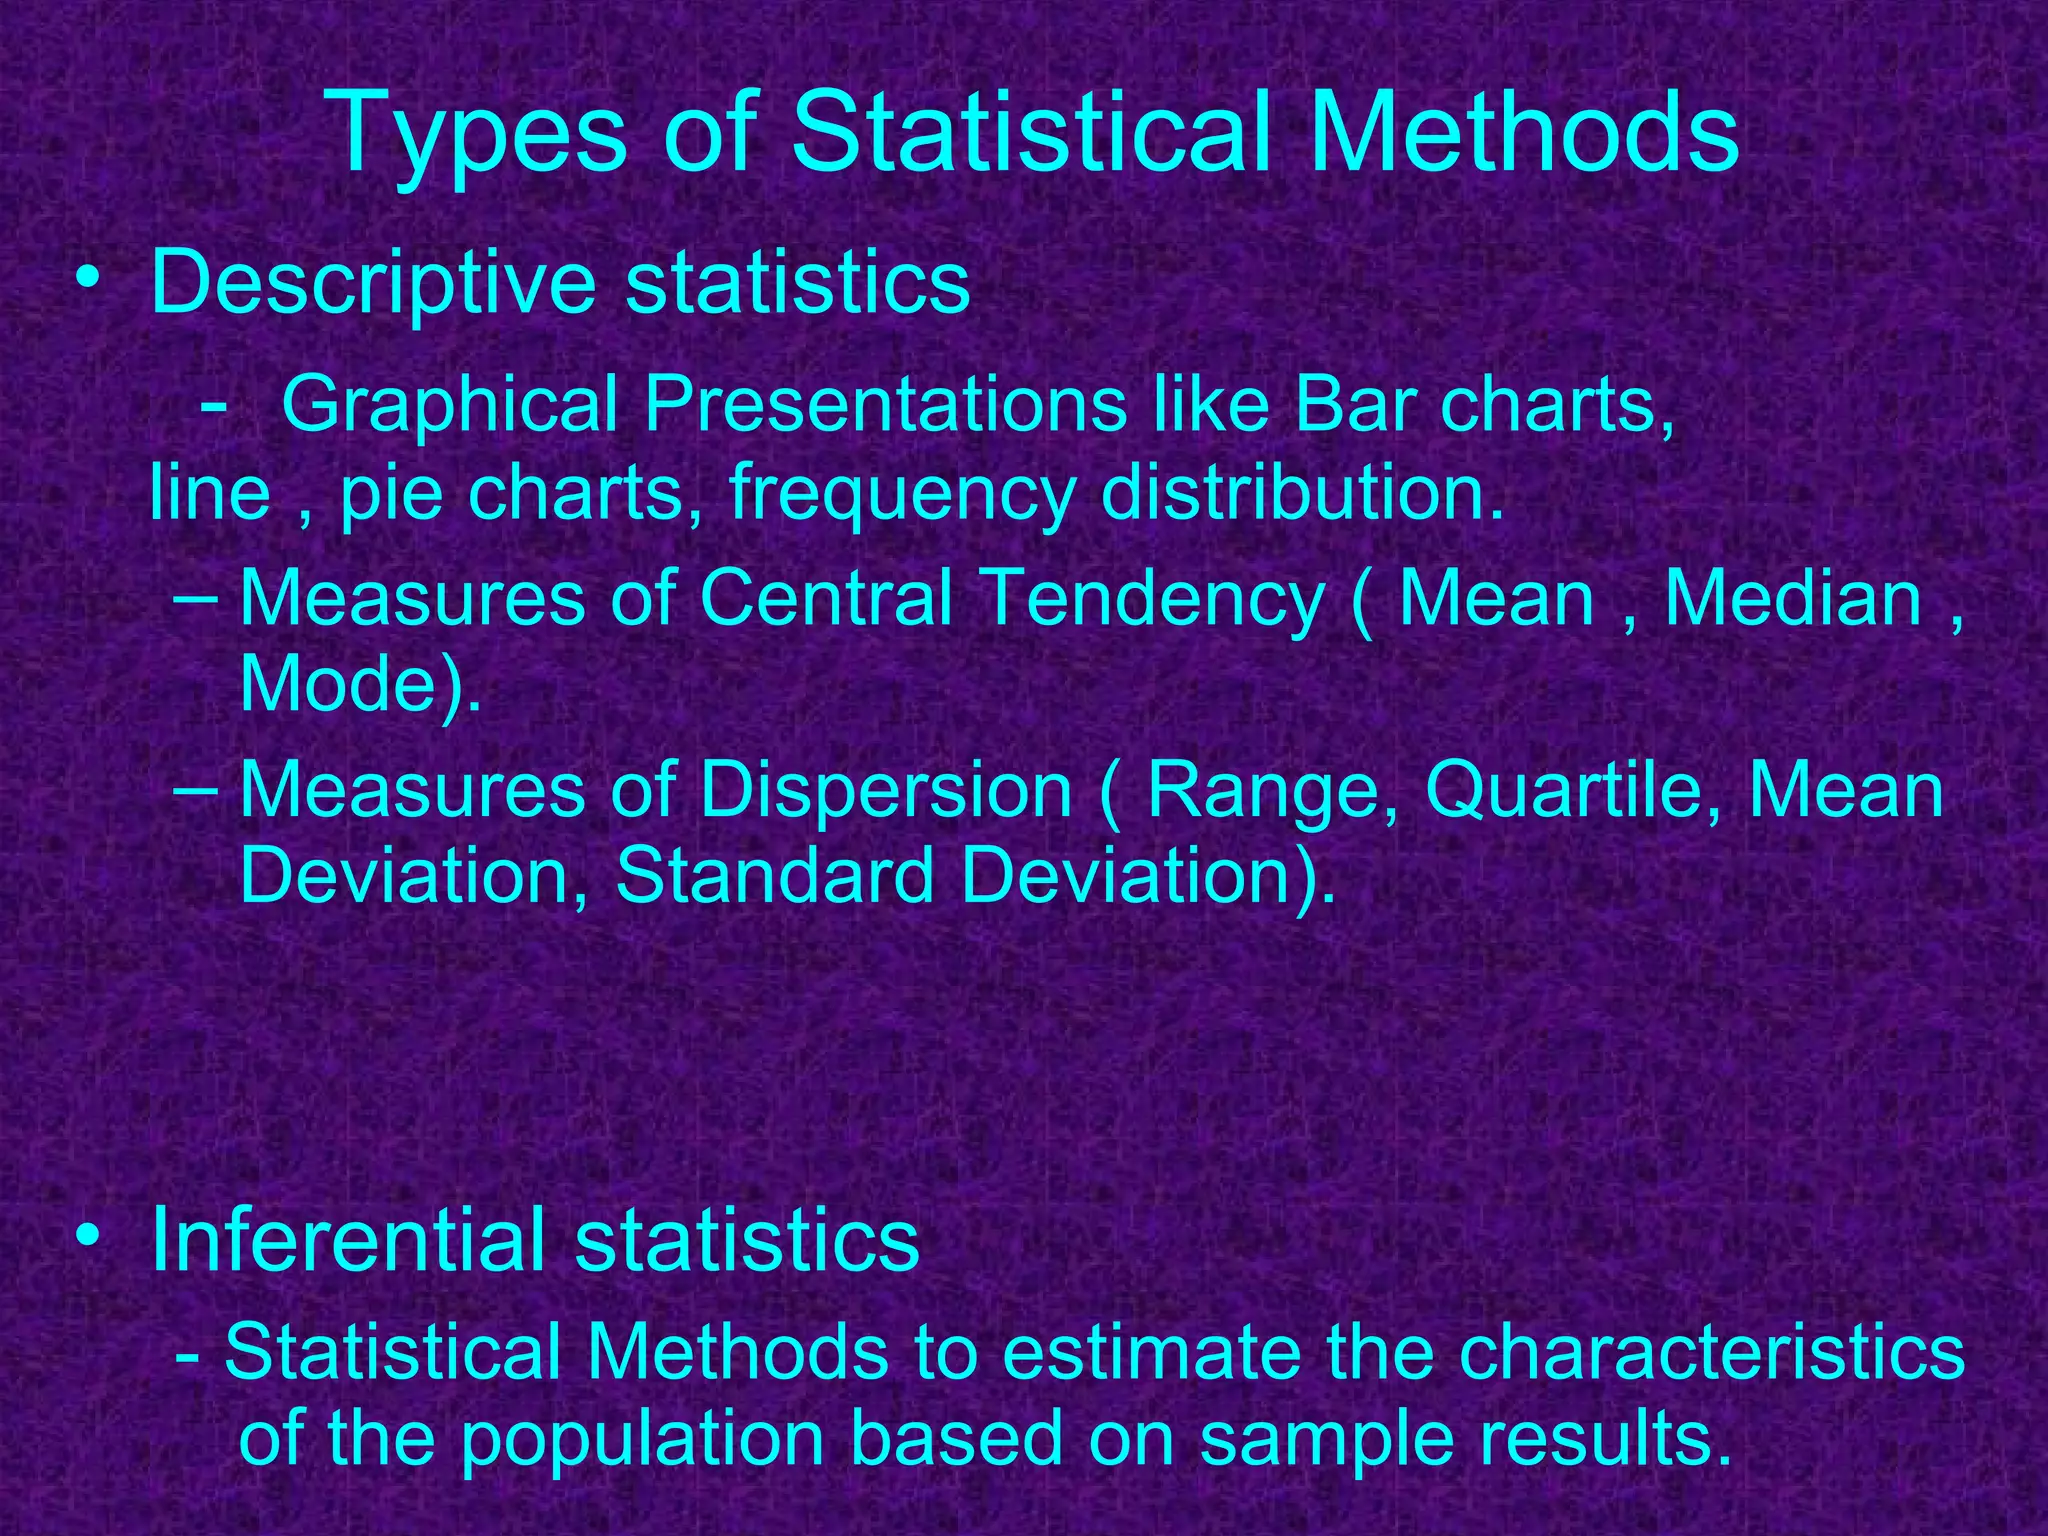
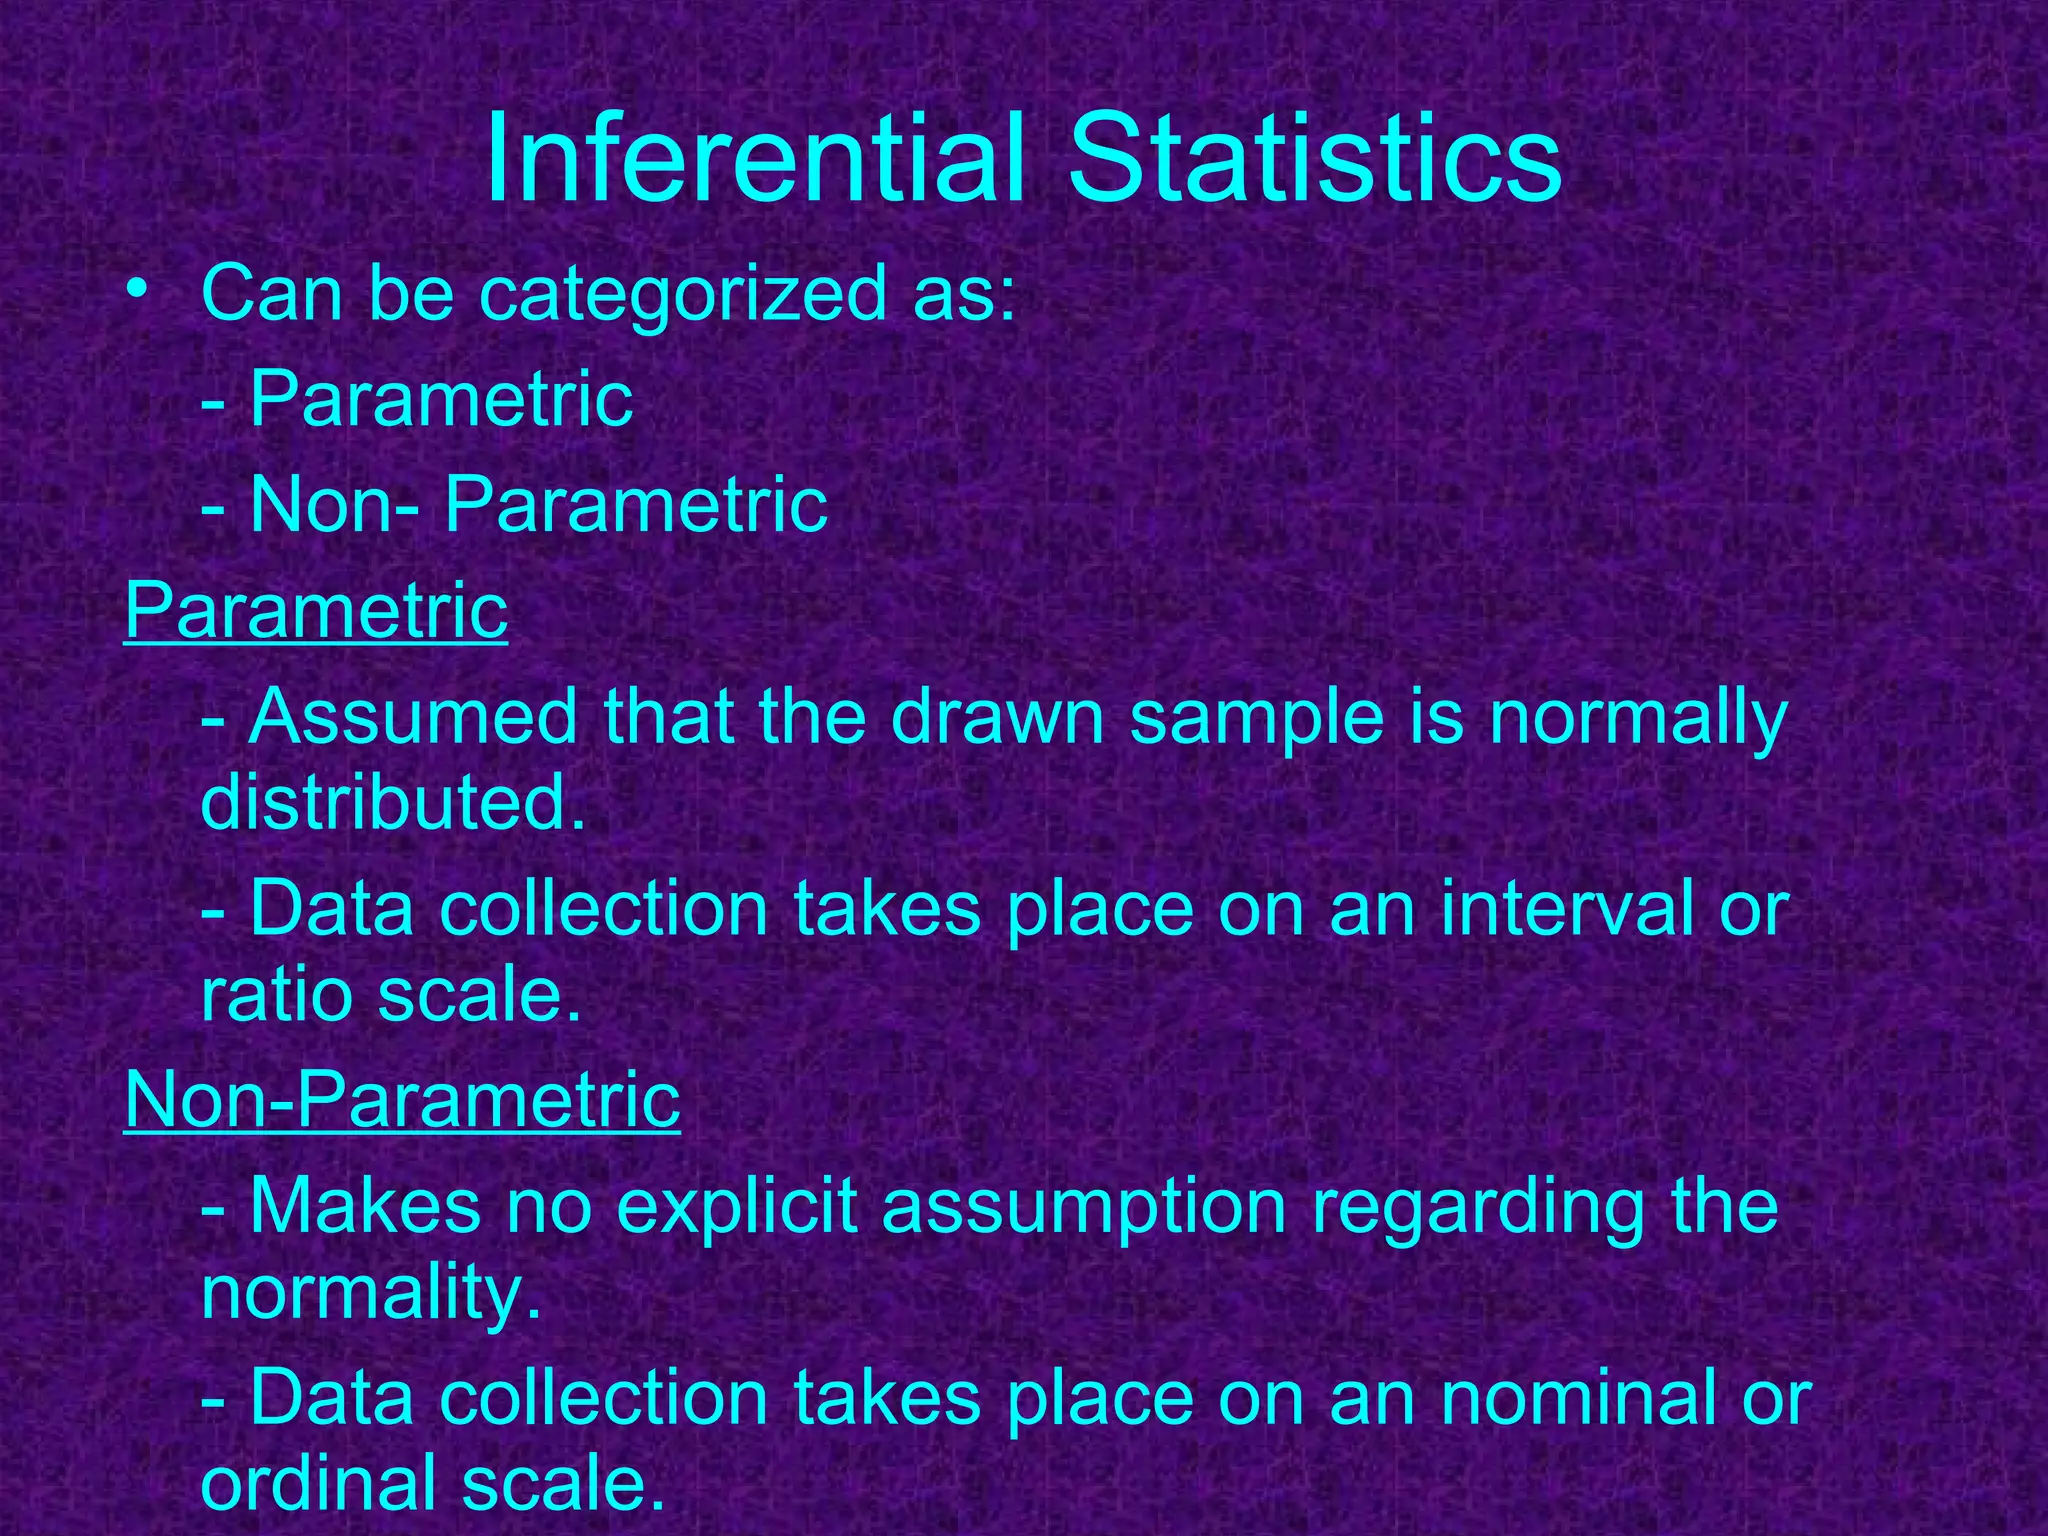

The document discusses inferential statistics and its applications. It defines statistics as dealing with collecting, classifying, presenting, comparing, and interpreting numerical data to make inferences about a population. Inferential statistics help decision makers present information, draw conclusions from samples, seek relationships between variables, and make reliable forecasts. The document also distinguishes between descriptive statistics, parametric inferential statistics that assume normal distributions, and non-parametric inferential statistics that make no distribution assumptions.