Downloaded 4,877 times
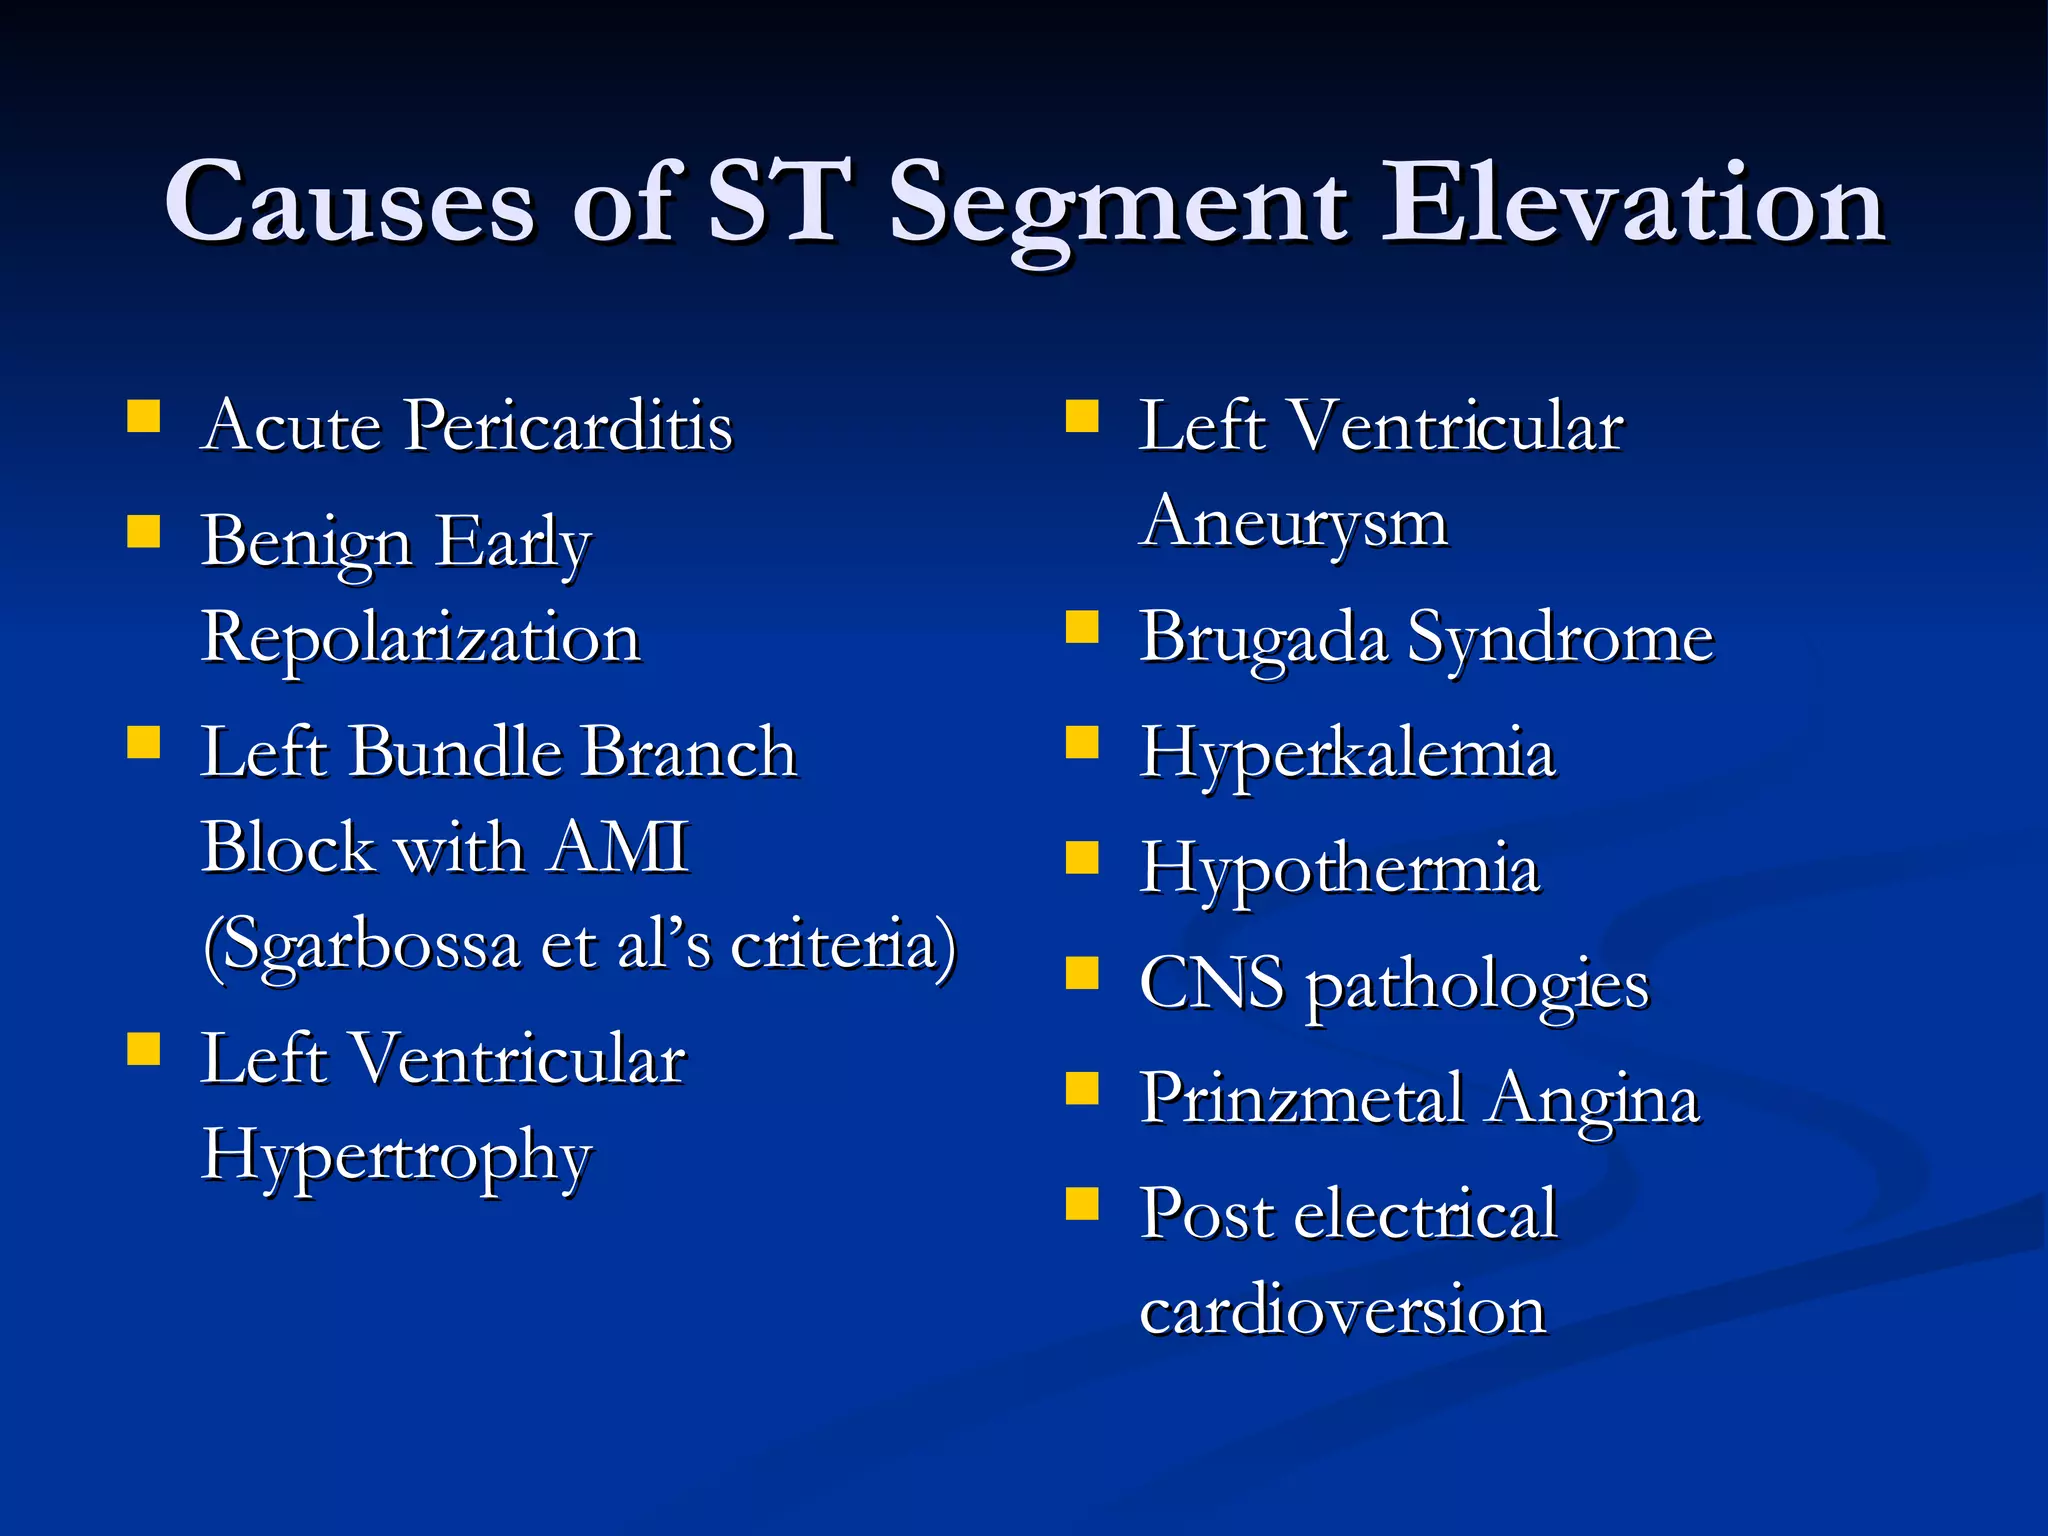

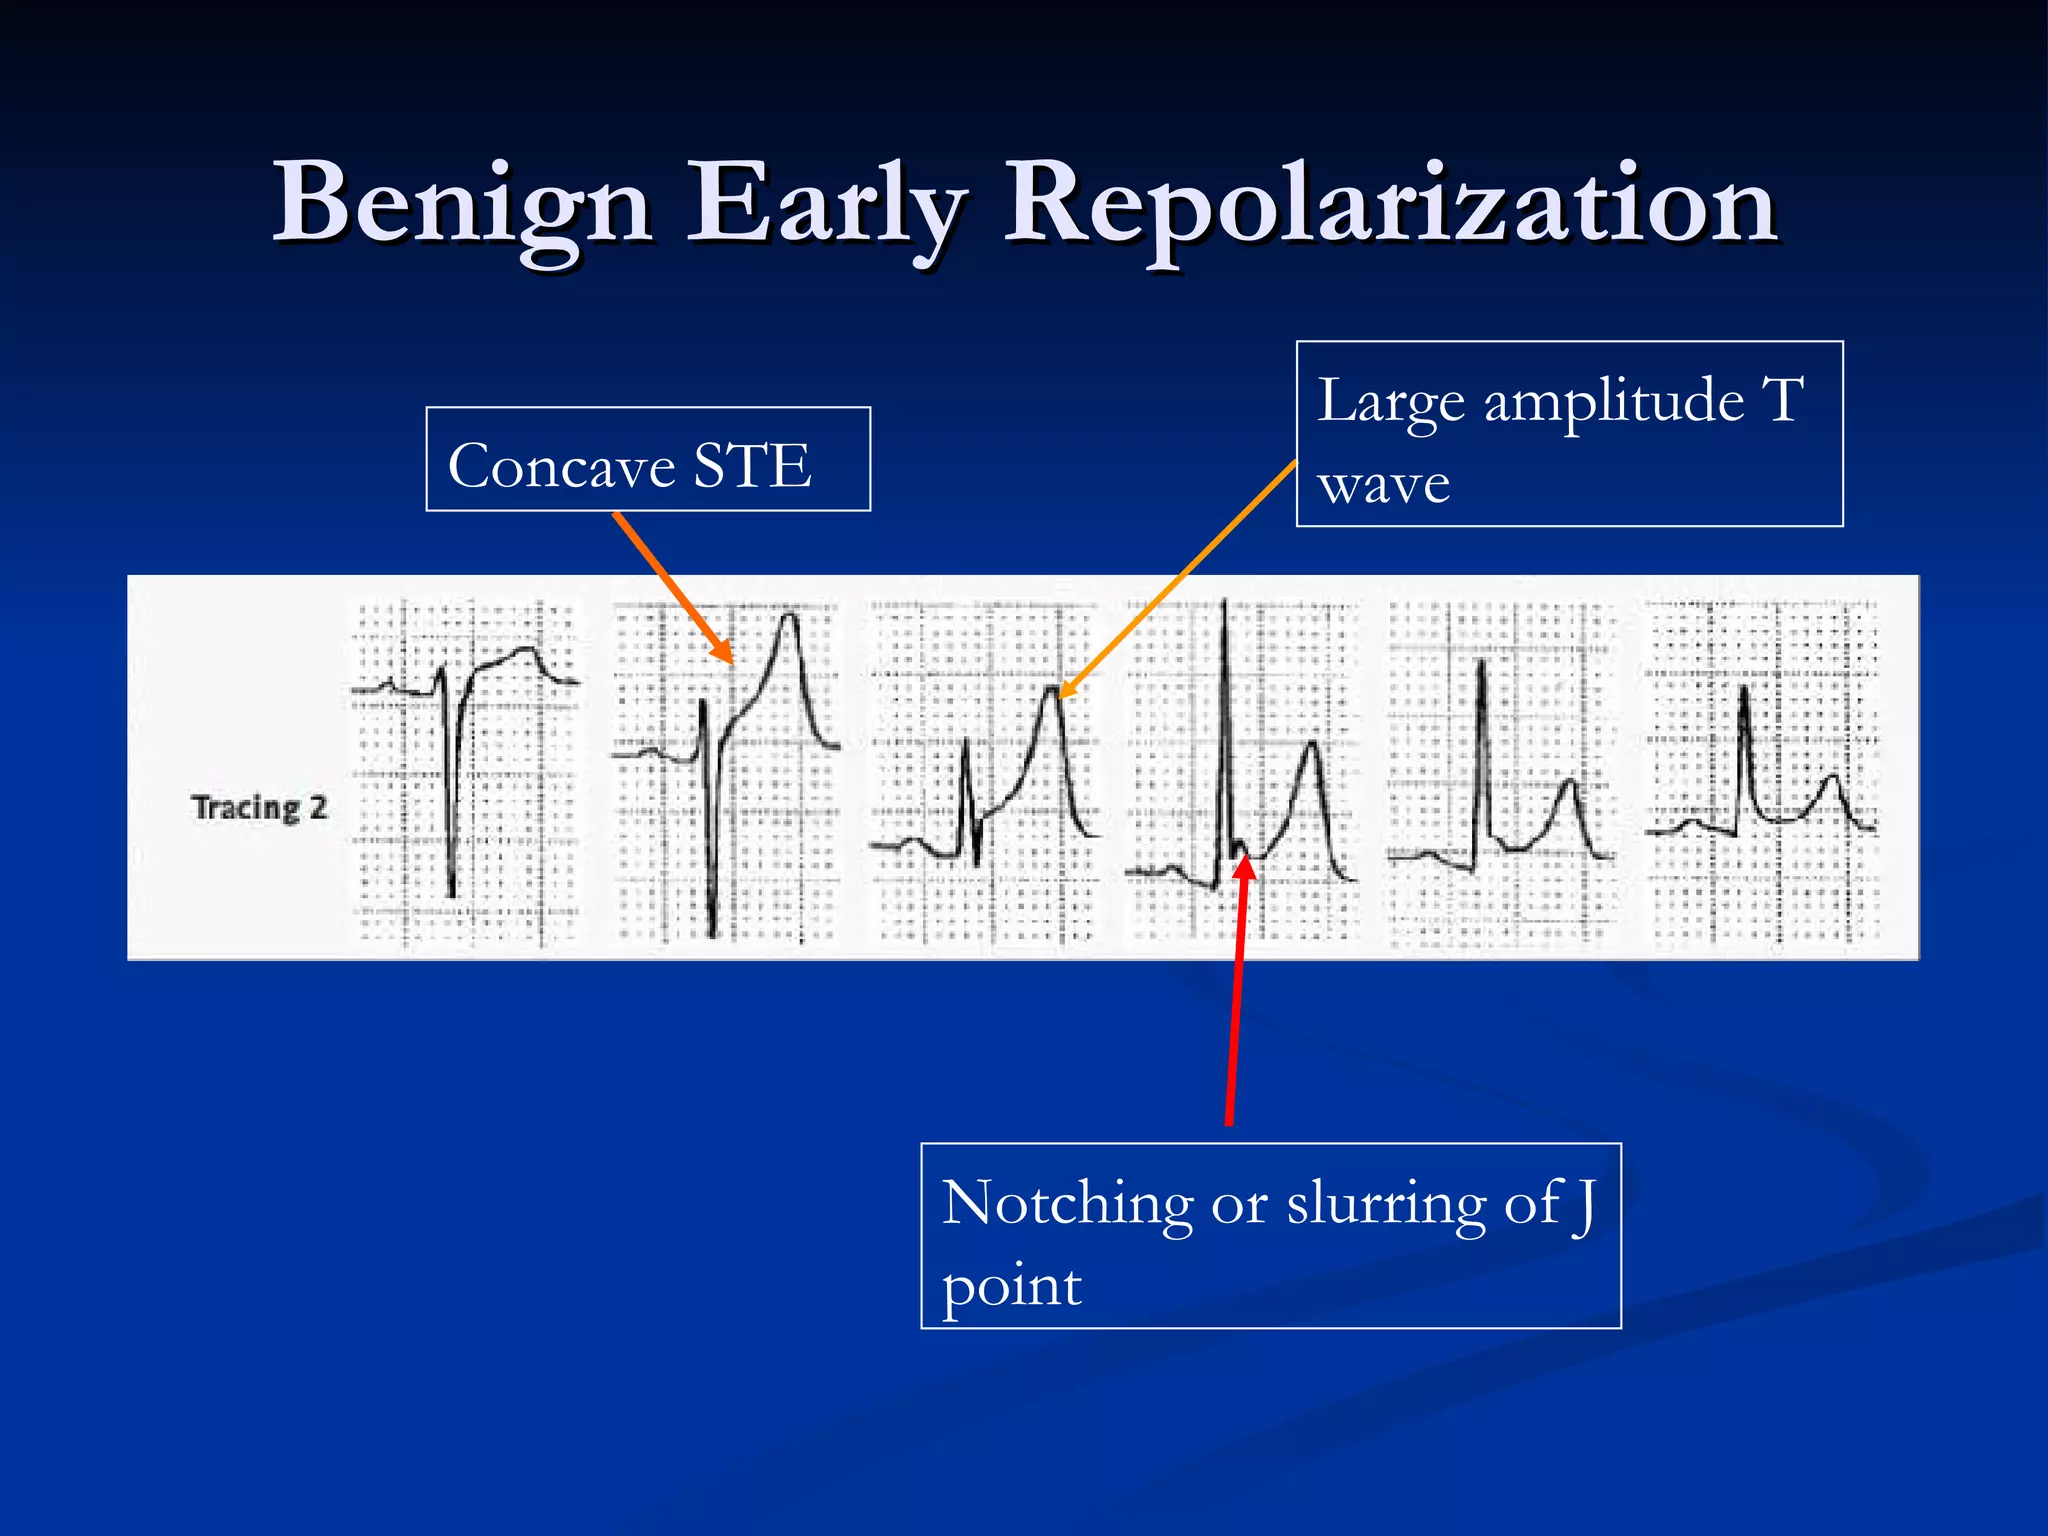


ST segment elevations can be seen in acute myocardial infarction (AMI) but also have other causes. Non-AMI causes of ST elevation include left bundle branch block, left ventricular hypertrophy, pericarditis, Brugada syndrome, and early repolarization. The morphology, distribution, and magnitude of ST elevations, as well as other ECG features, can help differentiate AMI from other causes of ST elevation. It can be challenging to diagnose AMI using ECG criteria alone, as around half of AMI cases present without typical ST elevation patterns.
Introduction to ST segment elevation in ECG depicting its relevance in diagnosing heart conditions.
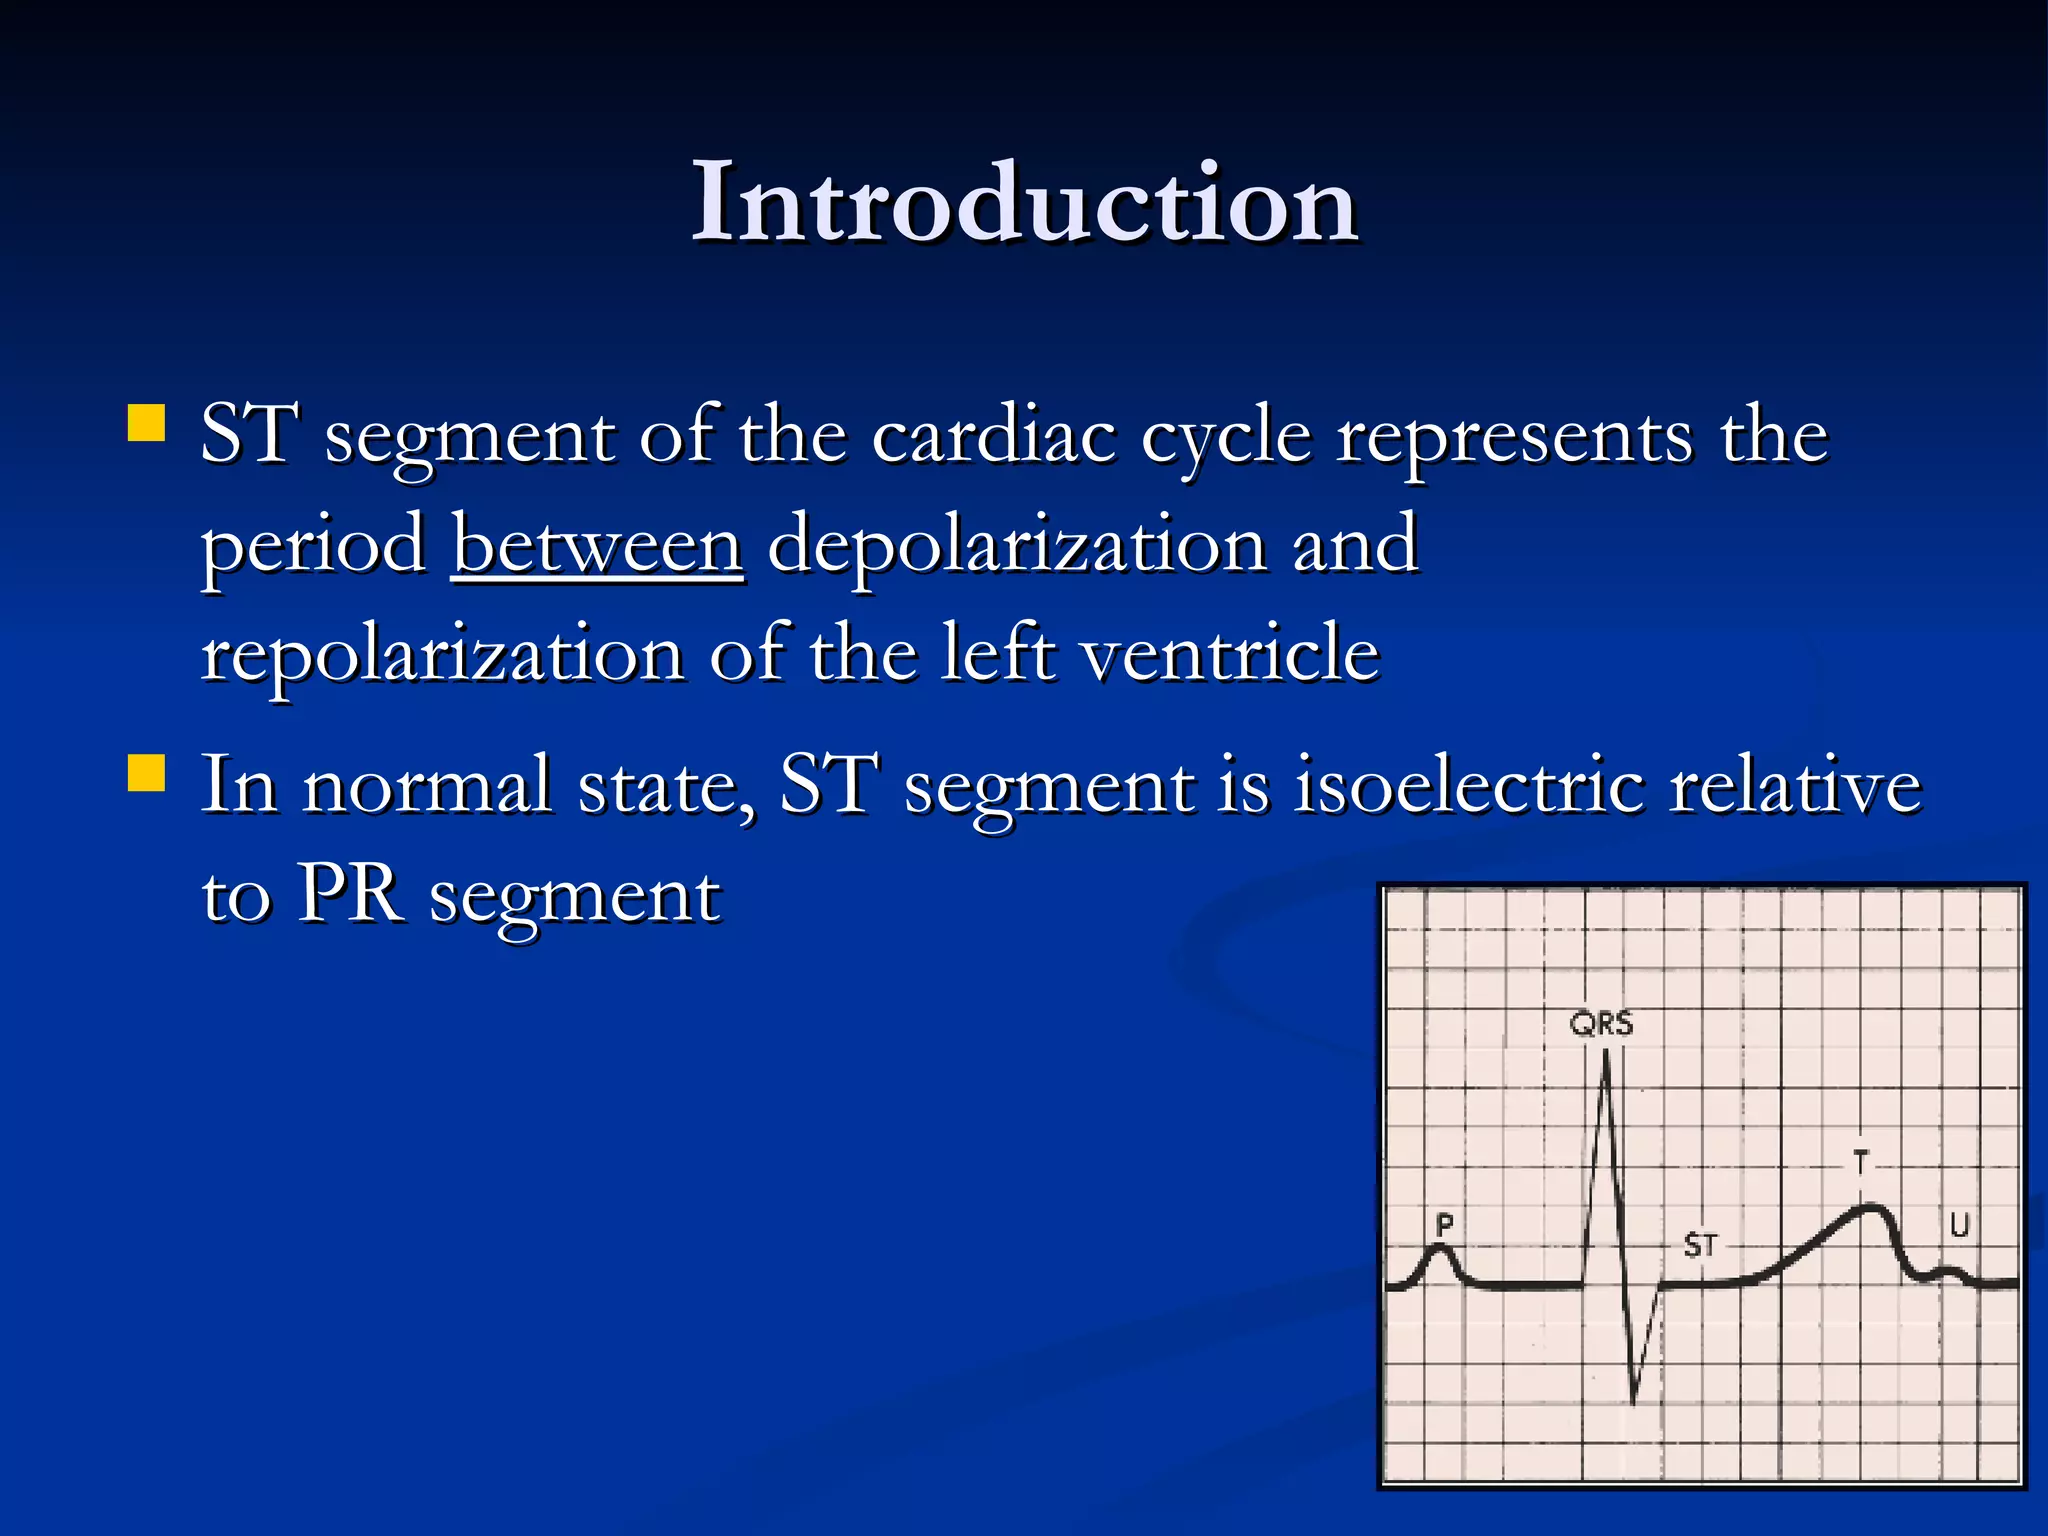
The ST segment interval signifies left ventricle activities. Notably, many elevations aren't due to myocardial infarctions; e.g., in a study, 51% had non-MI causes.
Lists various causes of ST segment elevation including pericarditis, AMI, and others, emphasizing its differential diagnosis.
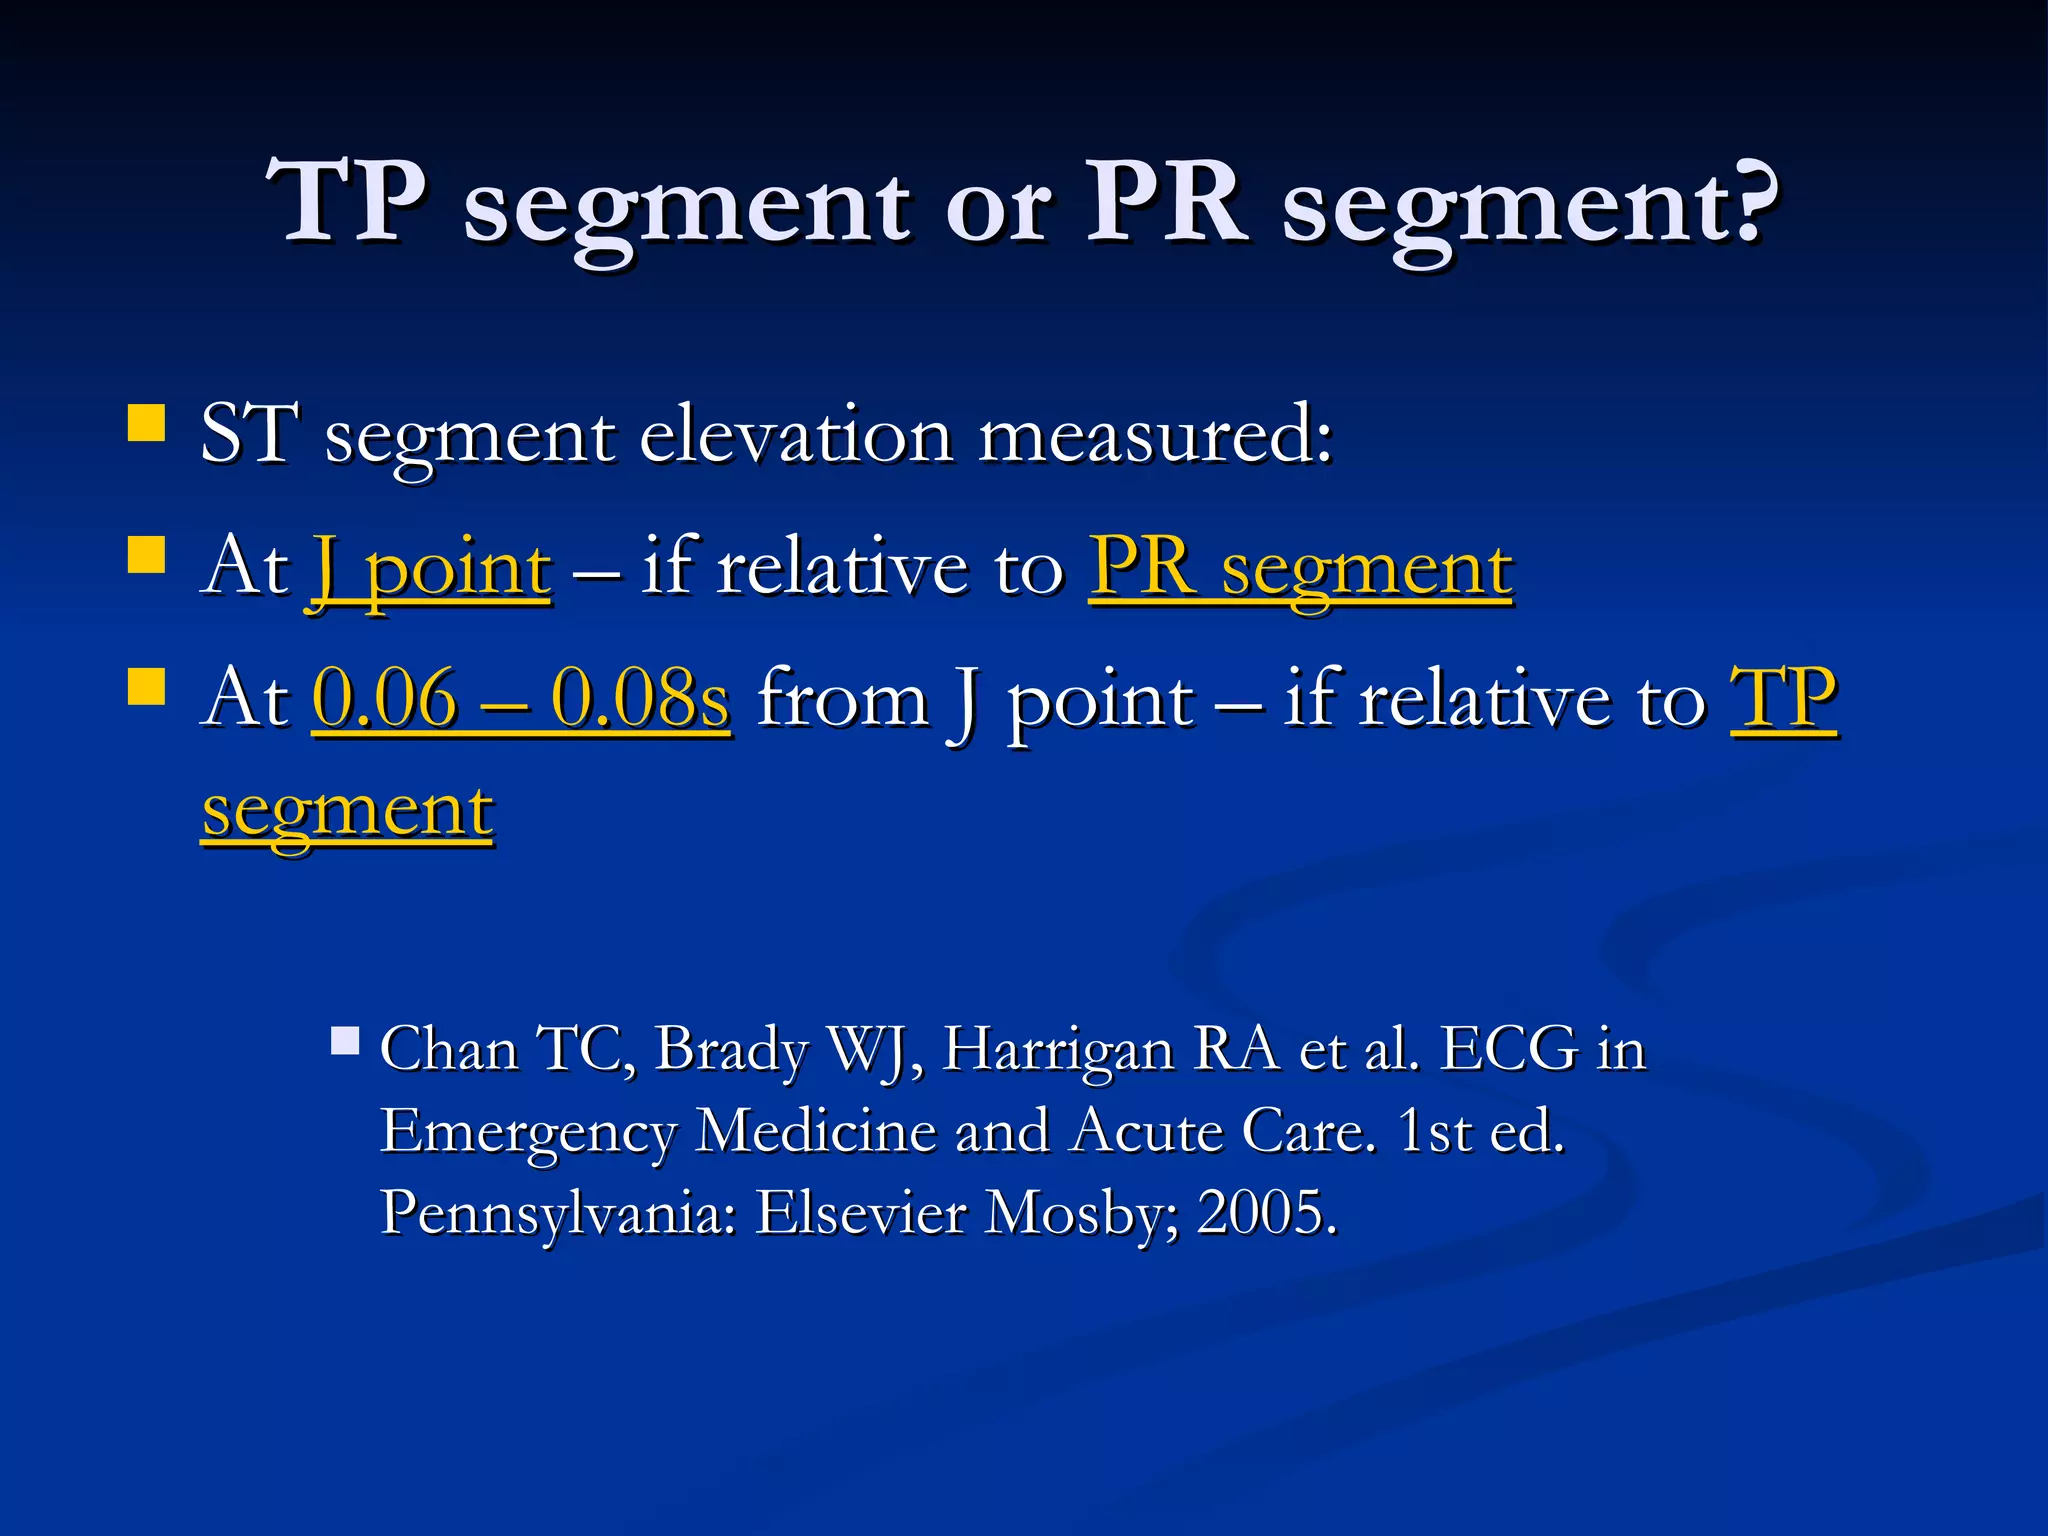
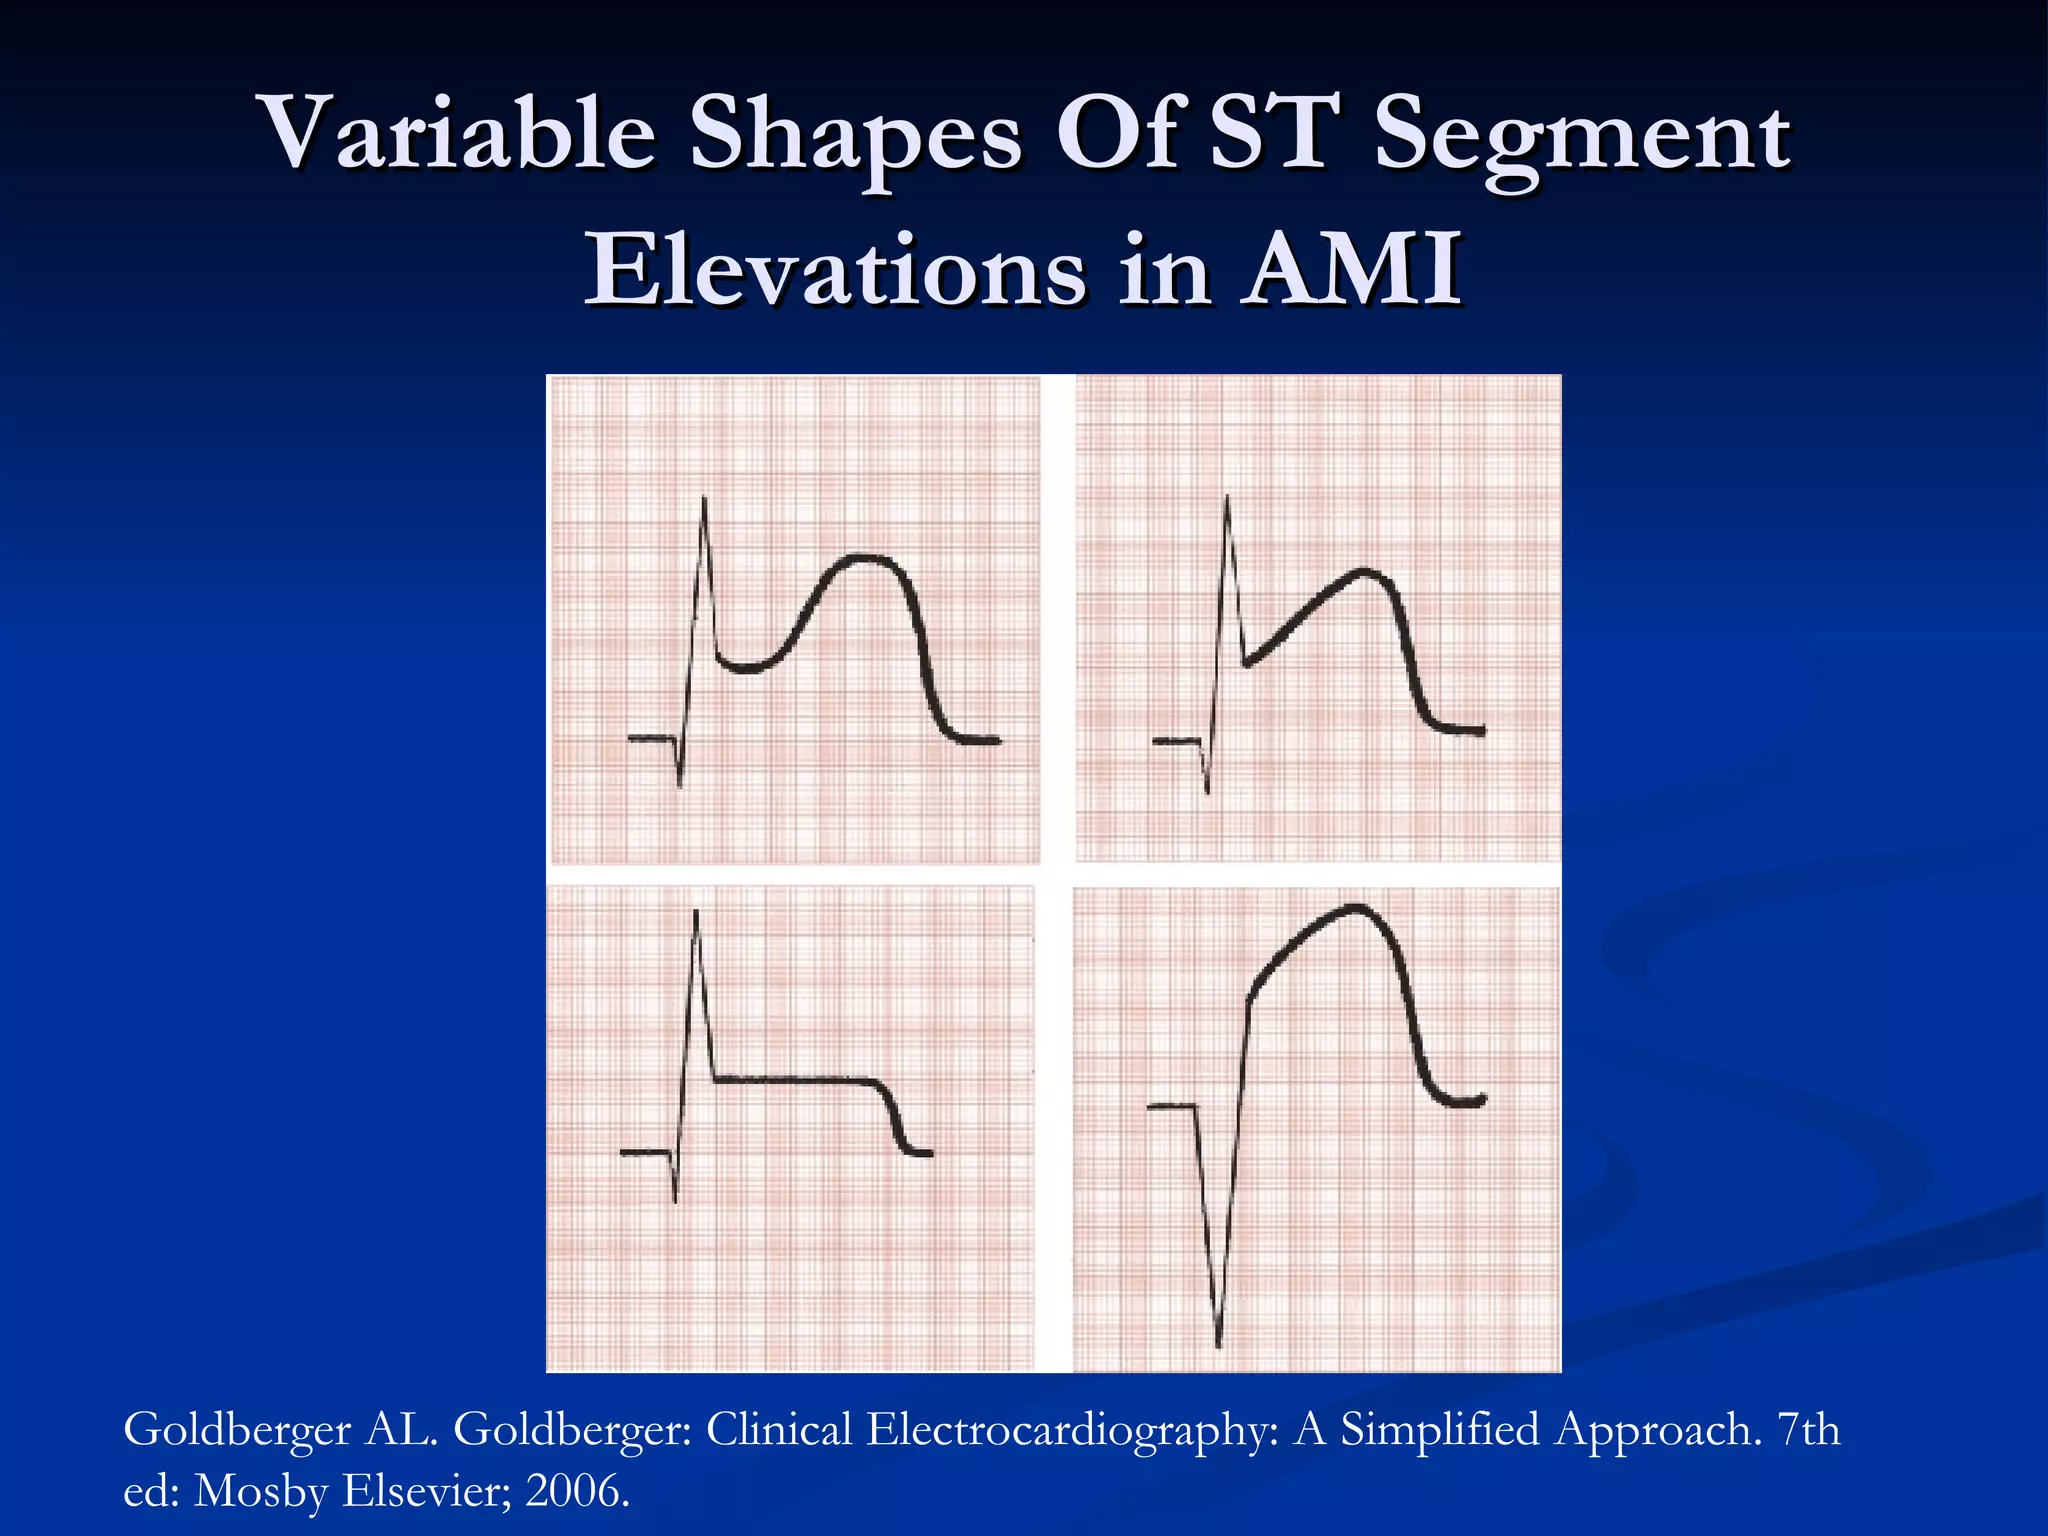
Historic context and physiological mechanisms behind ST segment elevation during AMI are discussed, detailing measurement techniques.
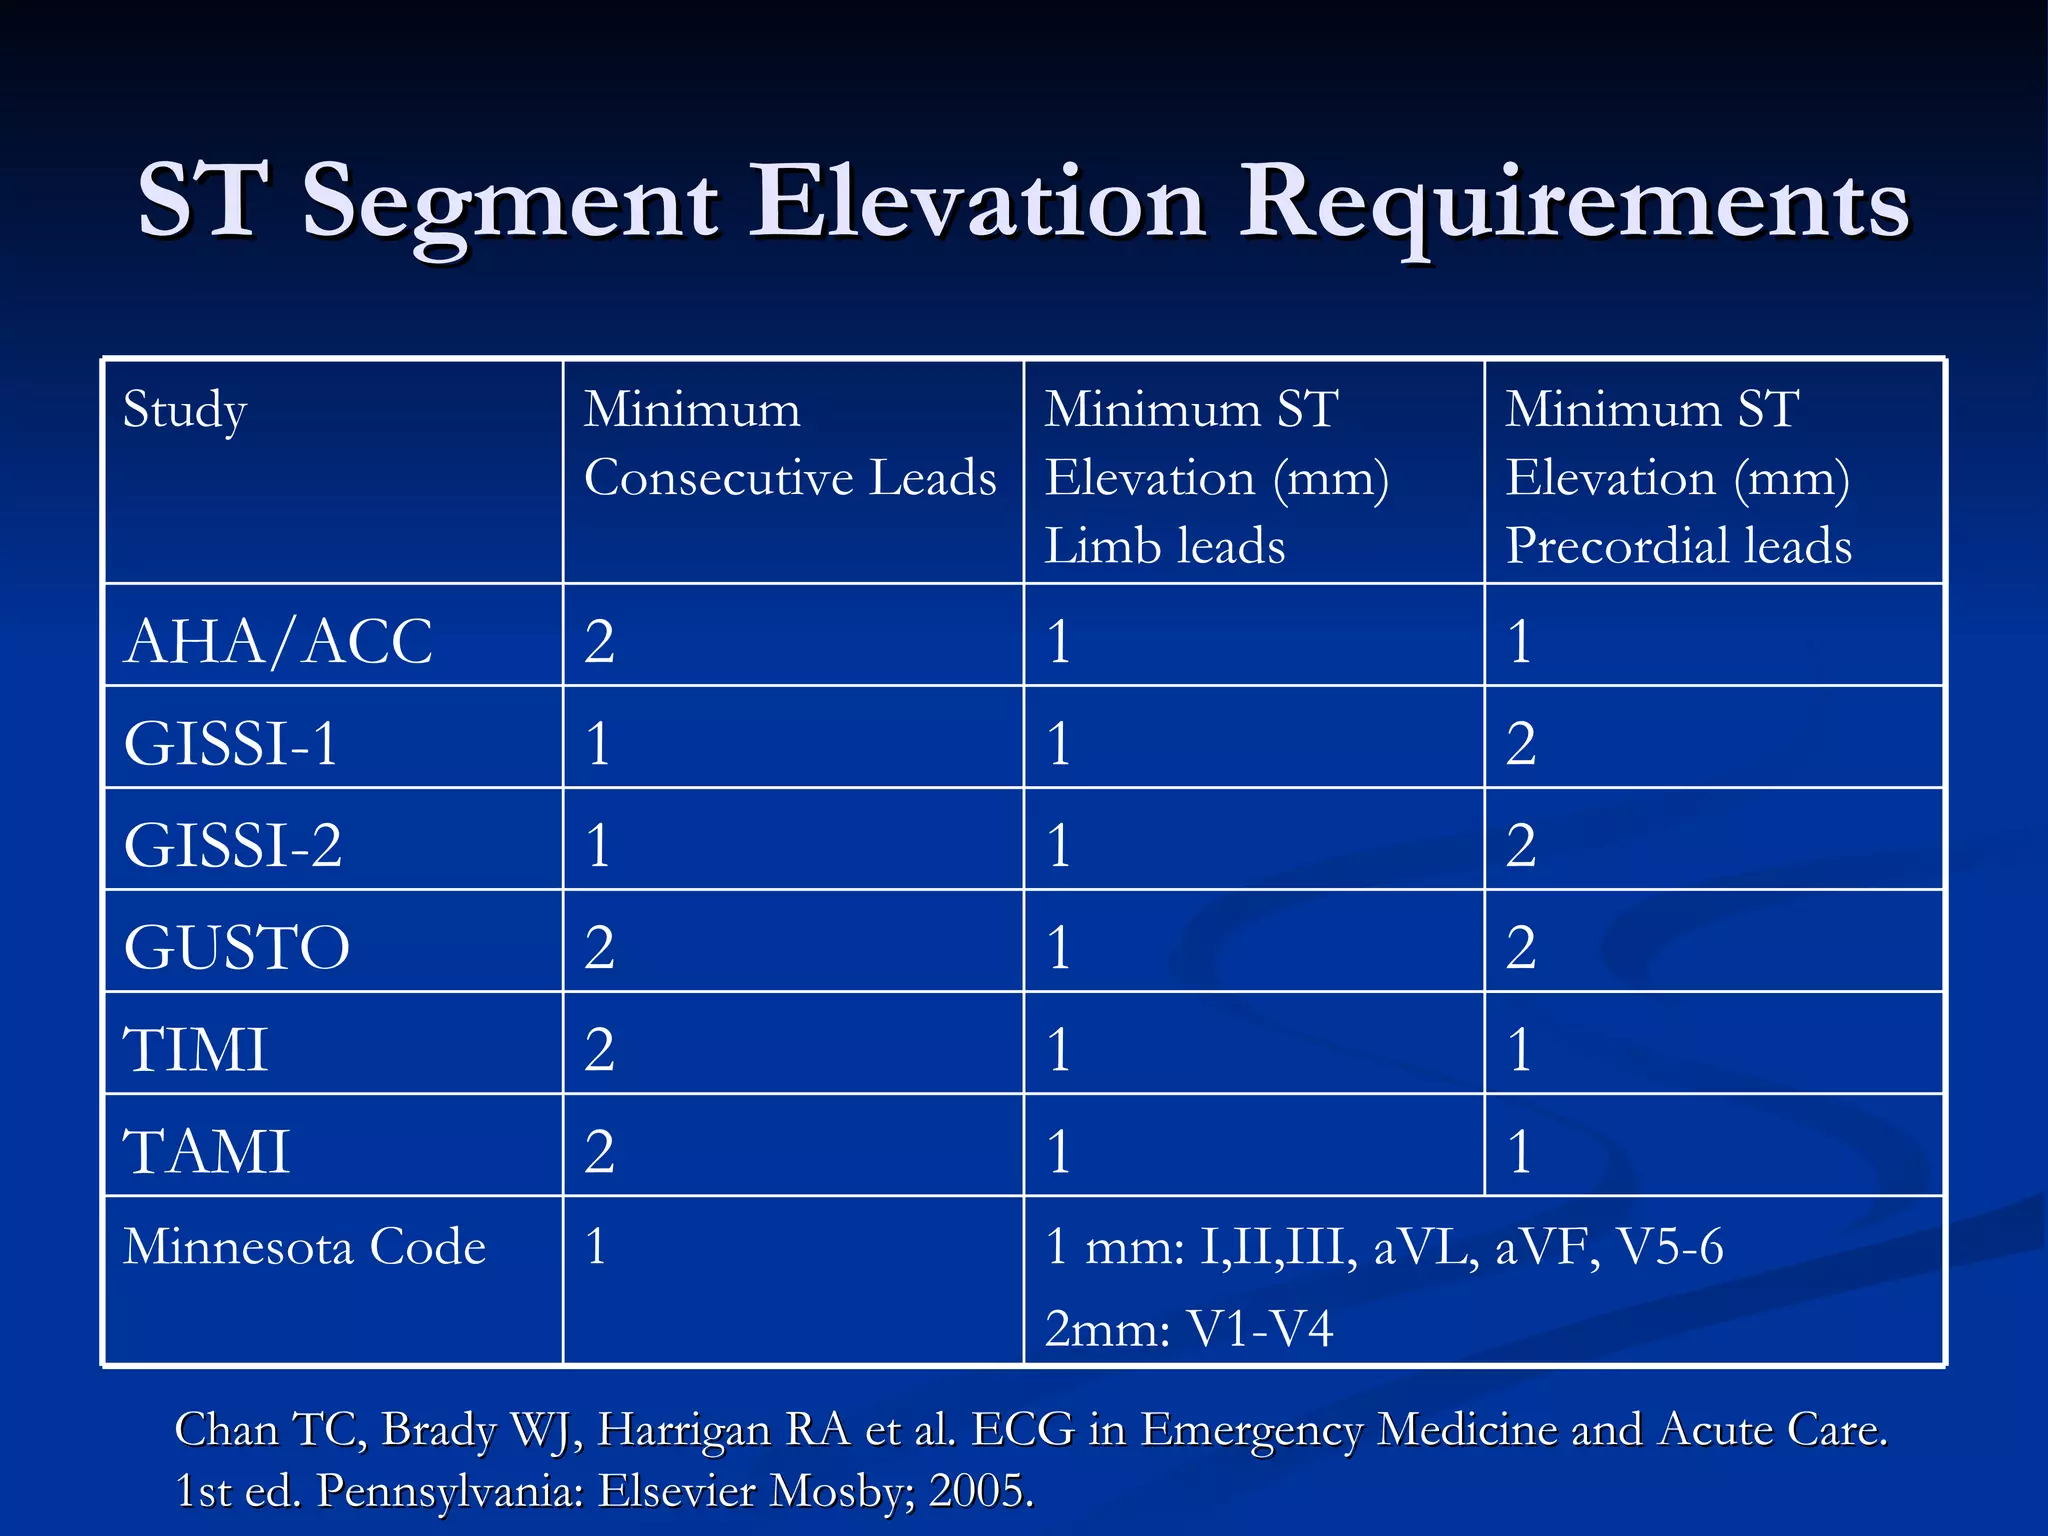
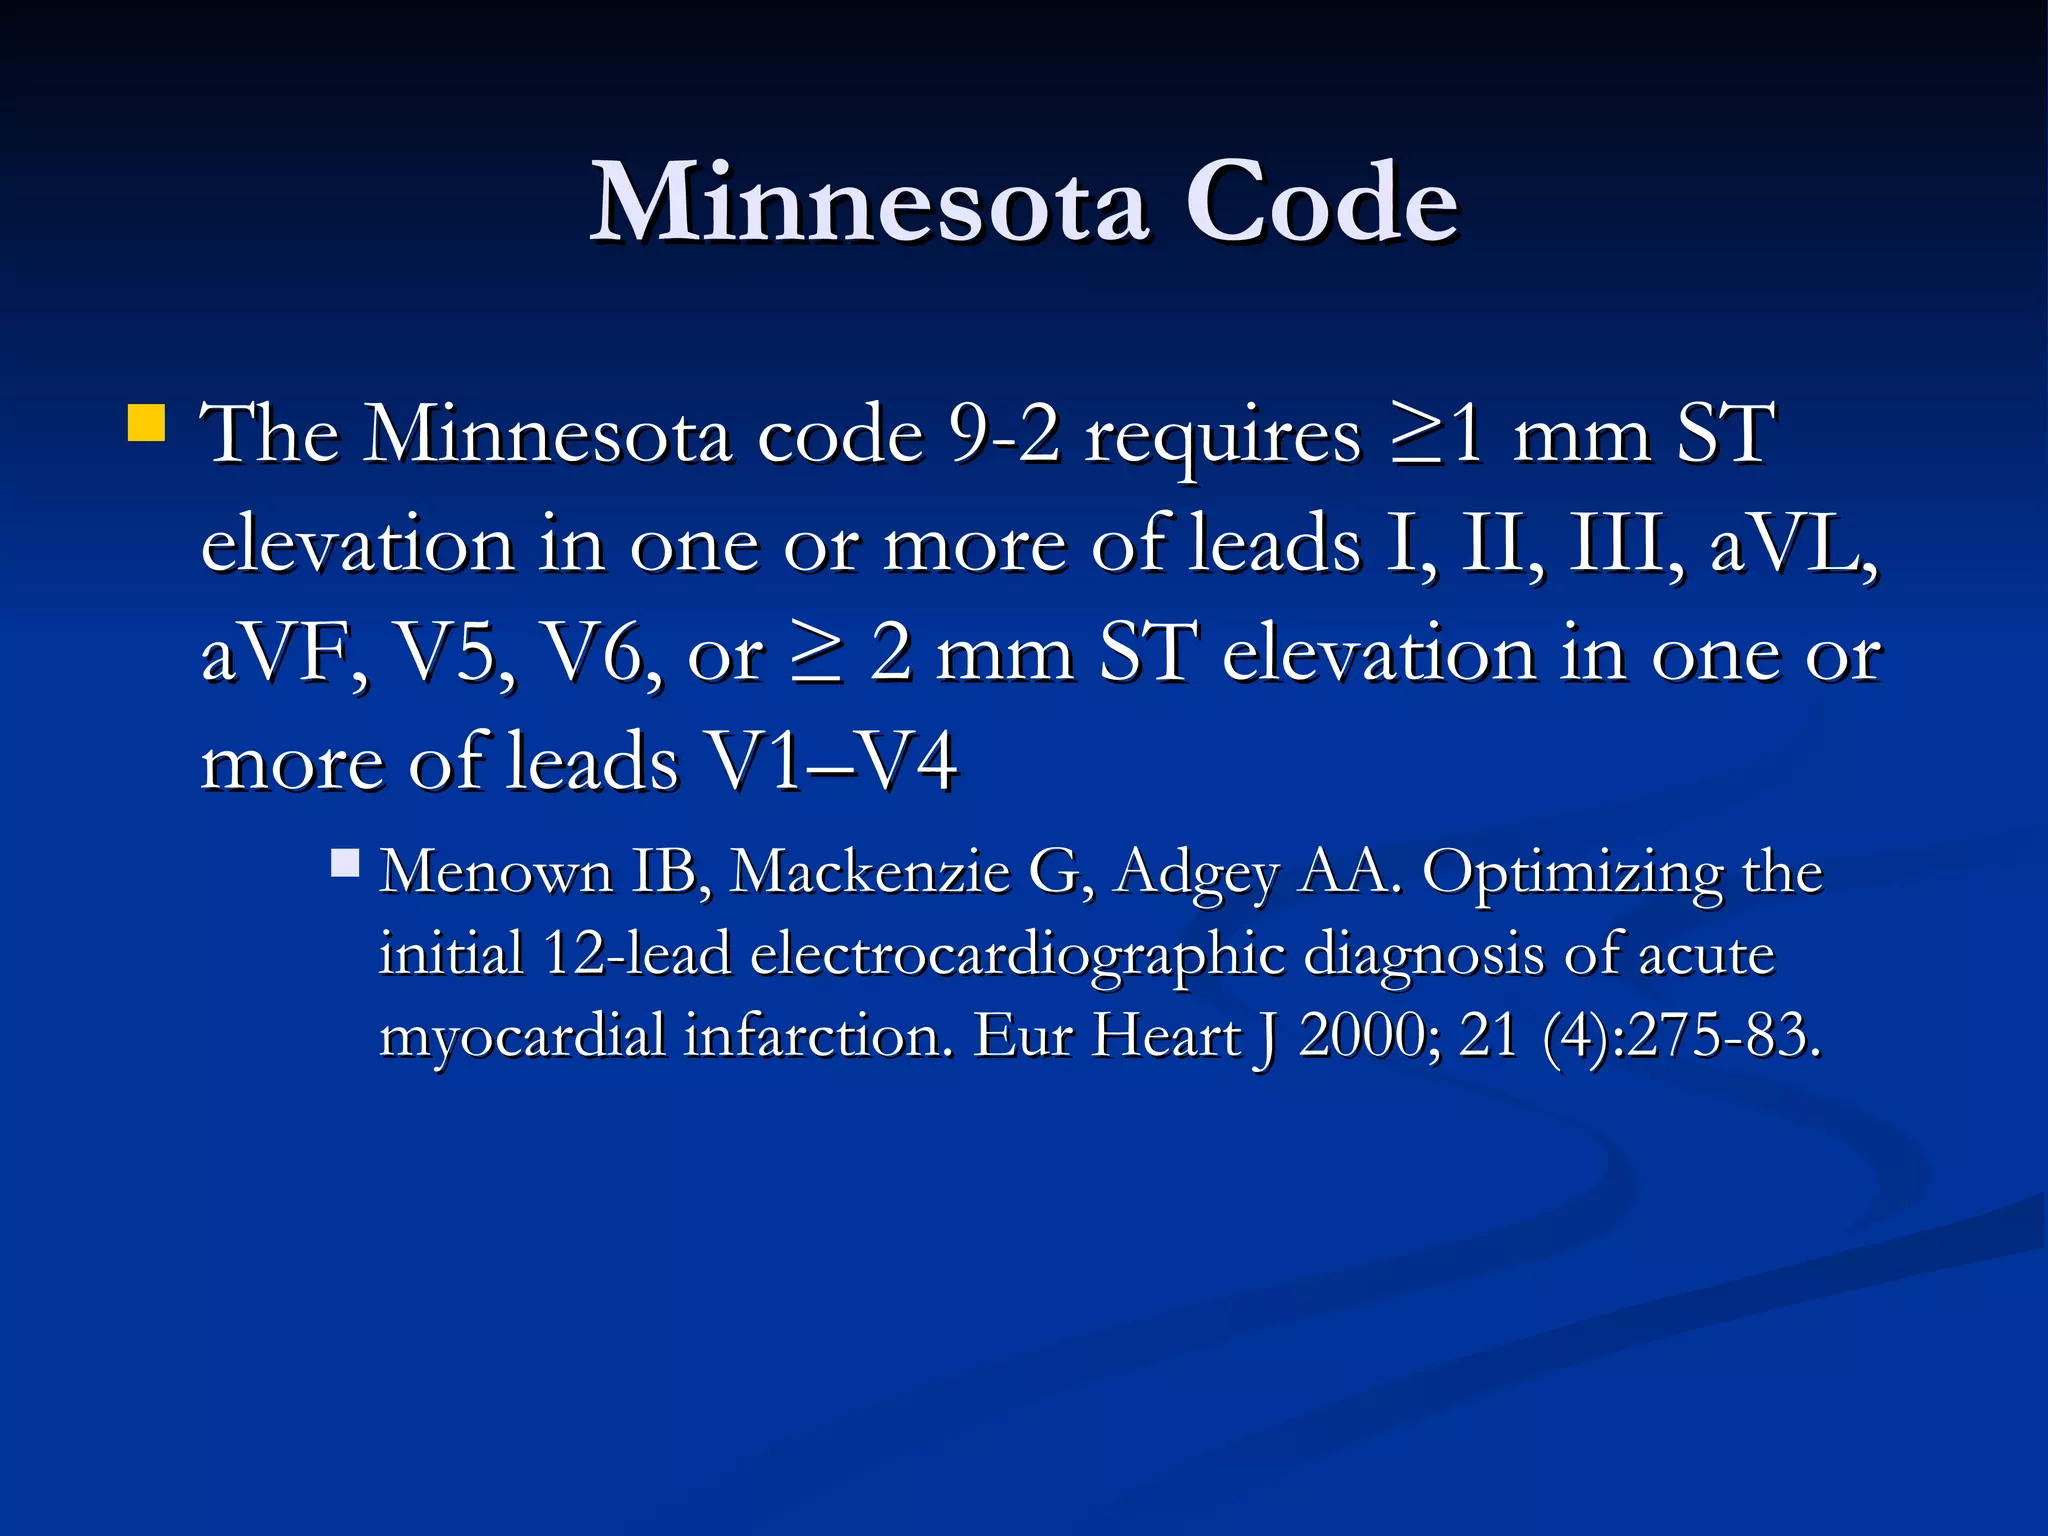
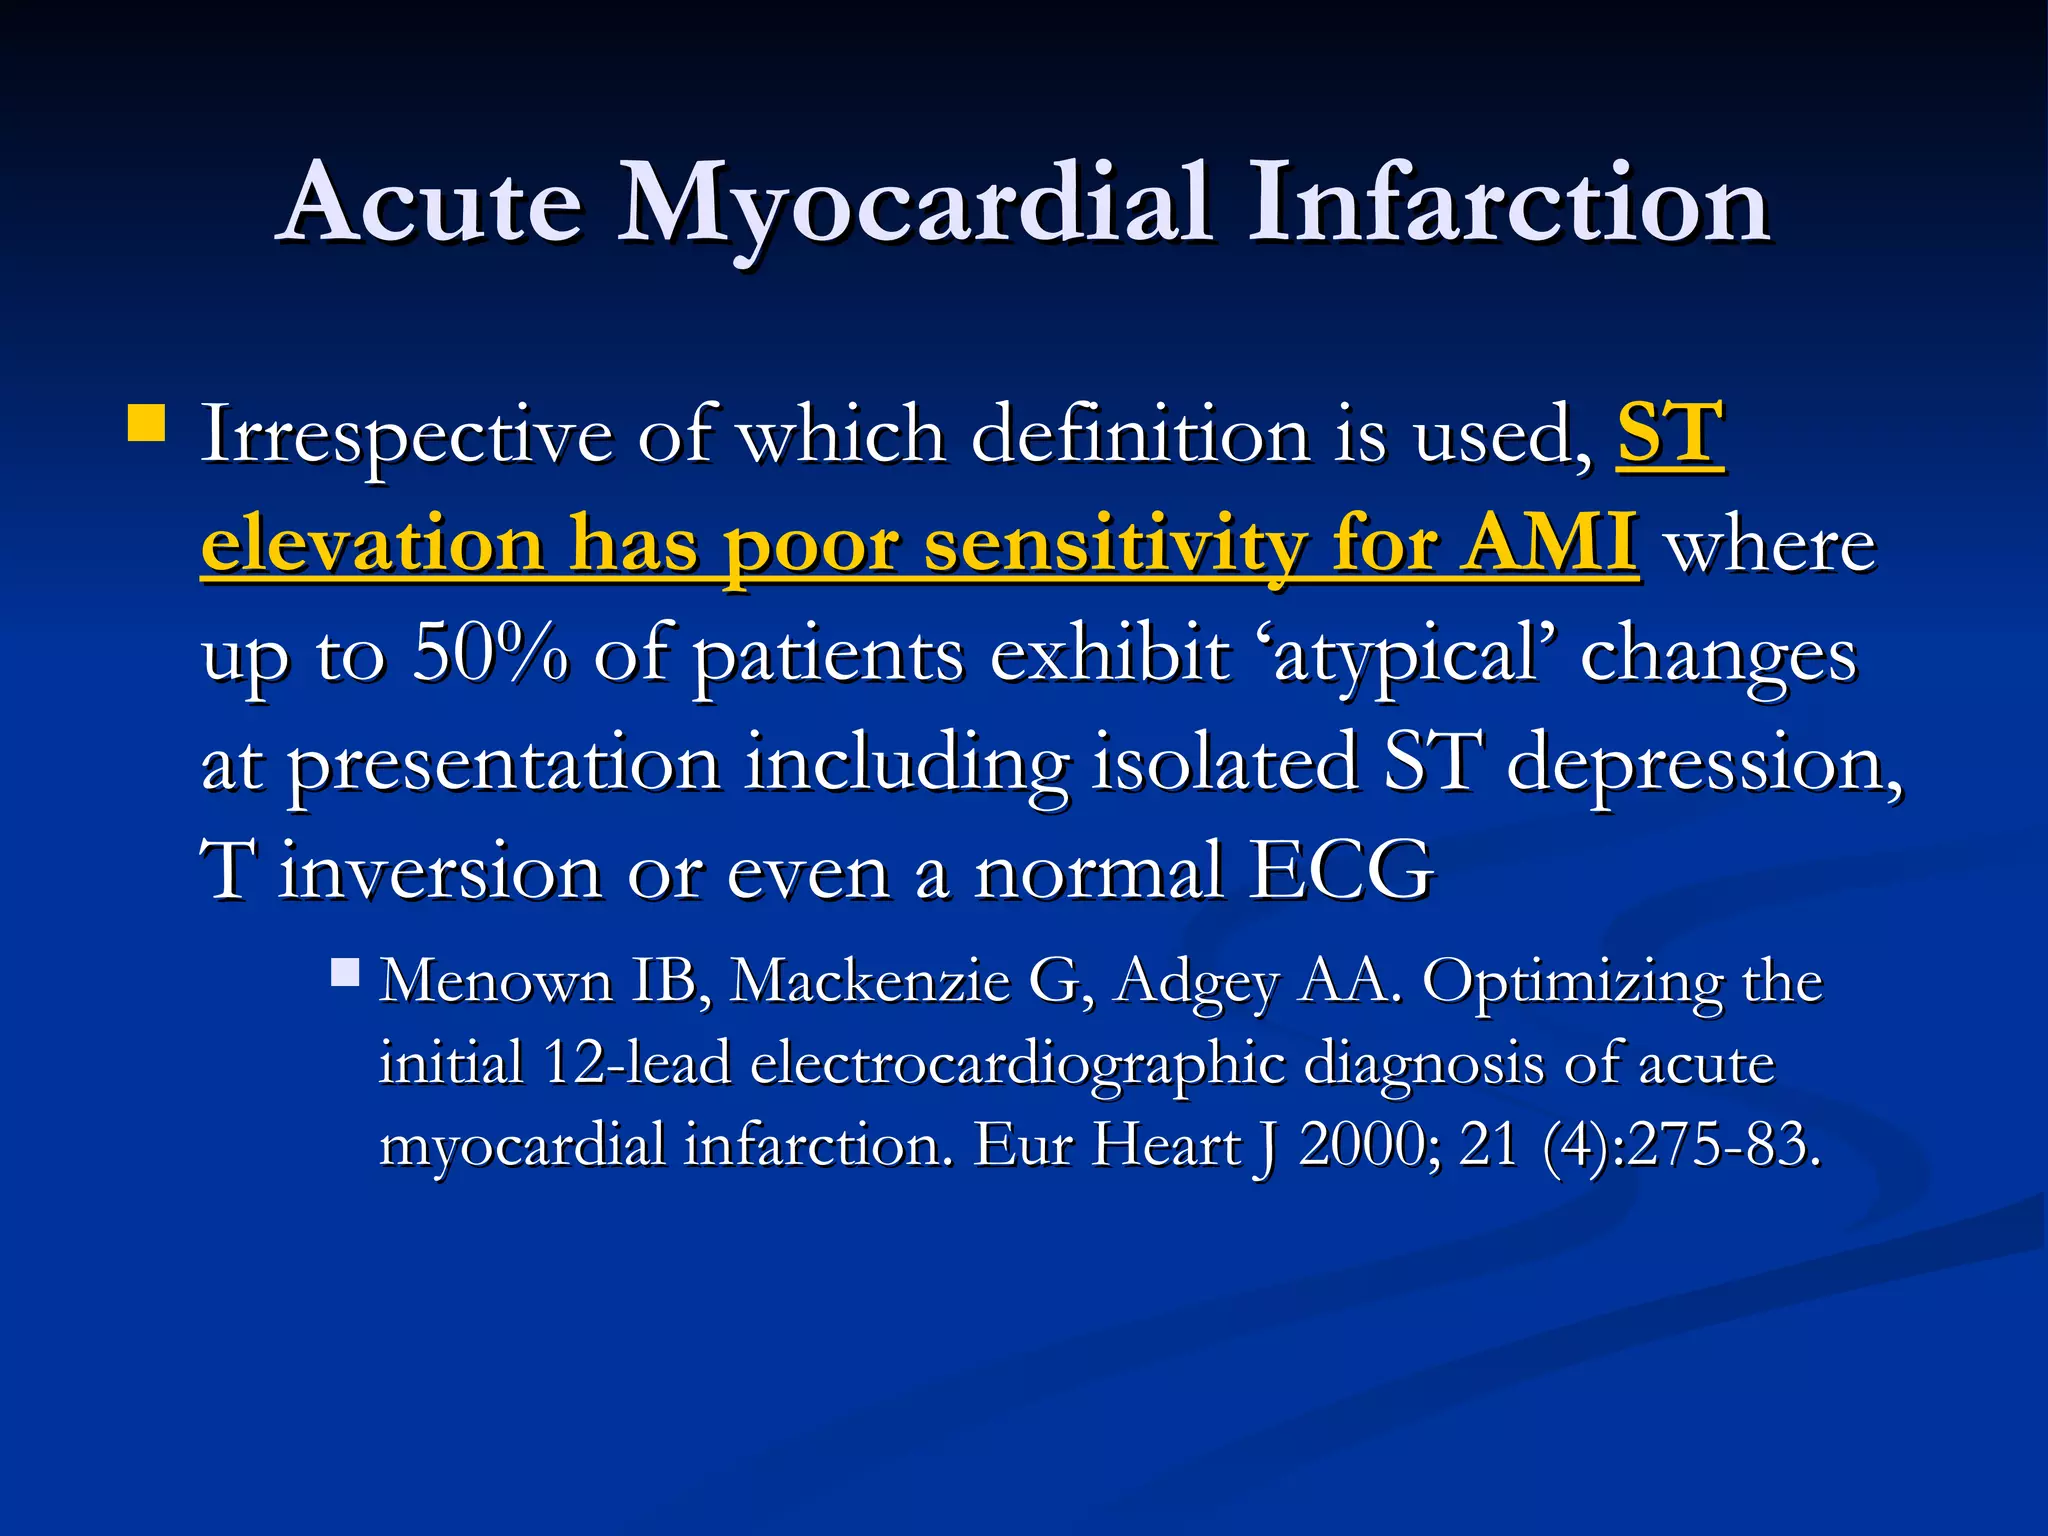
Requirements for ST segment elevation delineated through various criteria (e.g. Minnesota code), noting low sensitivity for acute myocardial infarction.
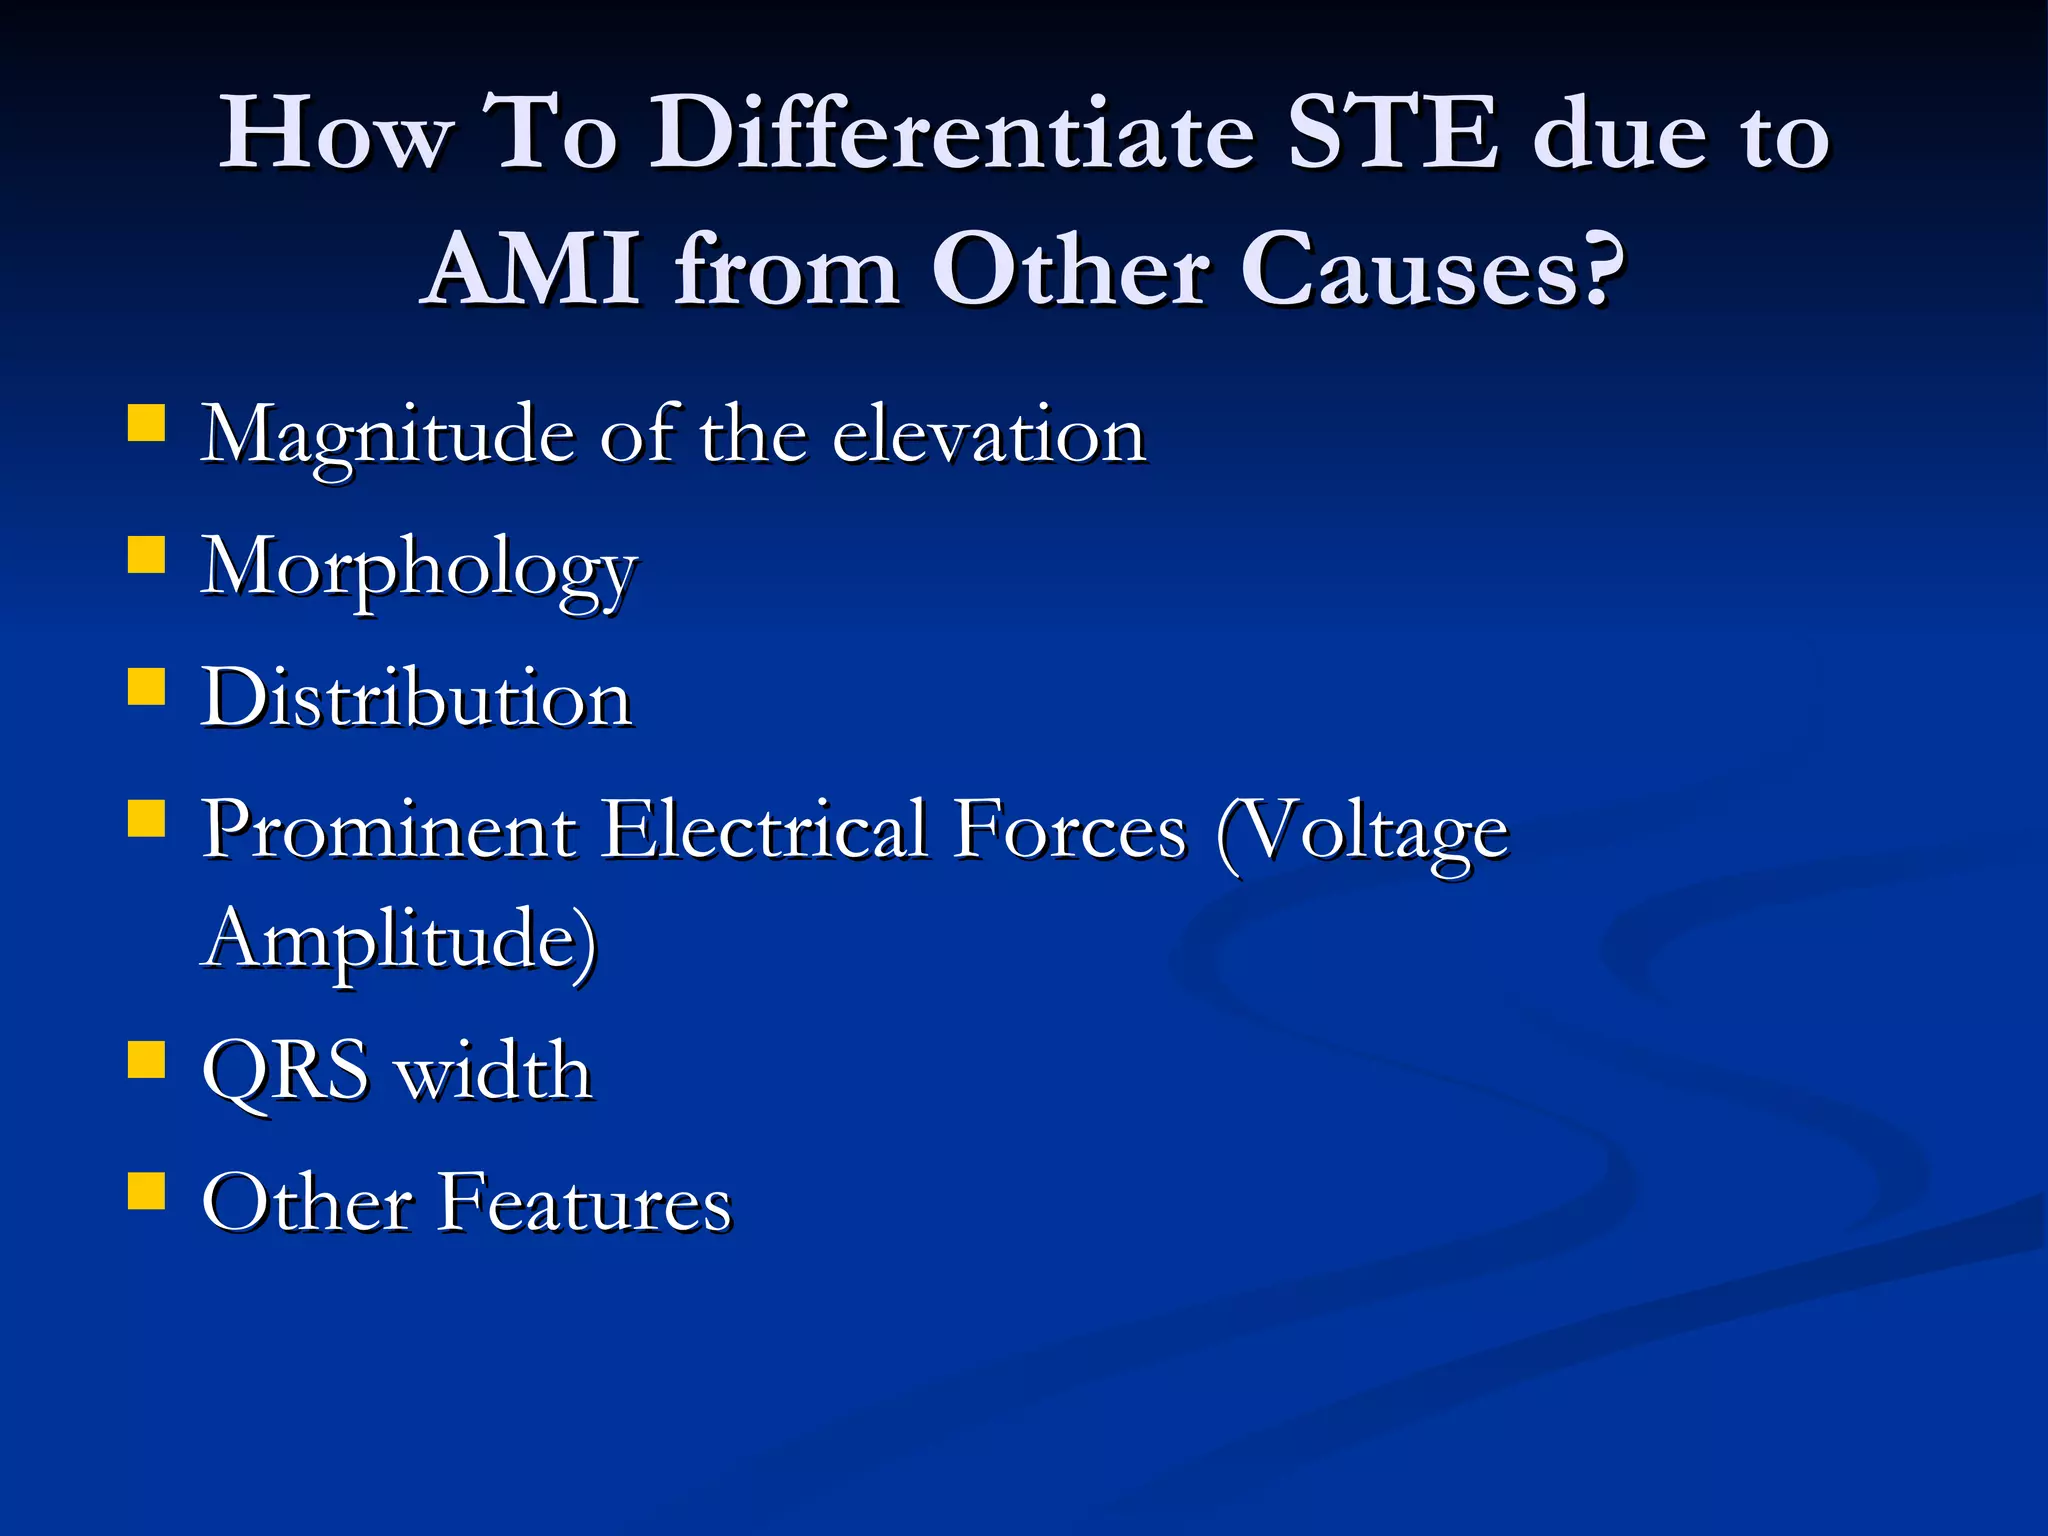
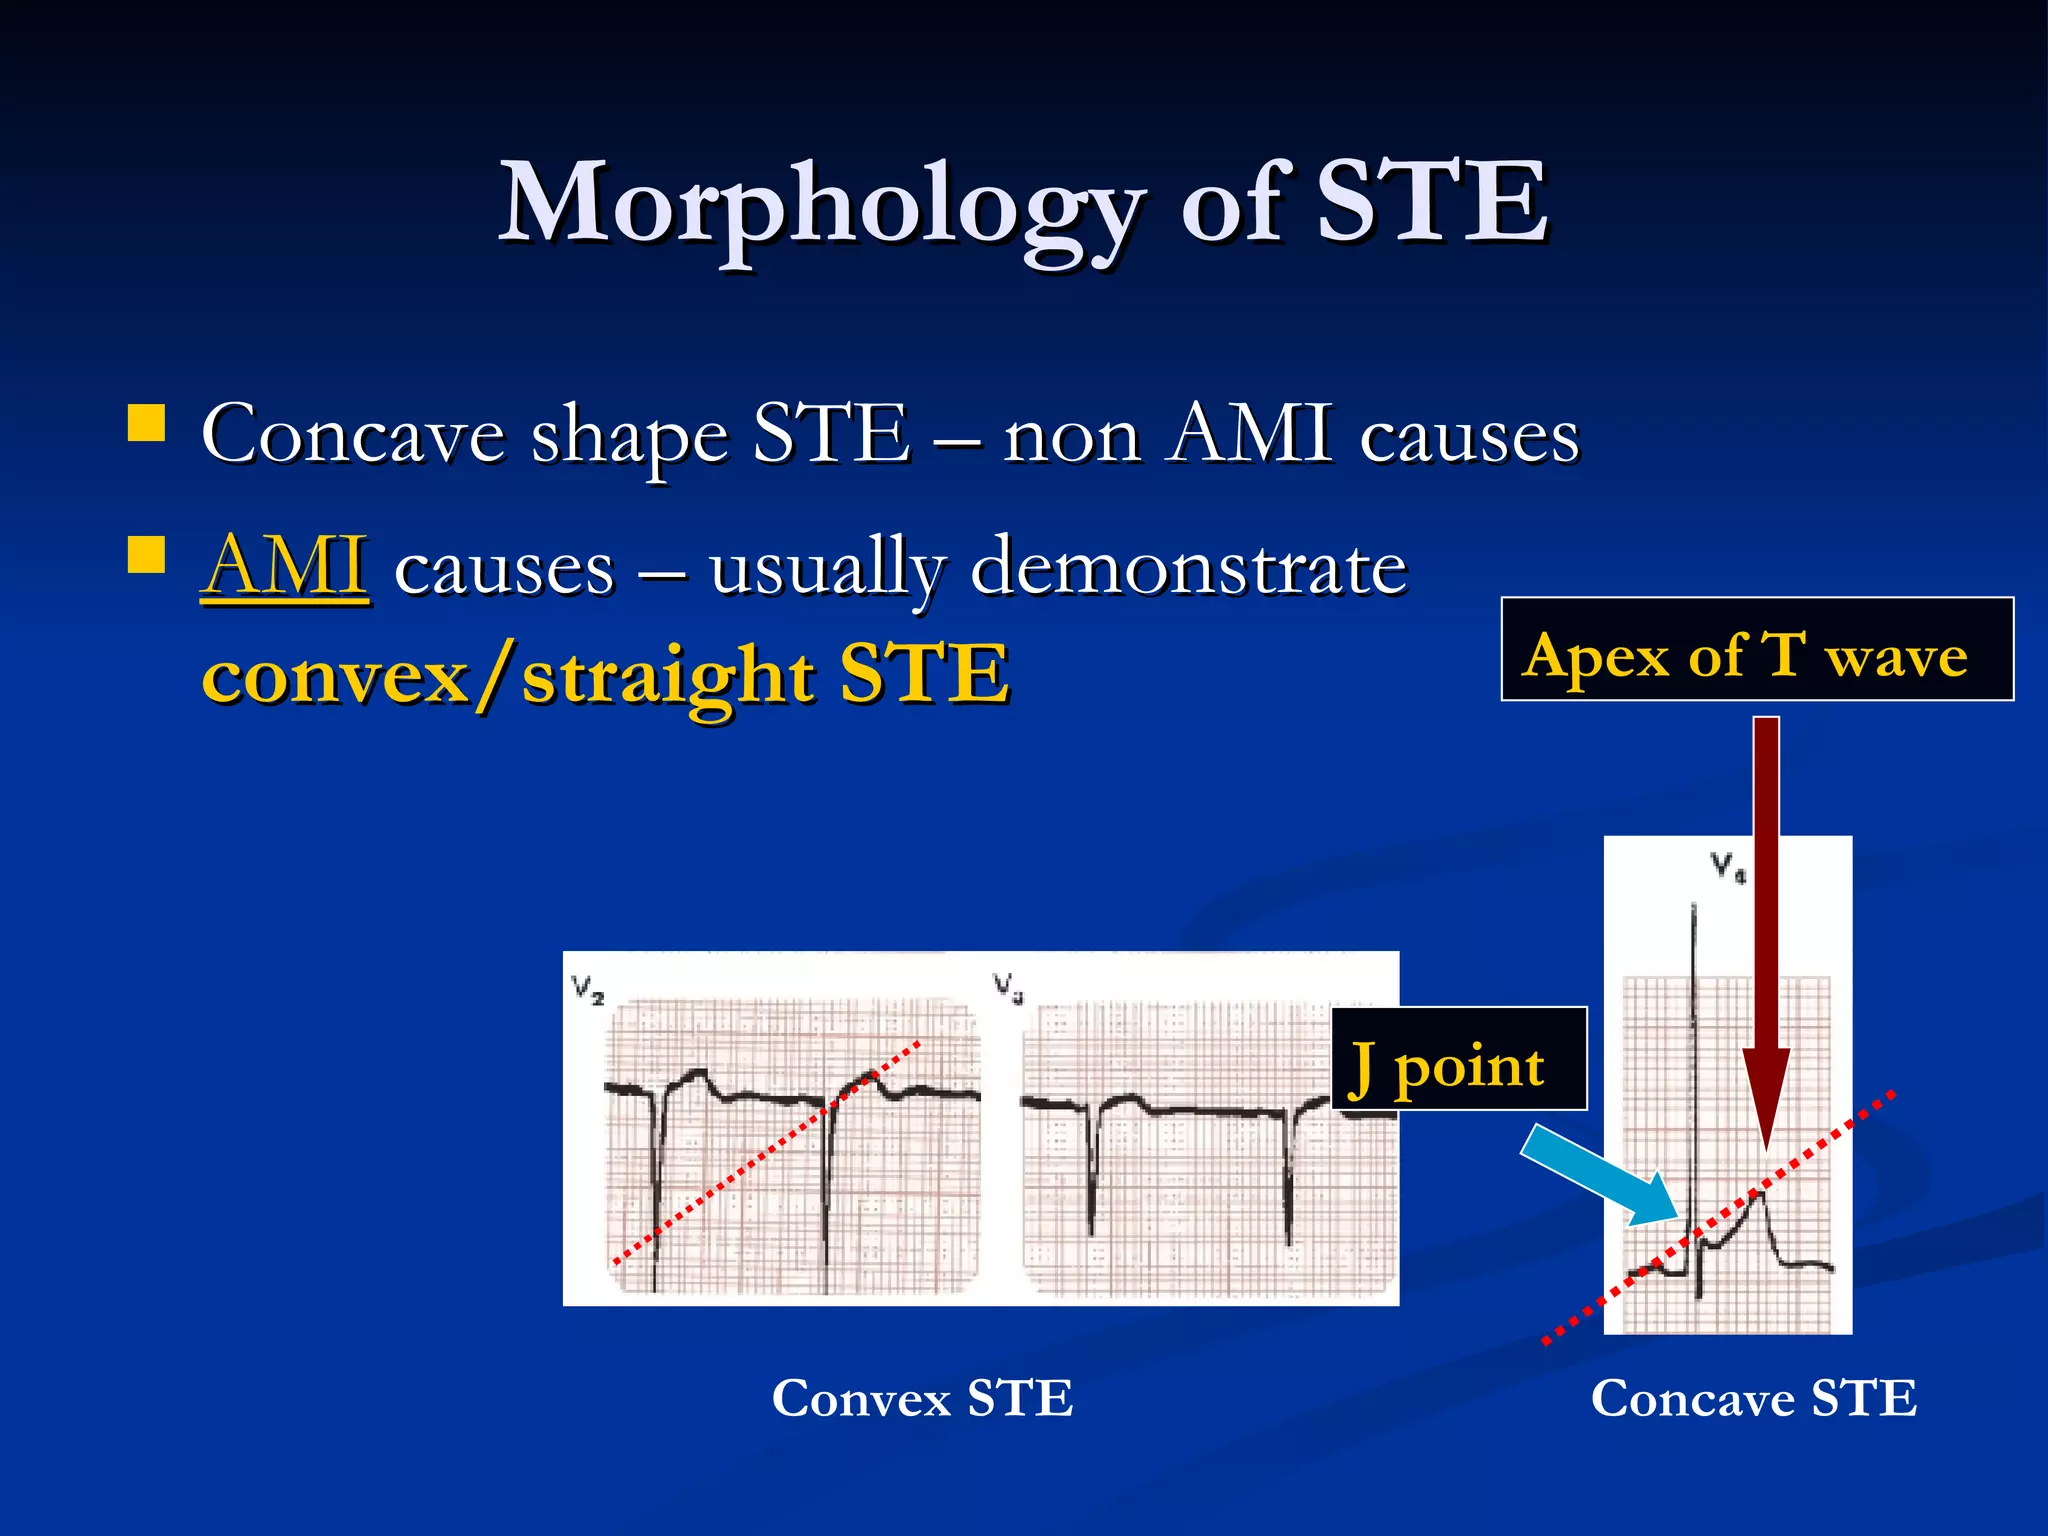
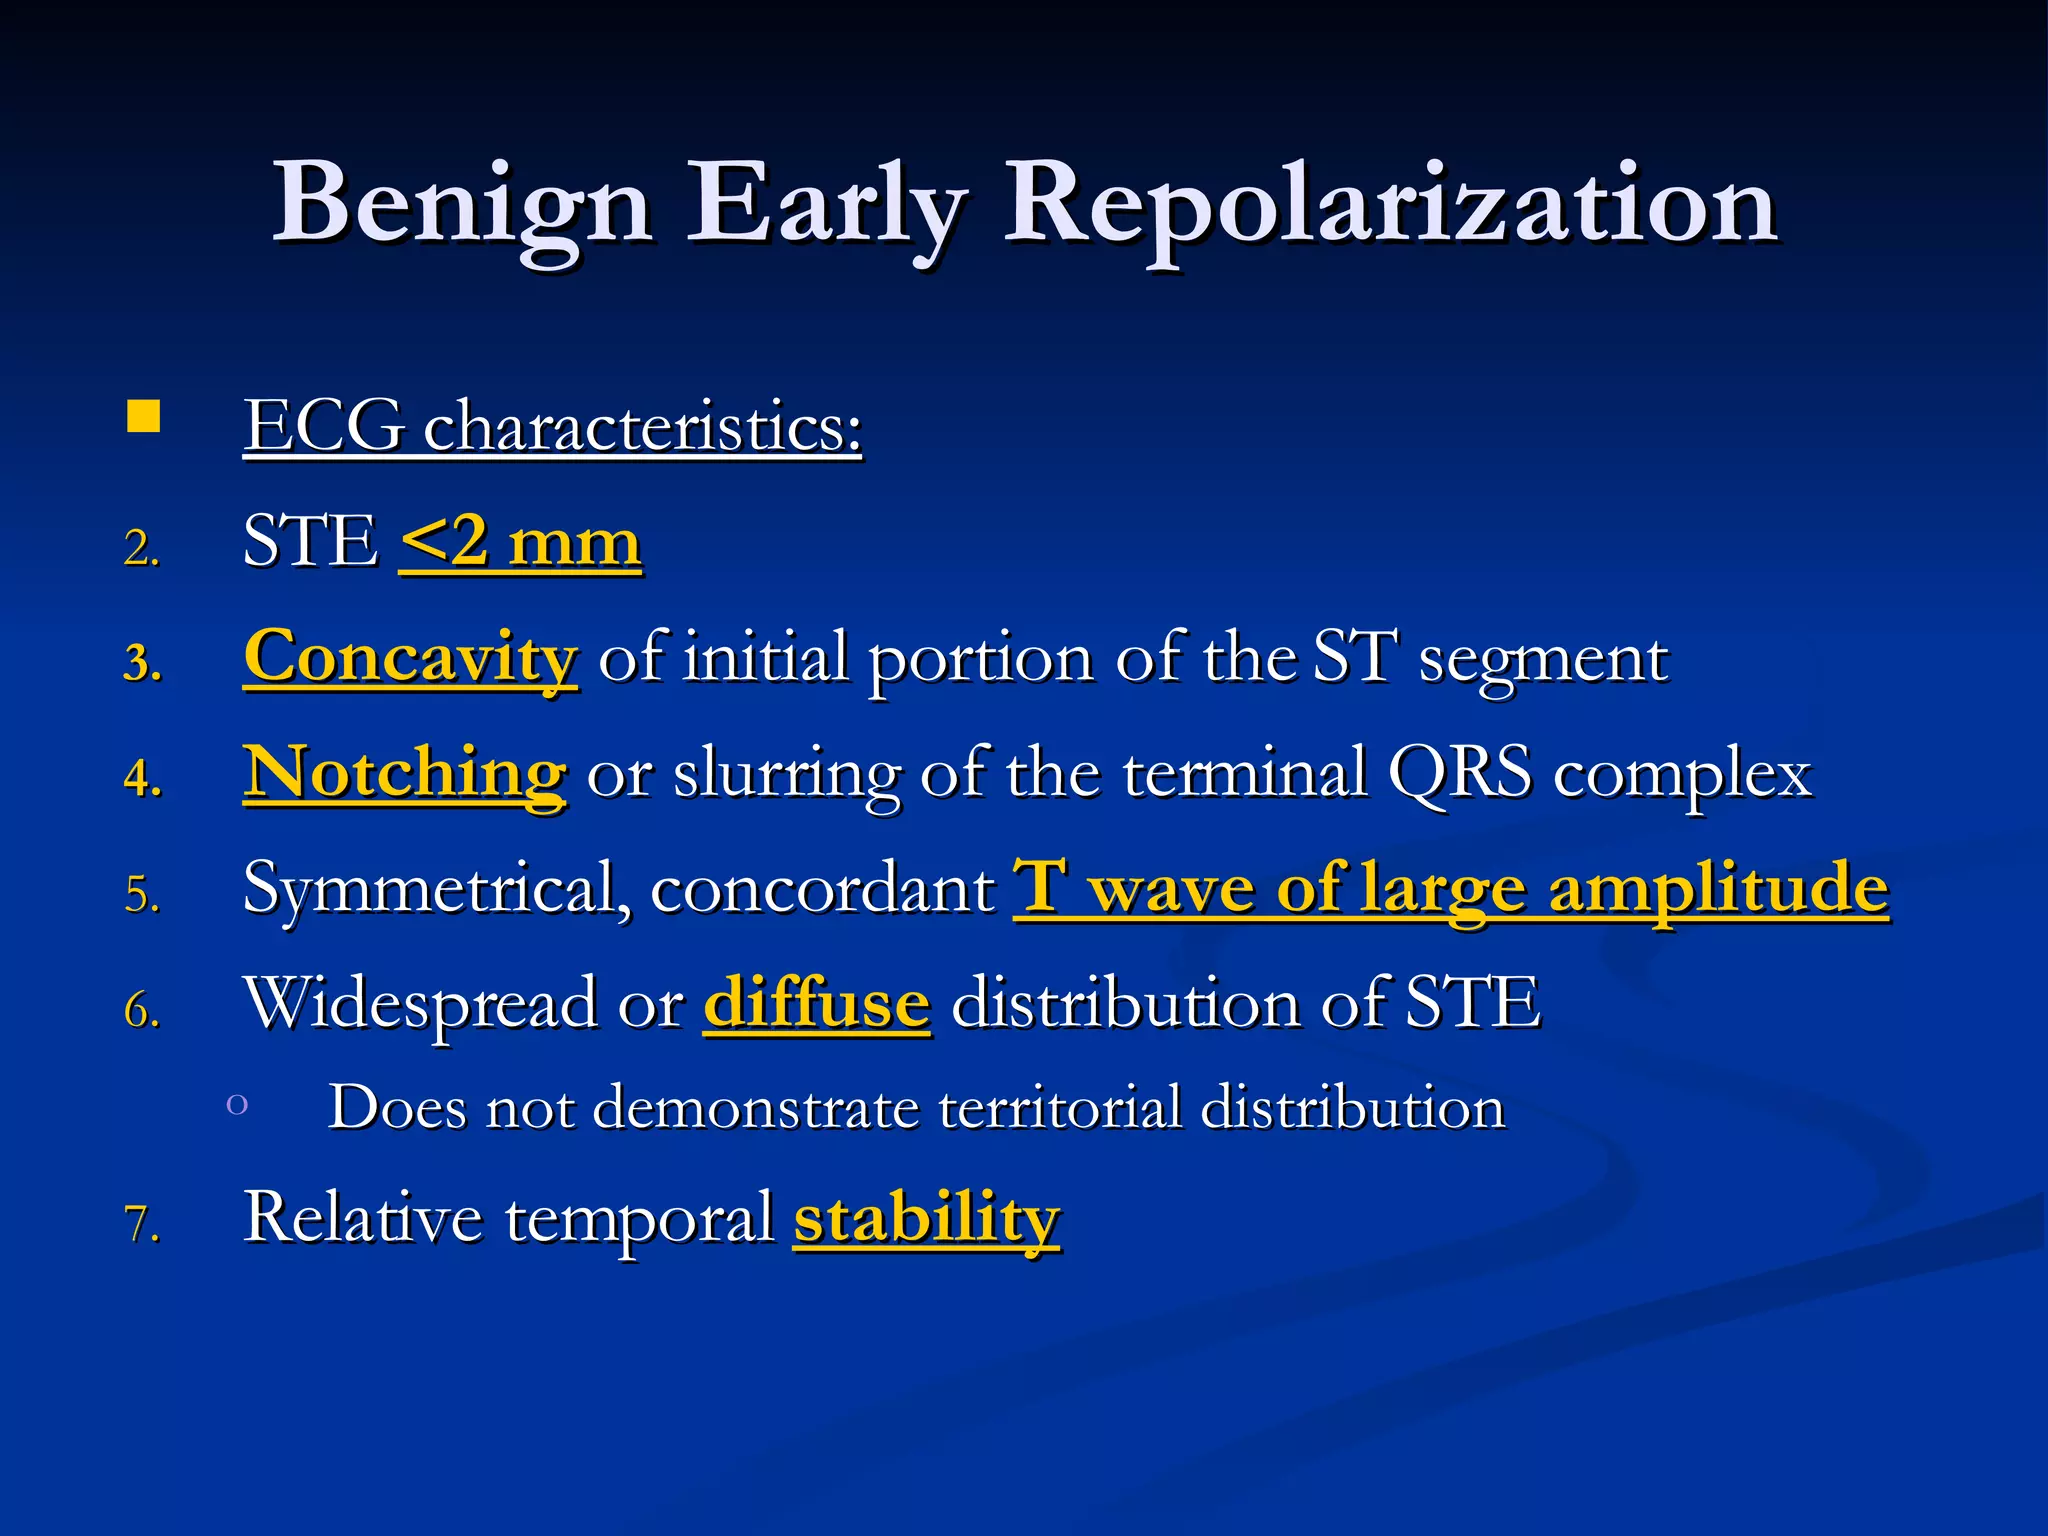
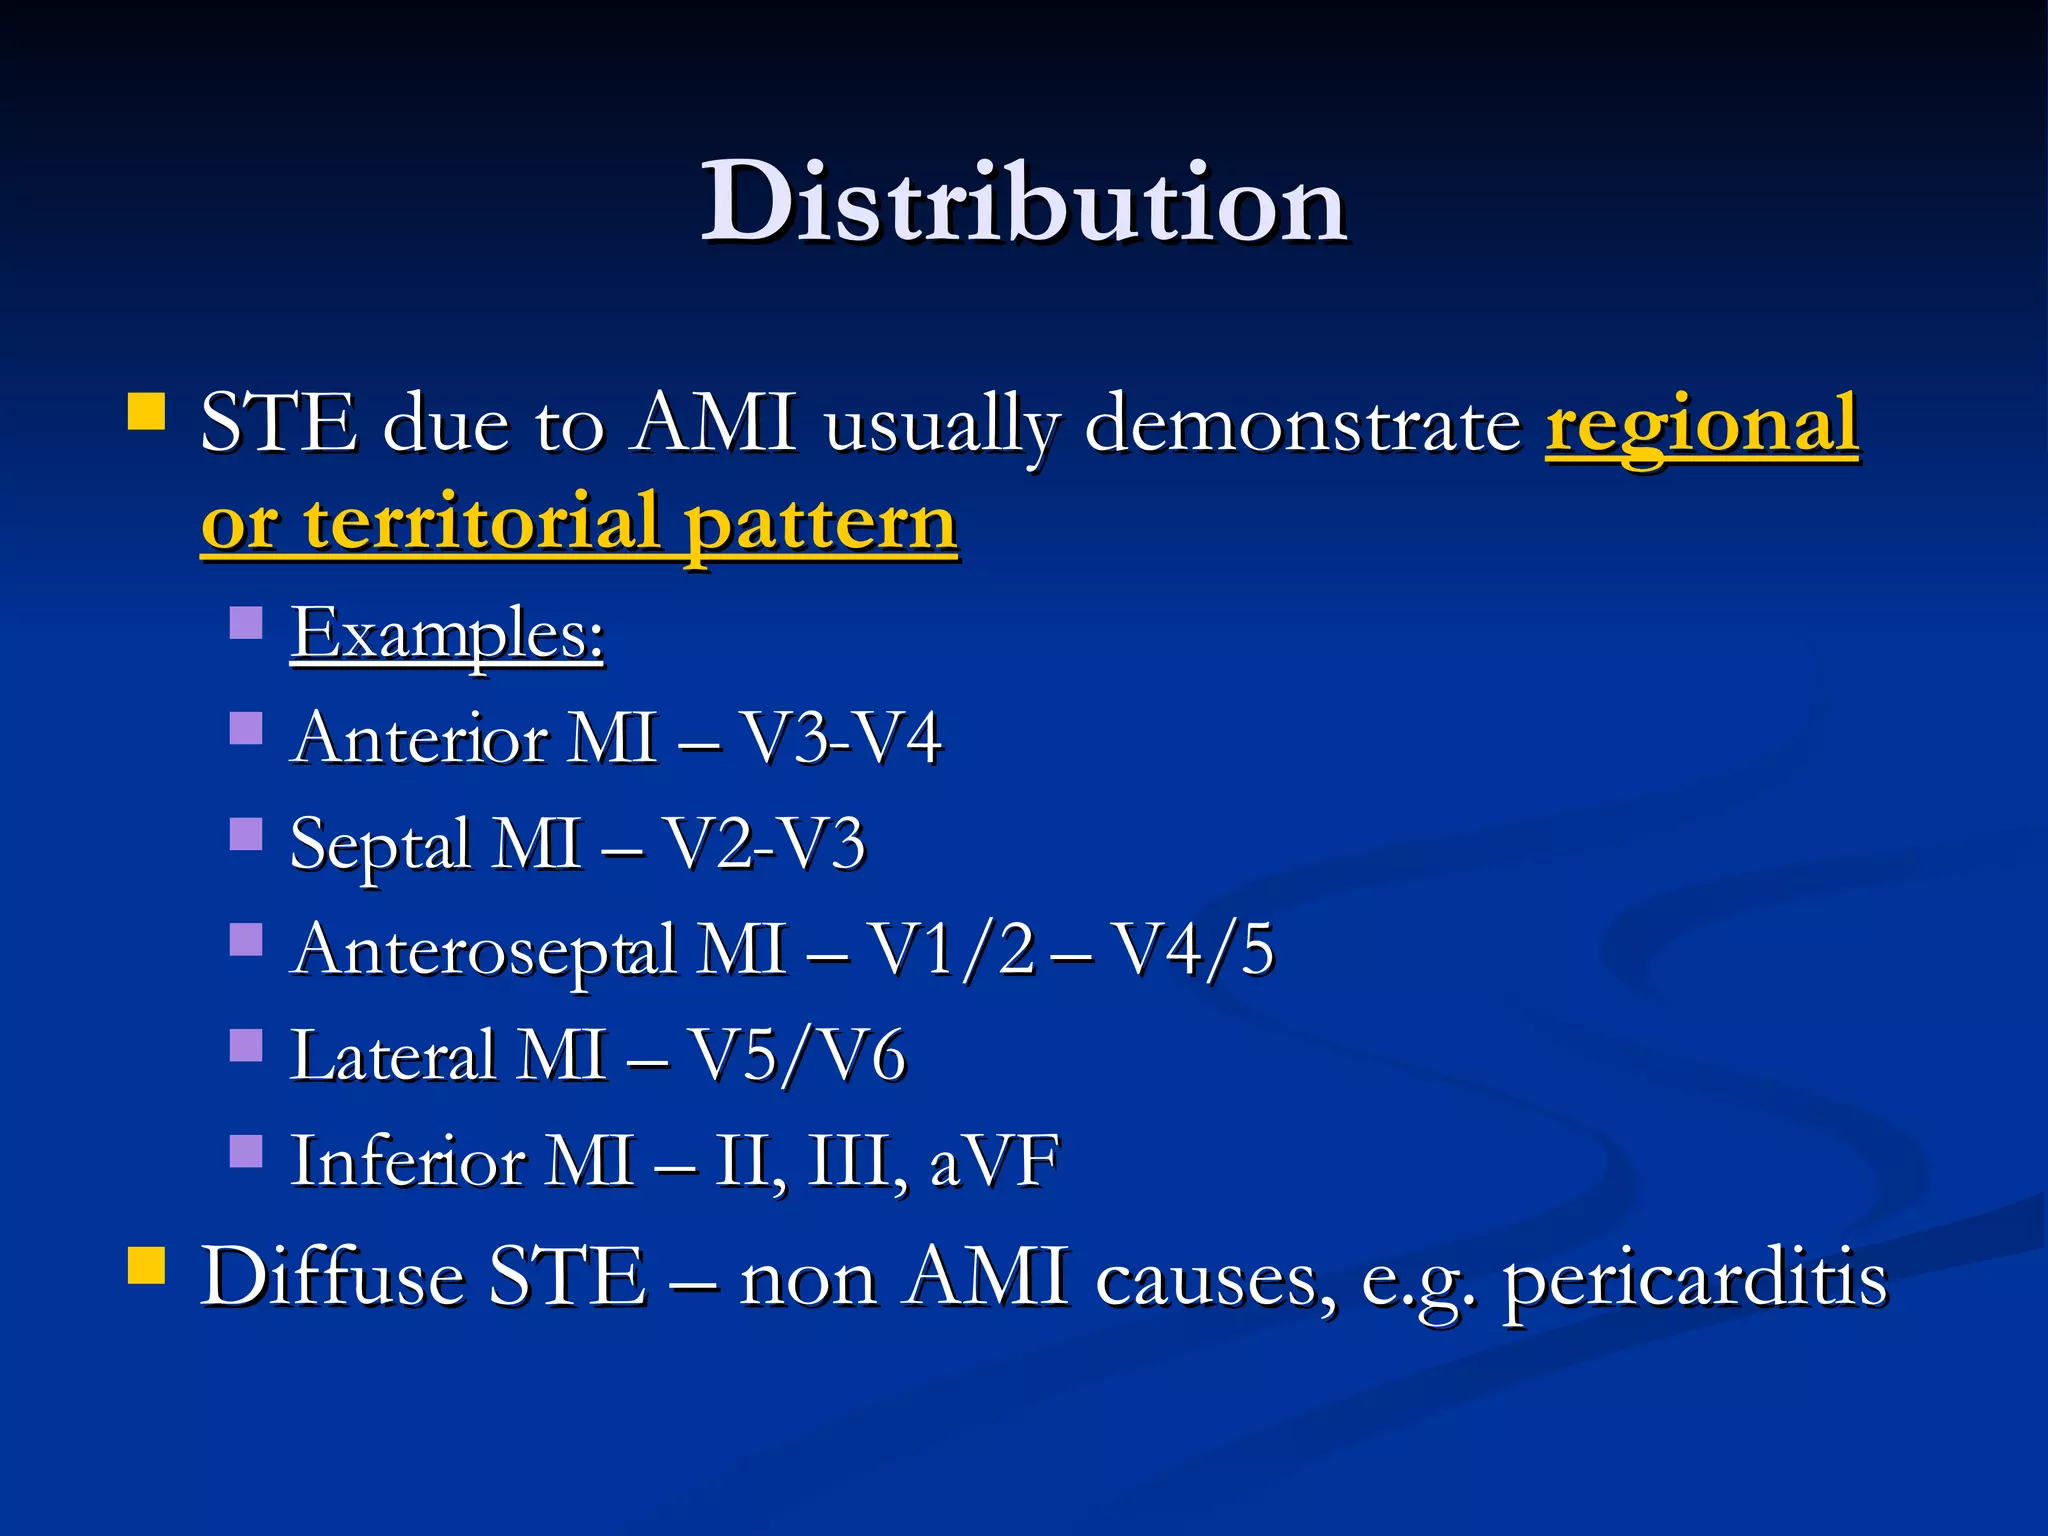
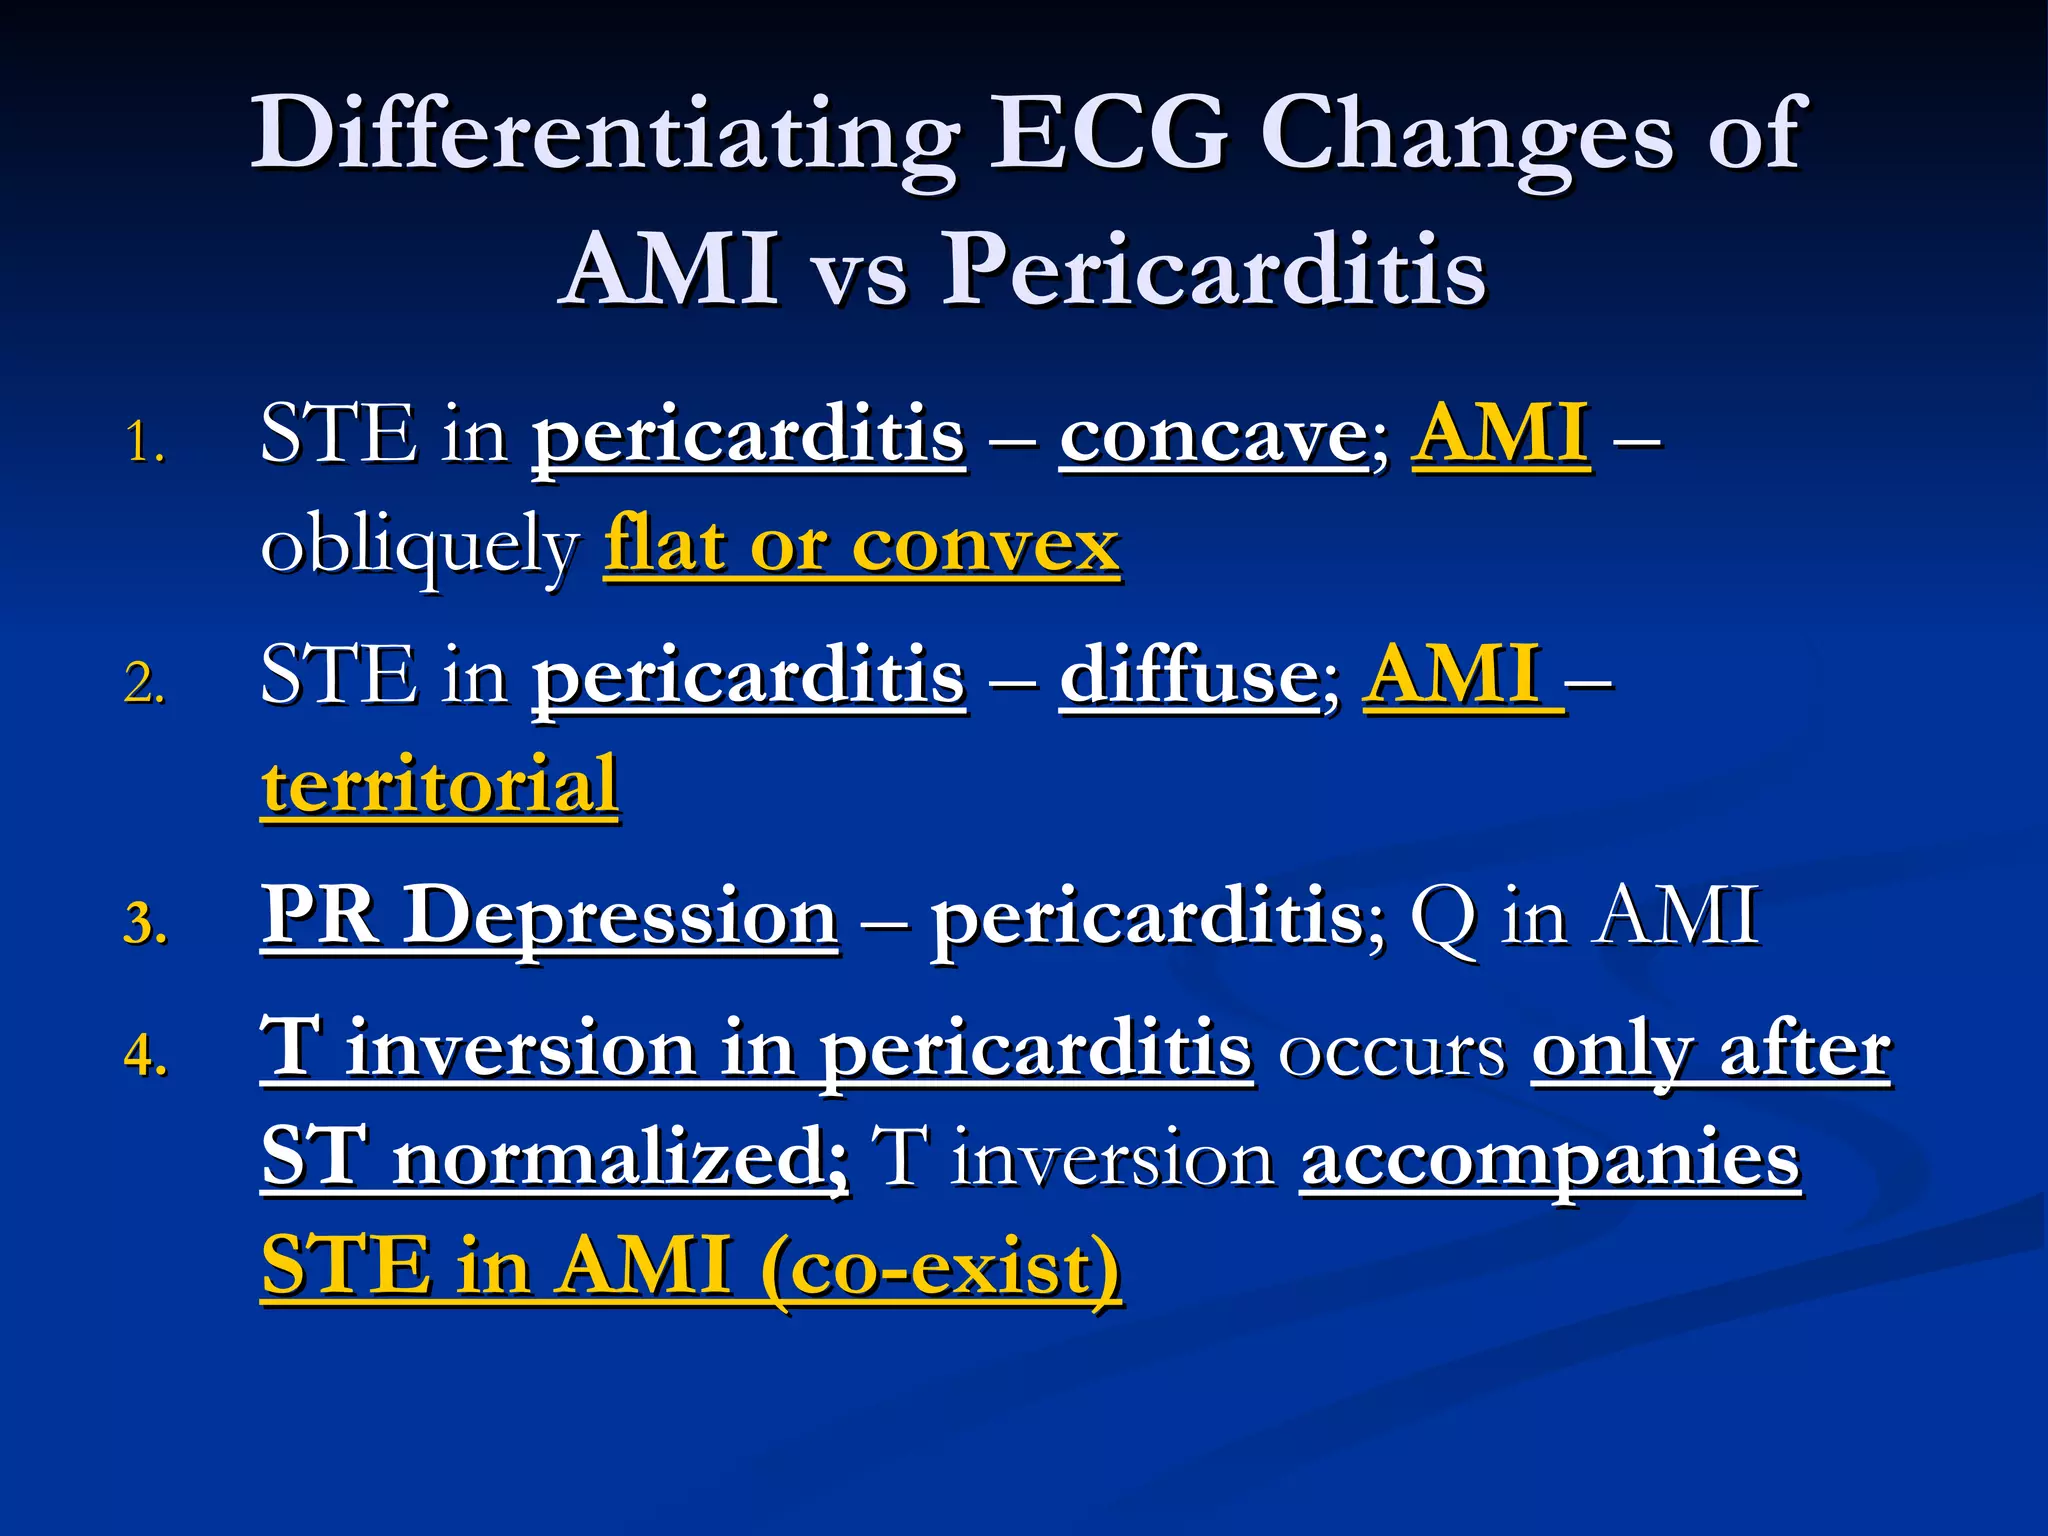
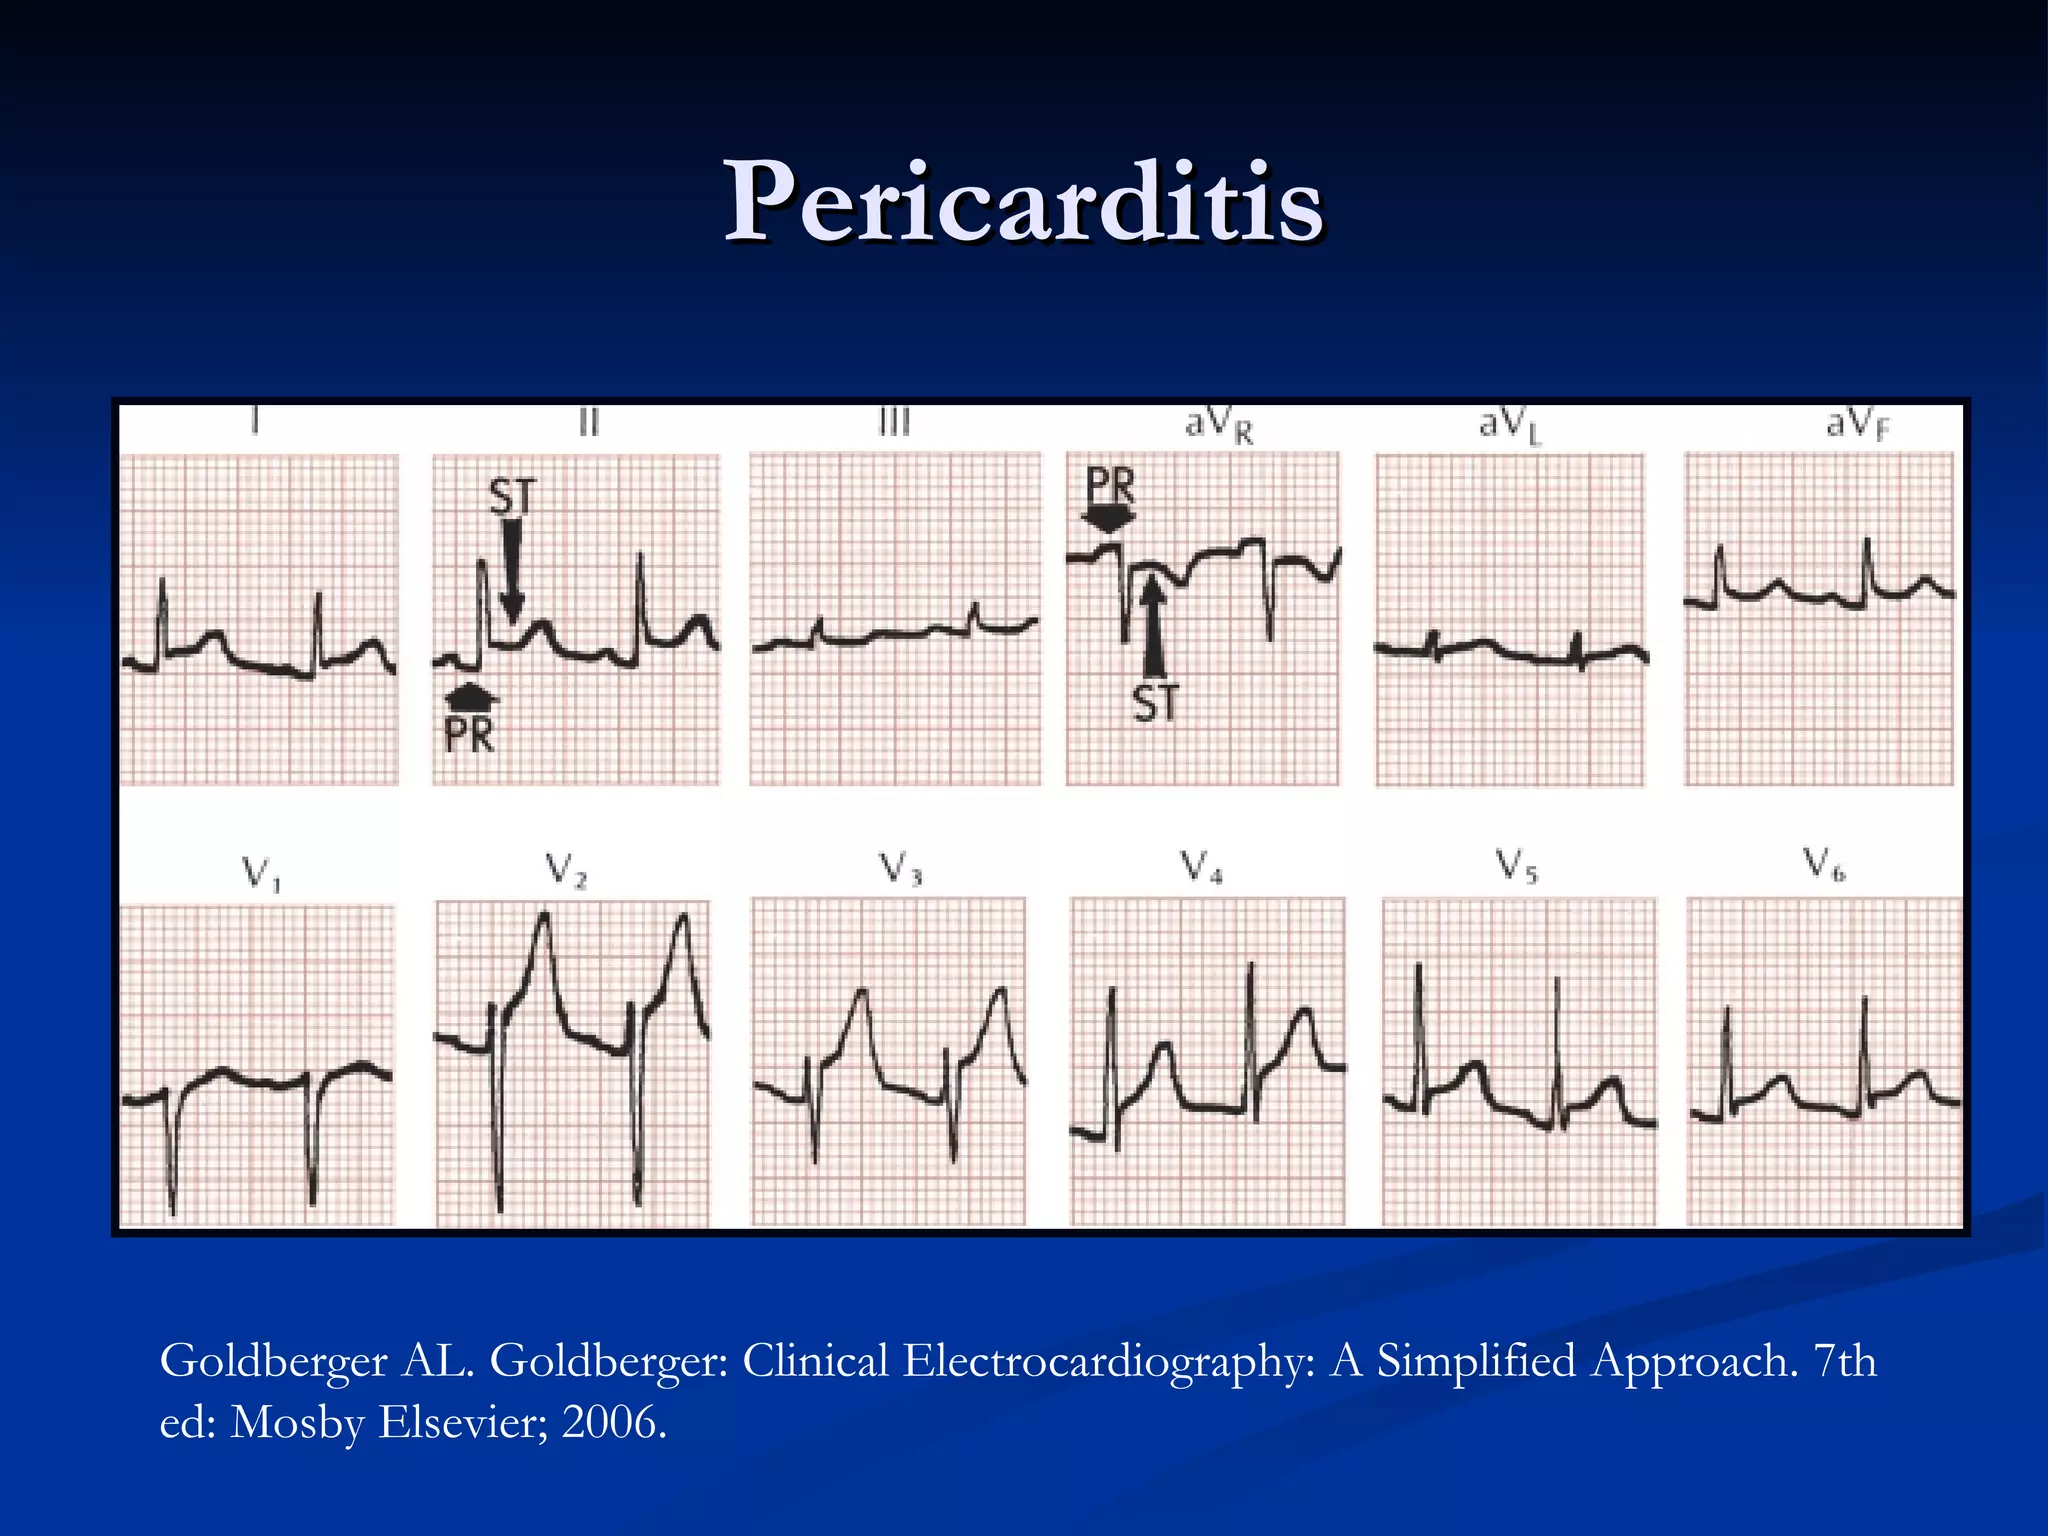
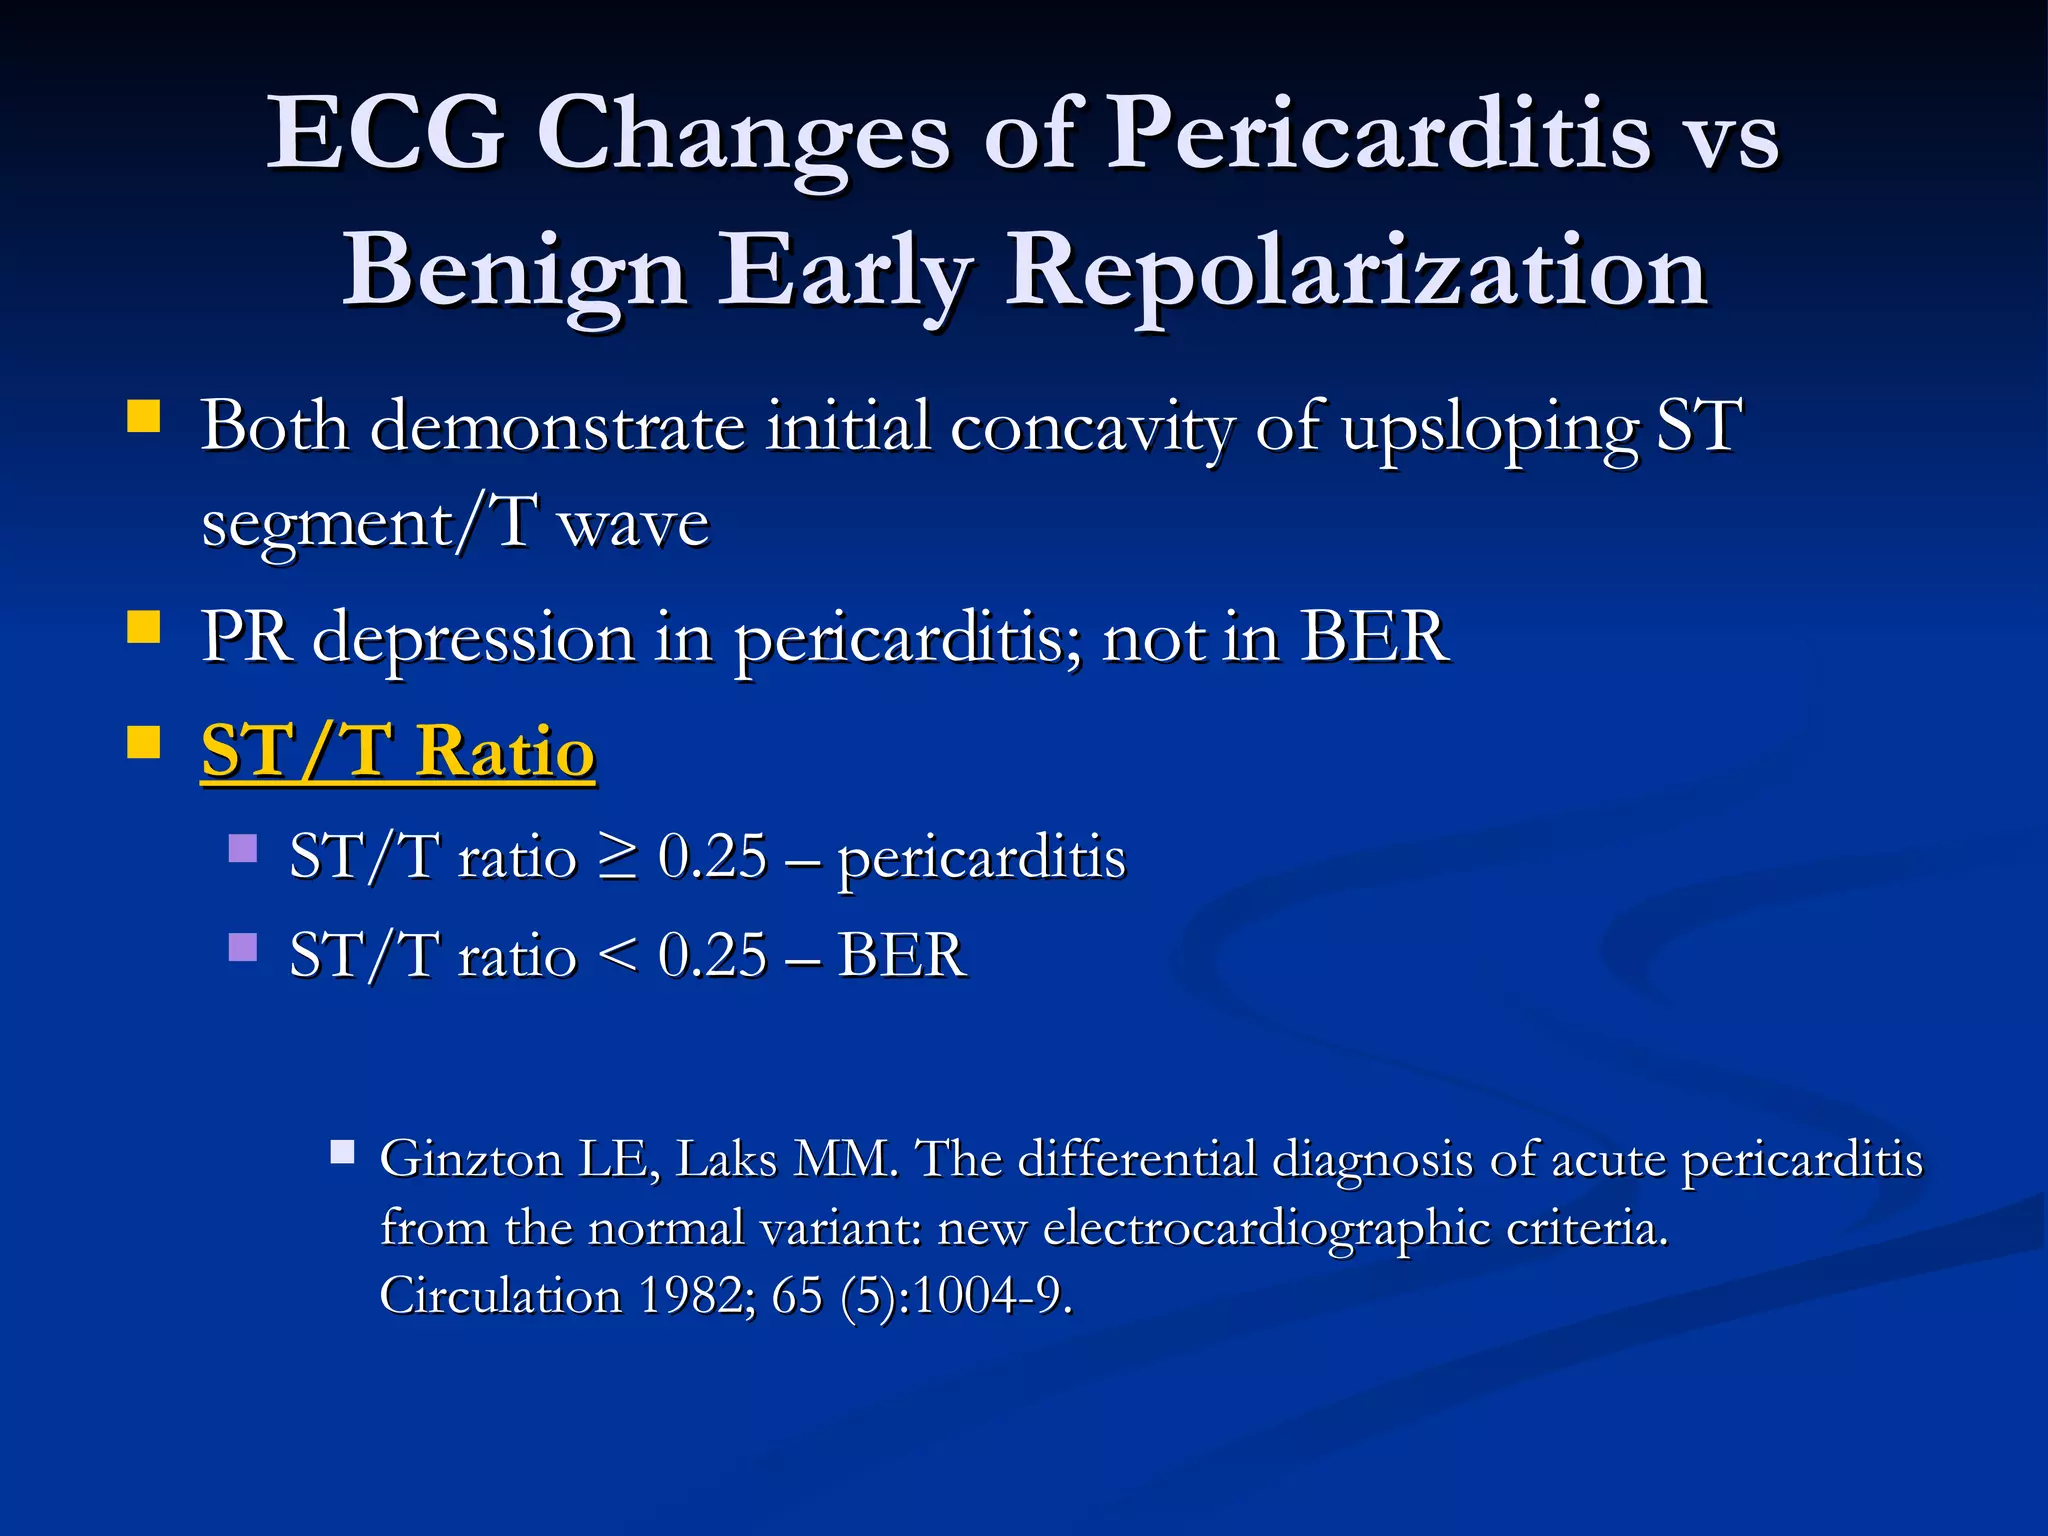
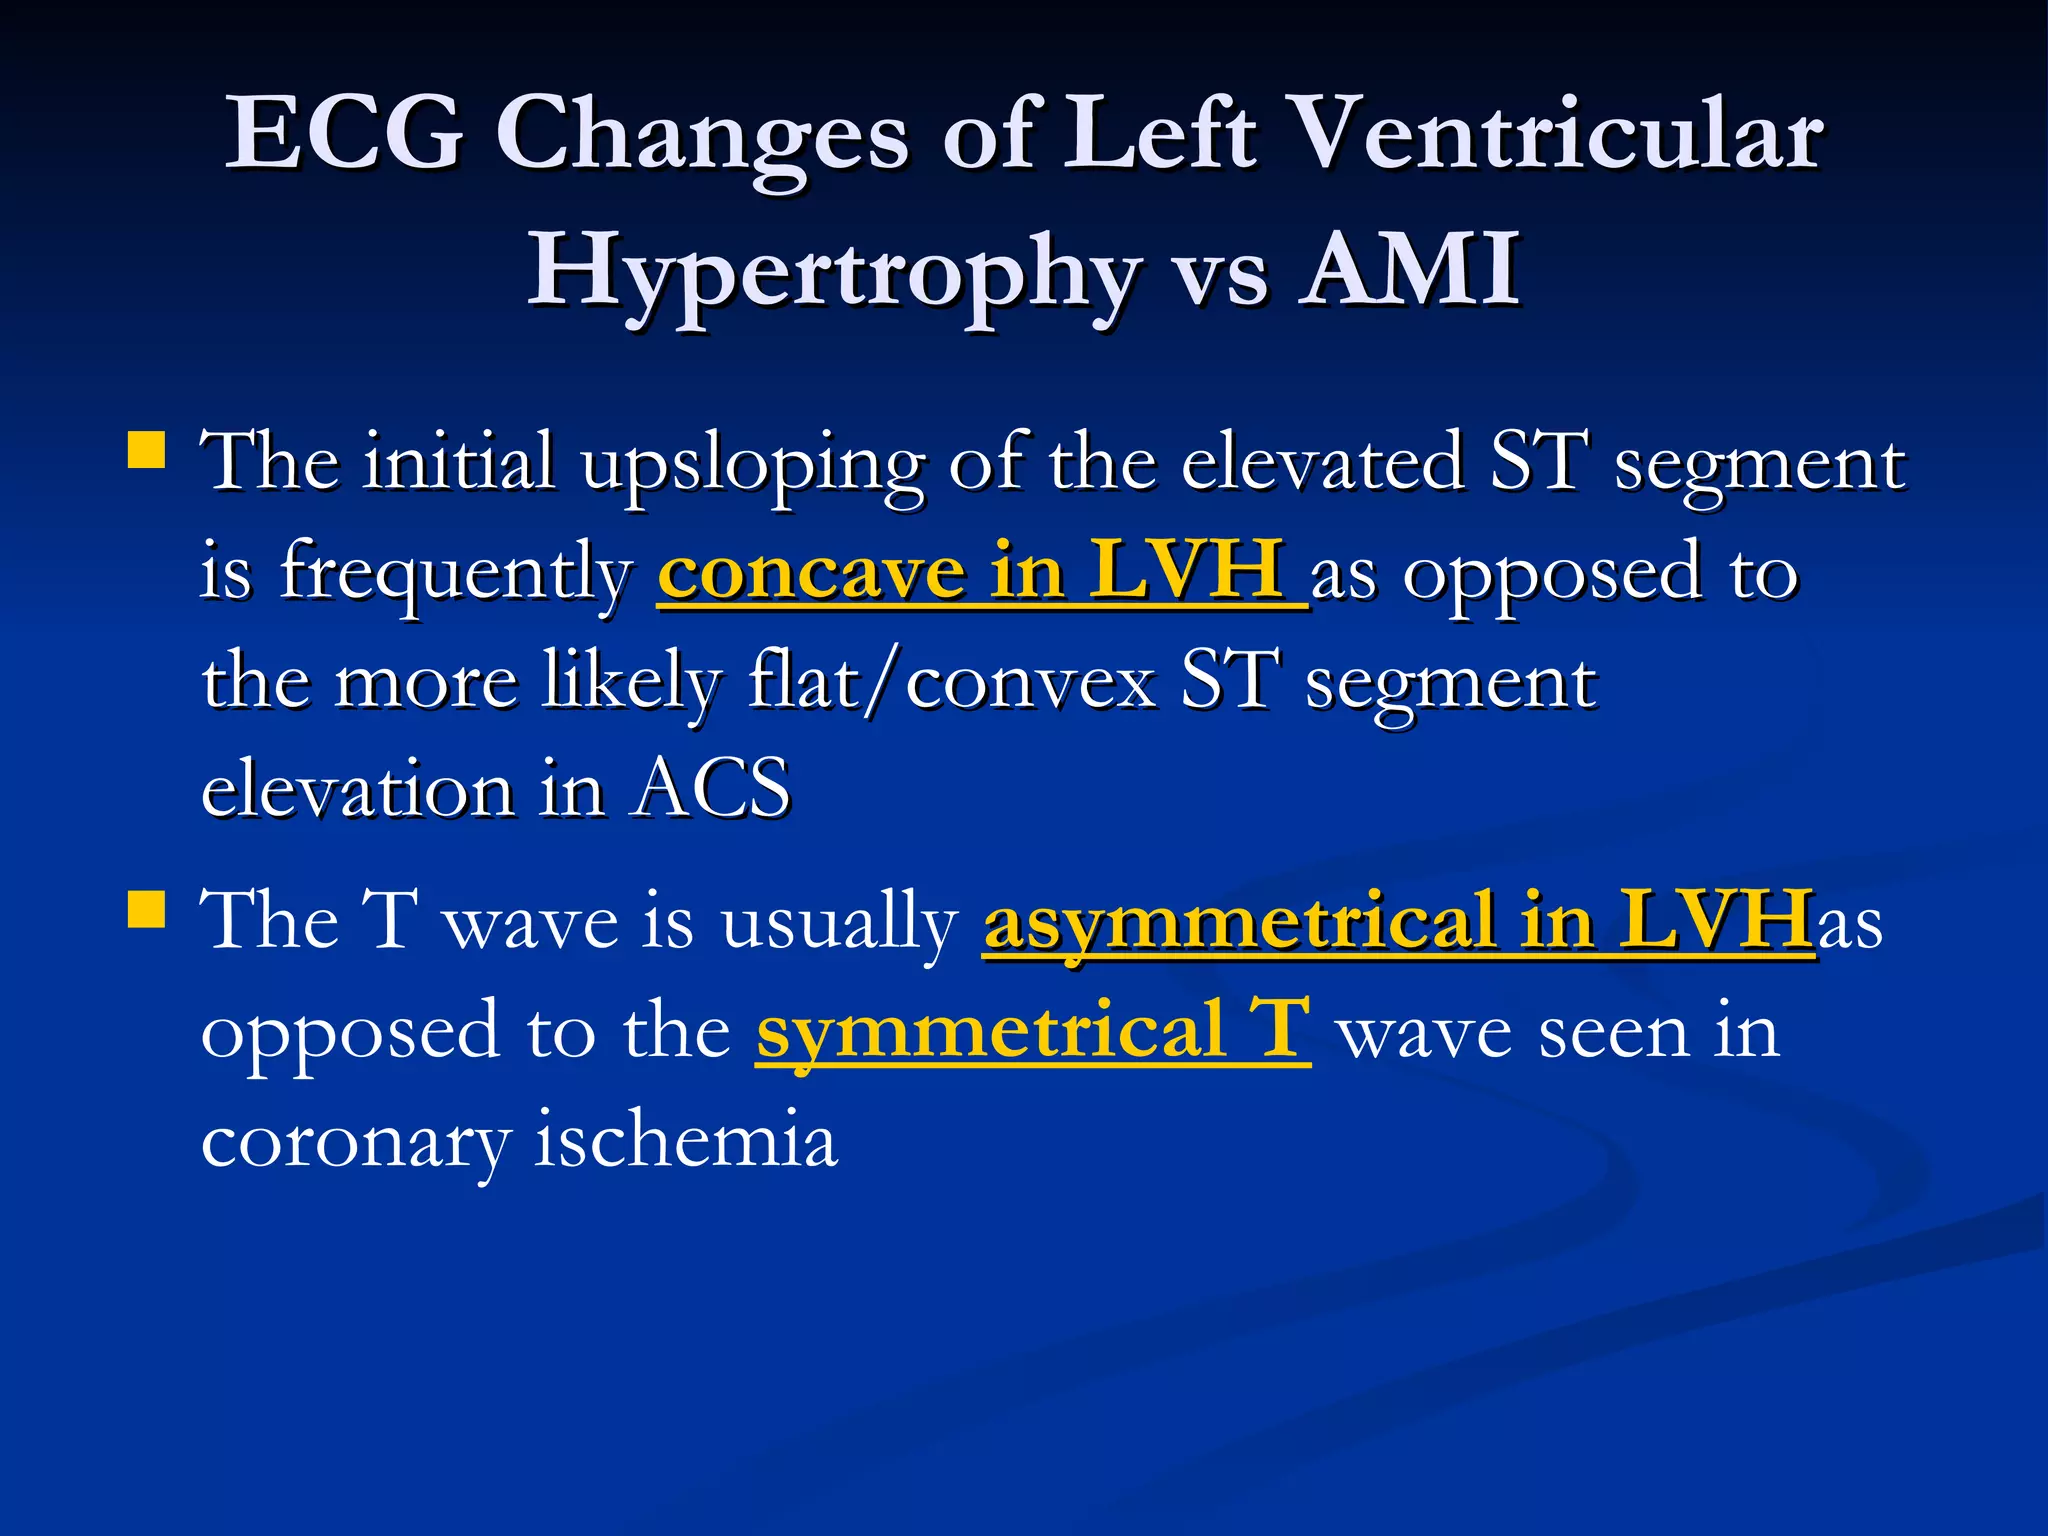
Methods to distinguish between AMI and other conditions like pericarditis, focusing on changes in morphology and wave patterns.
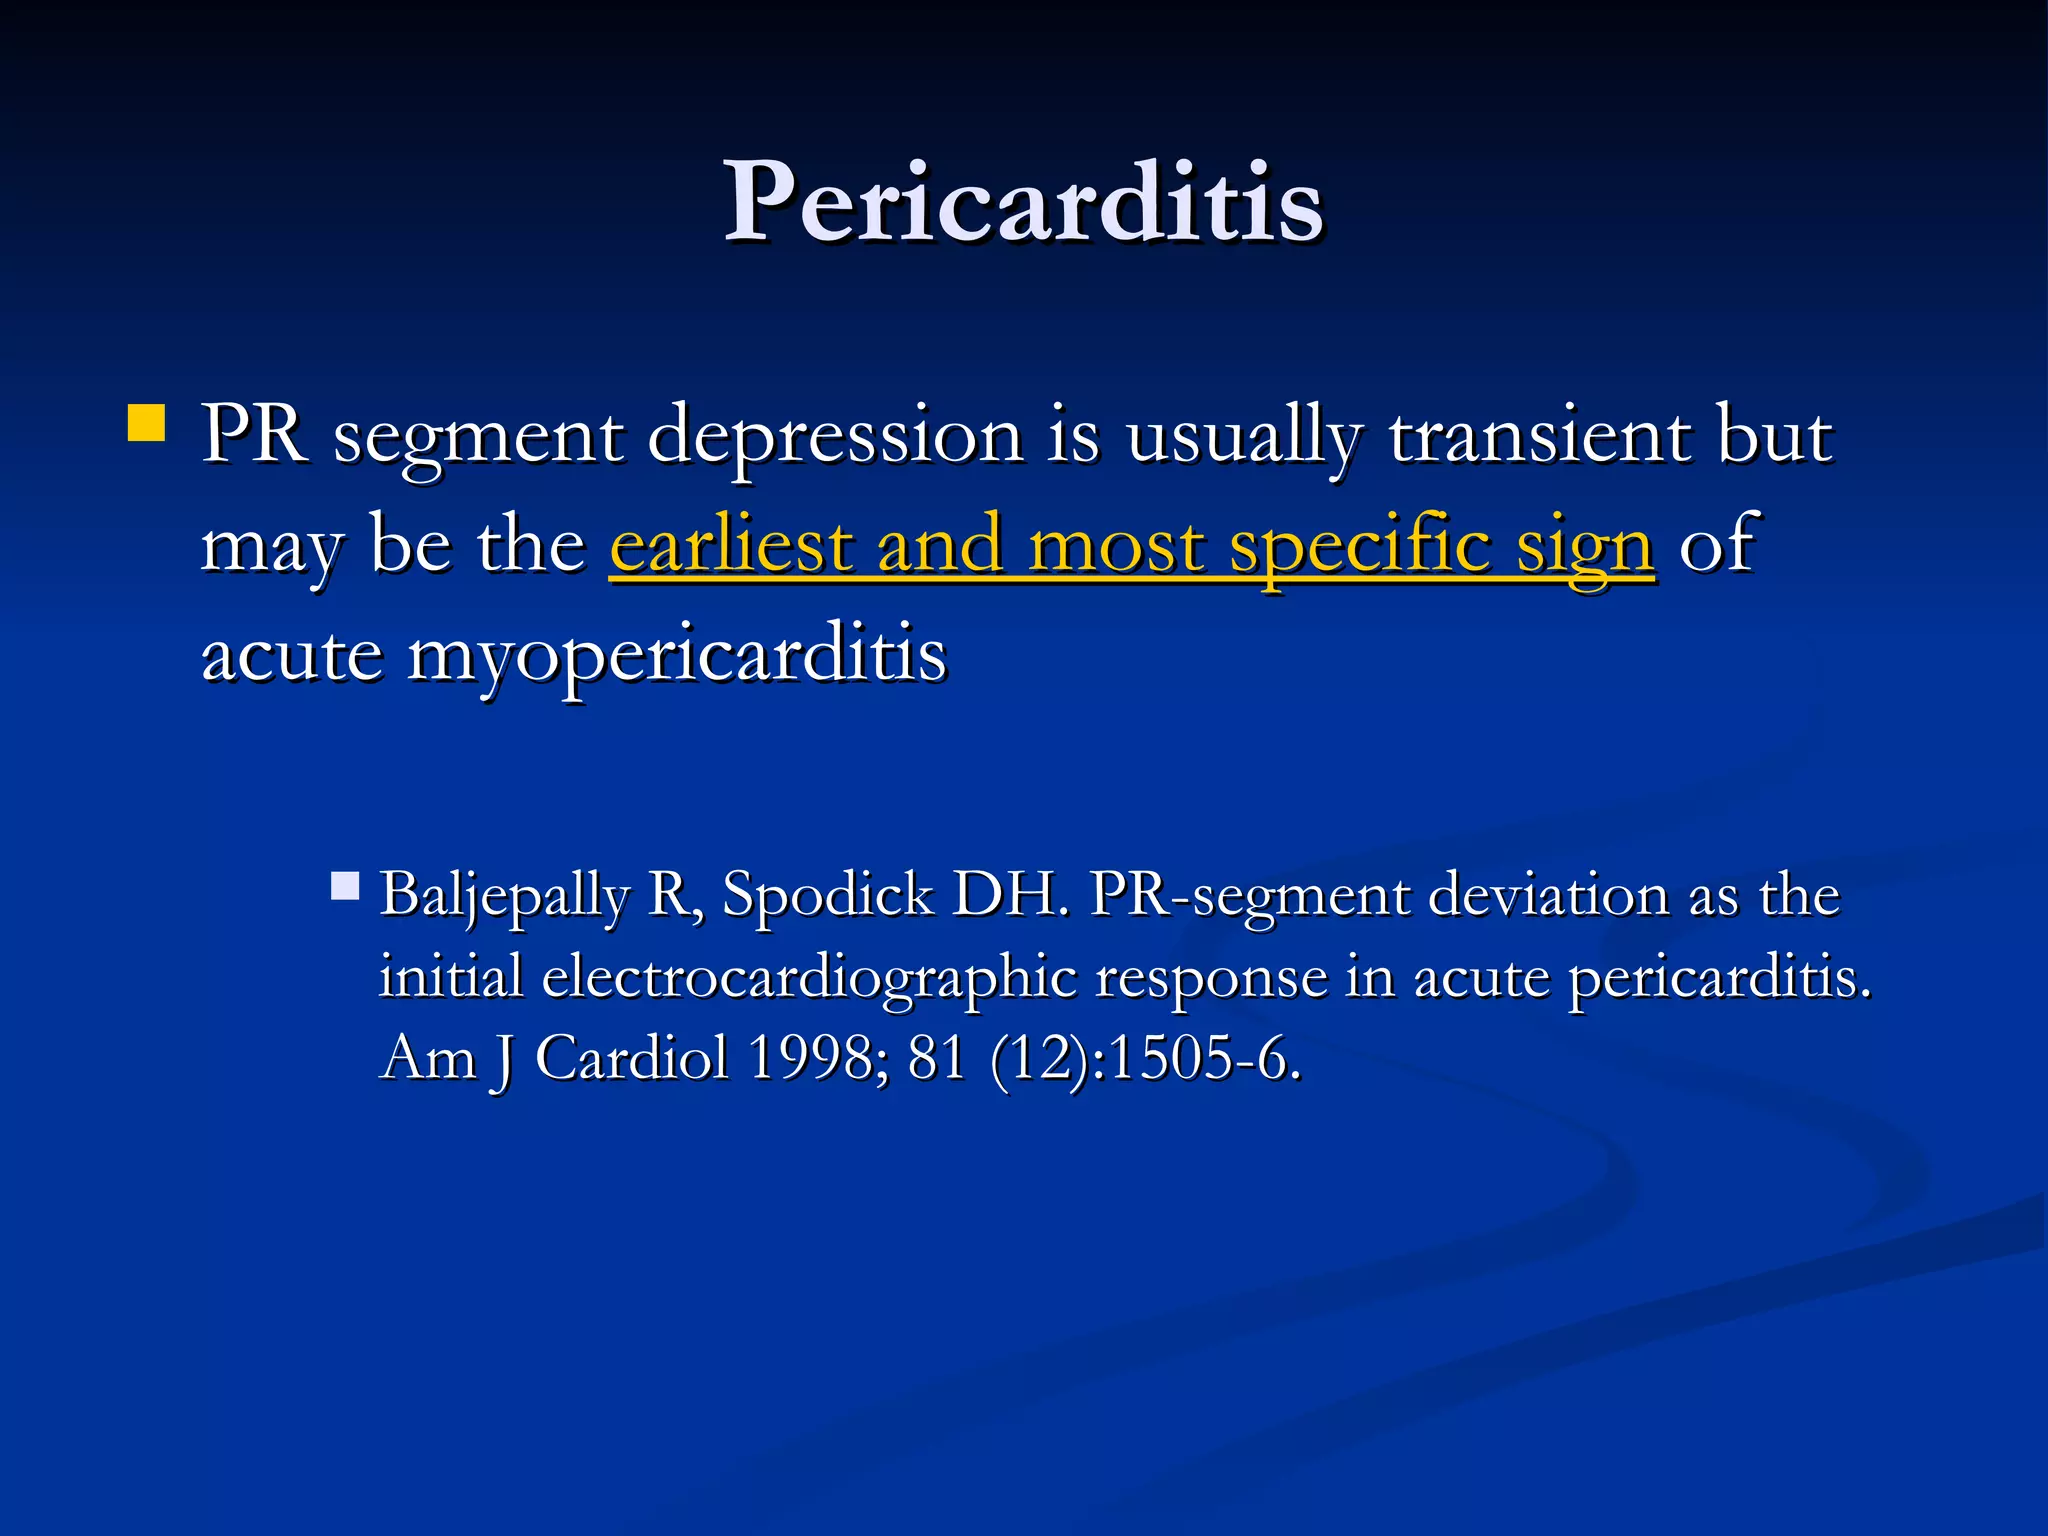
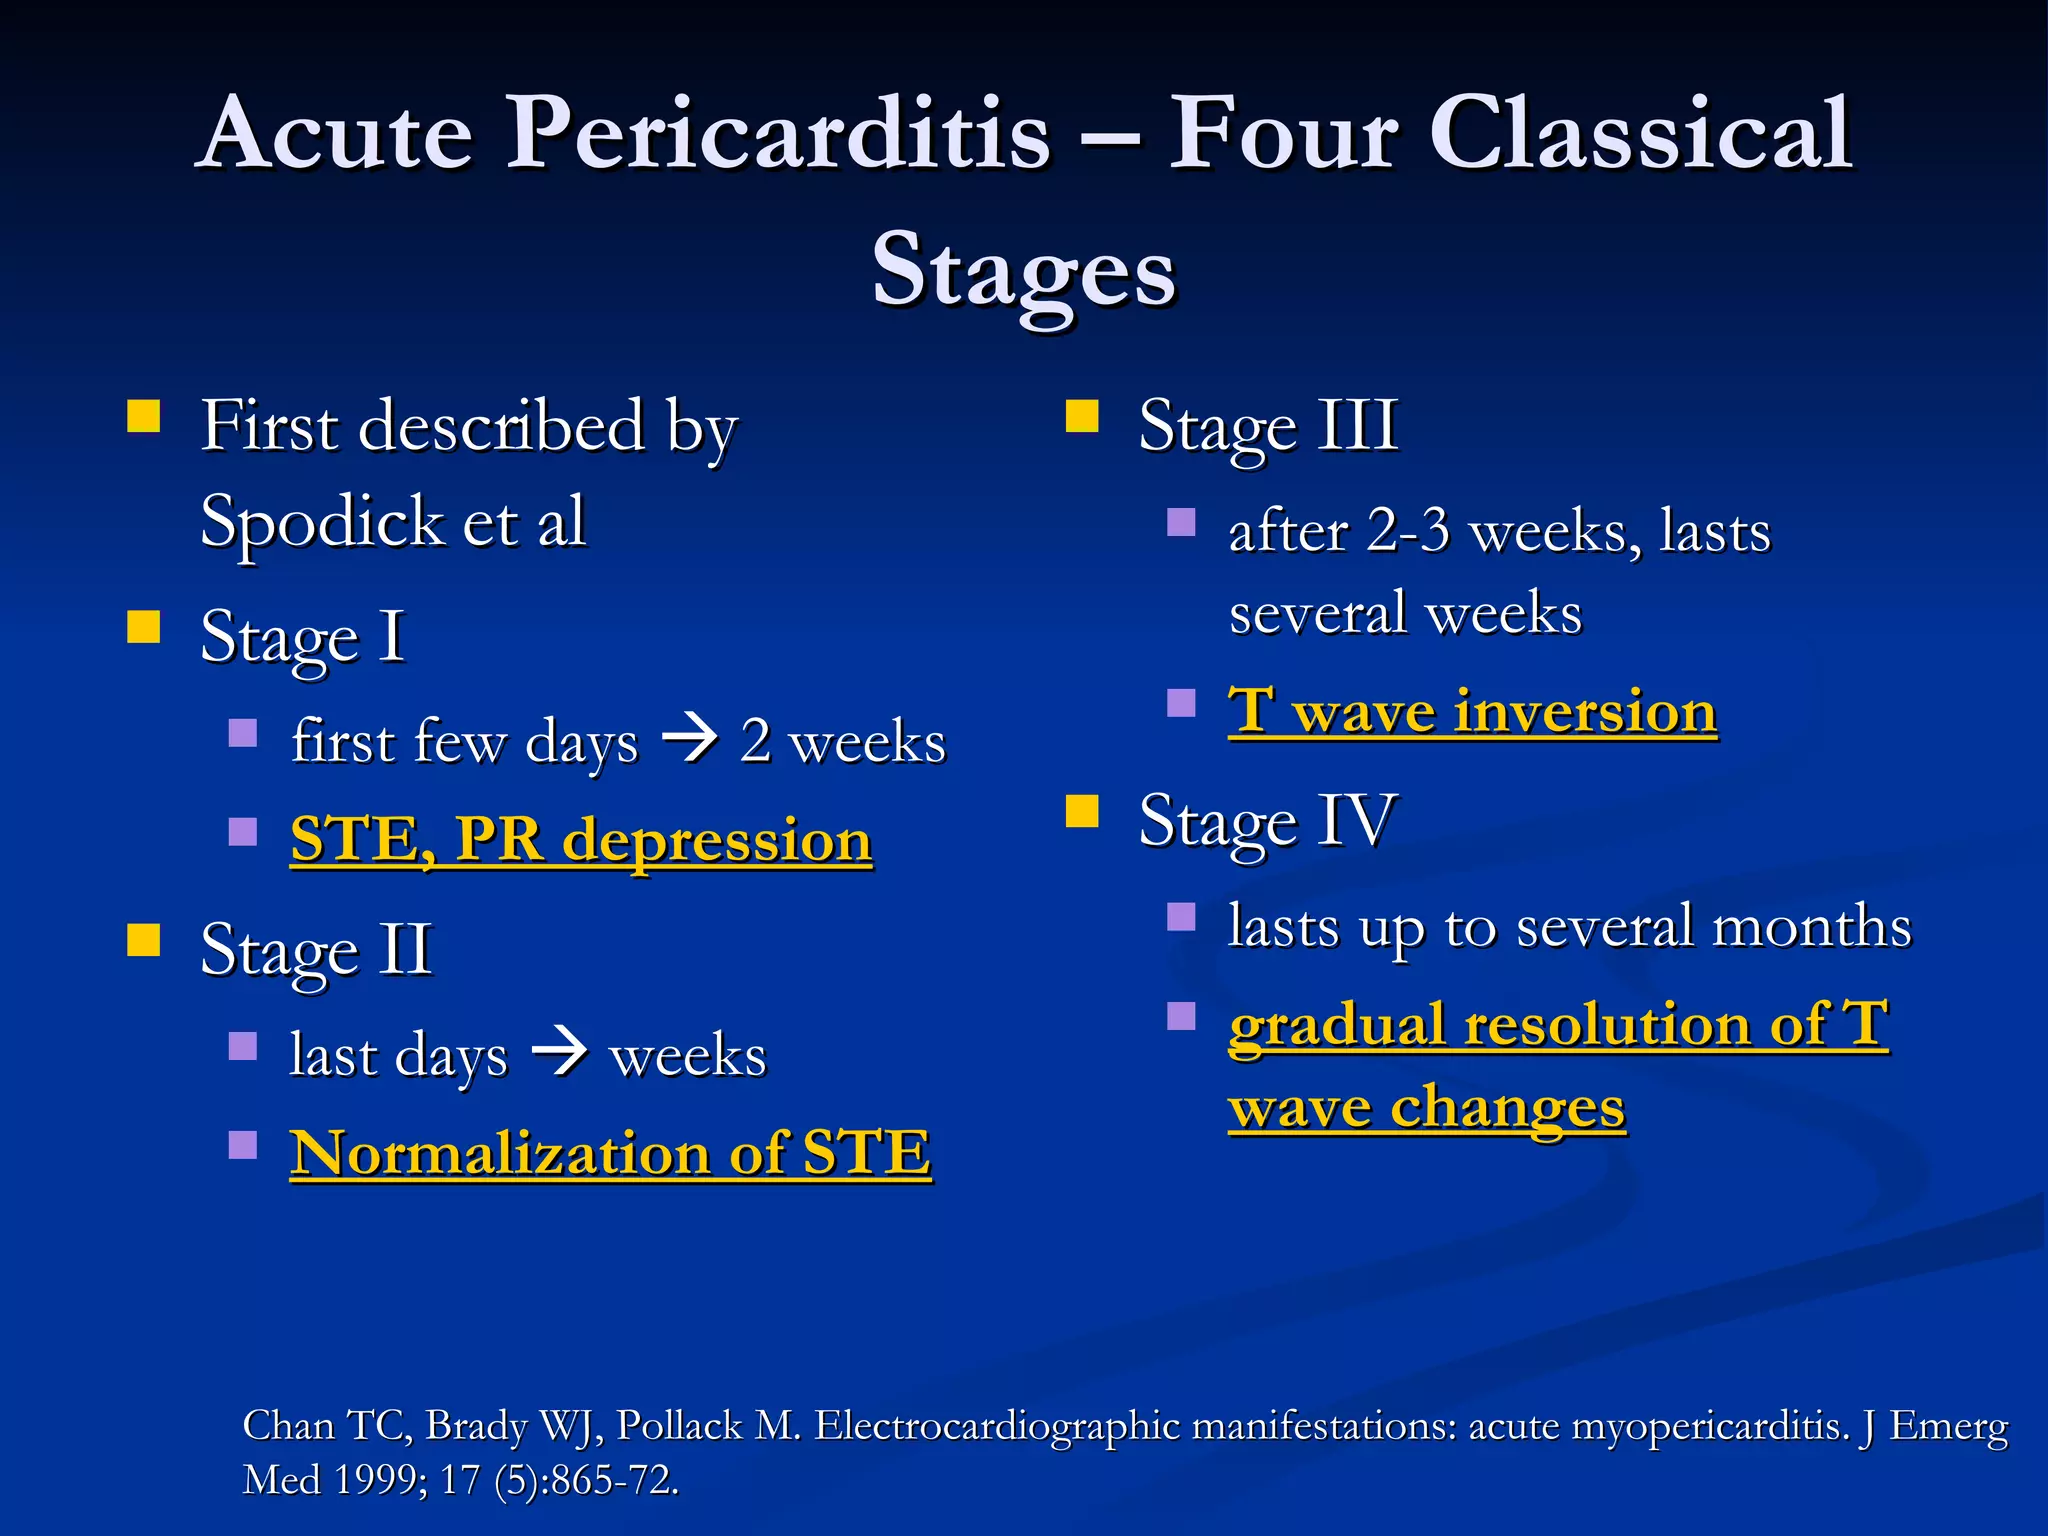
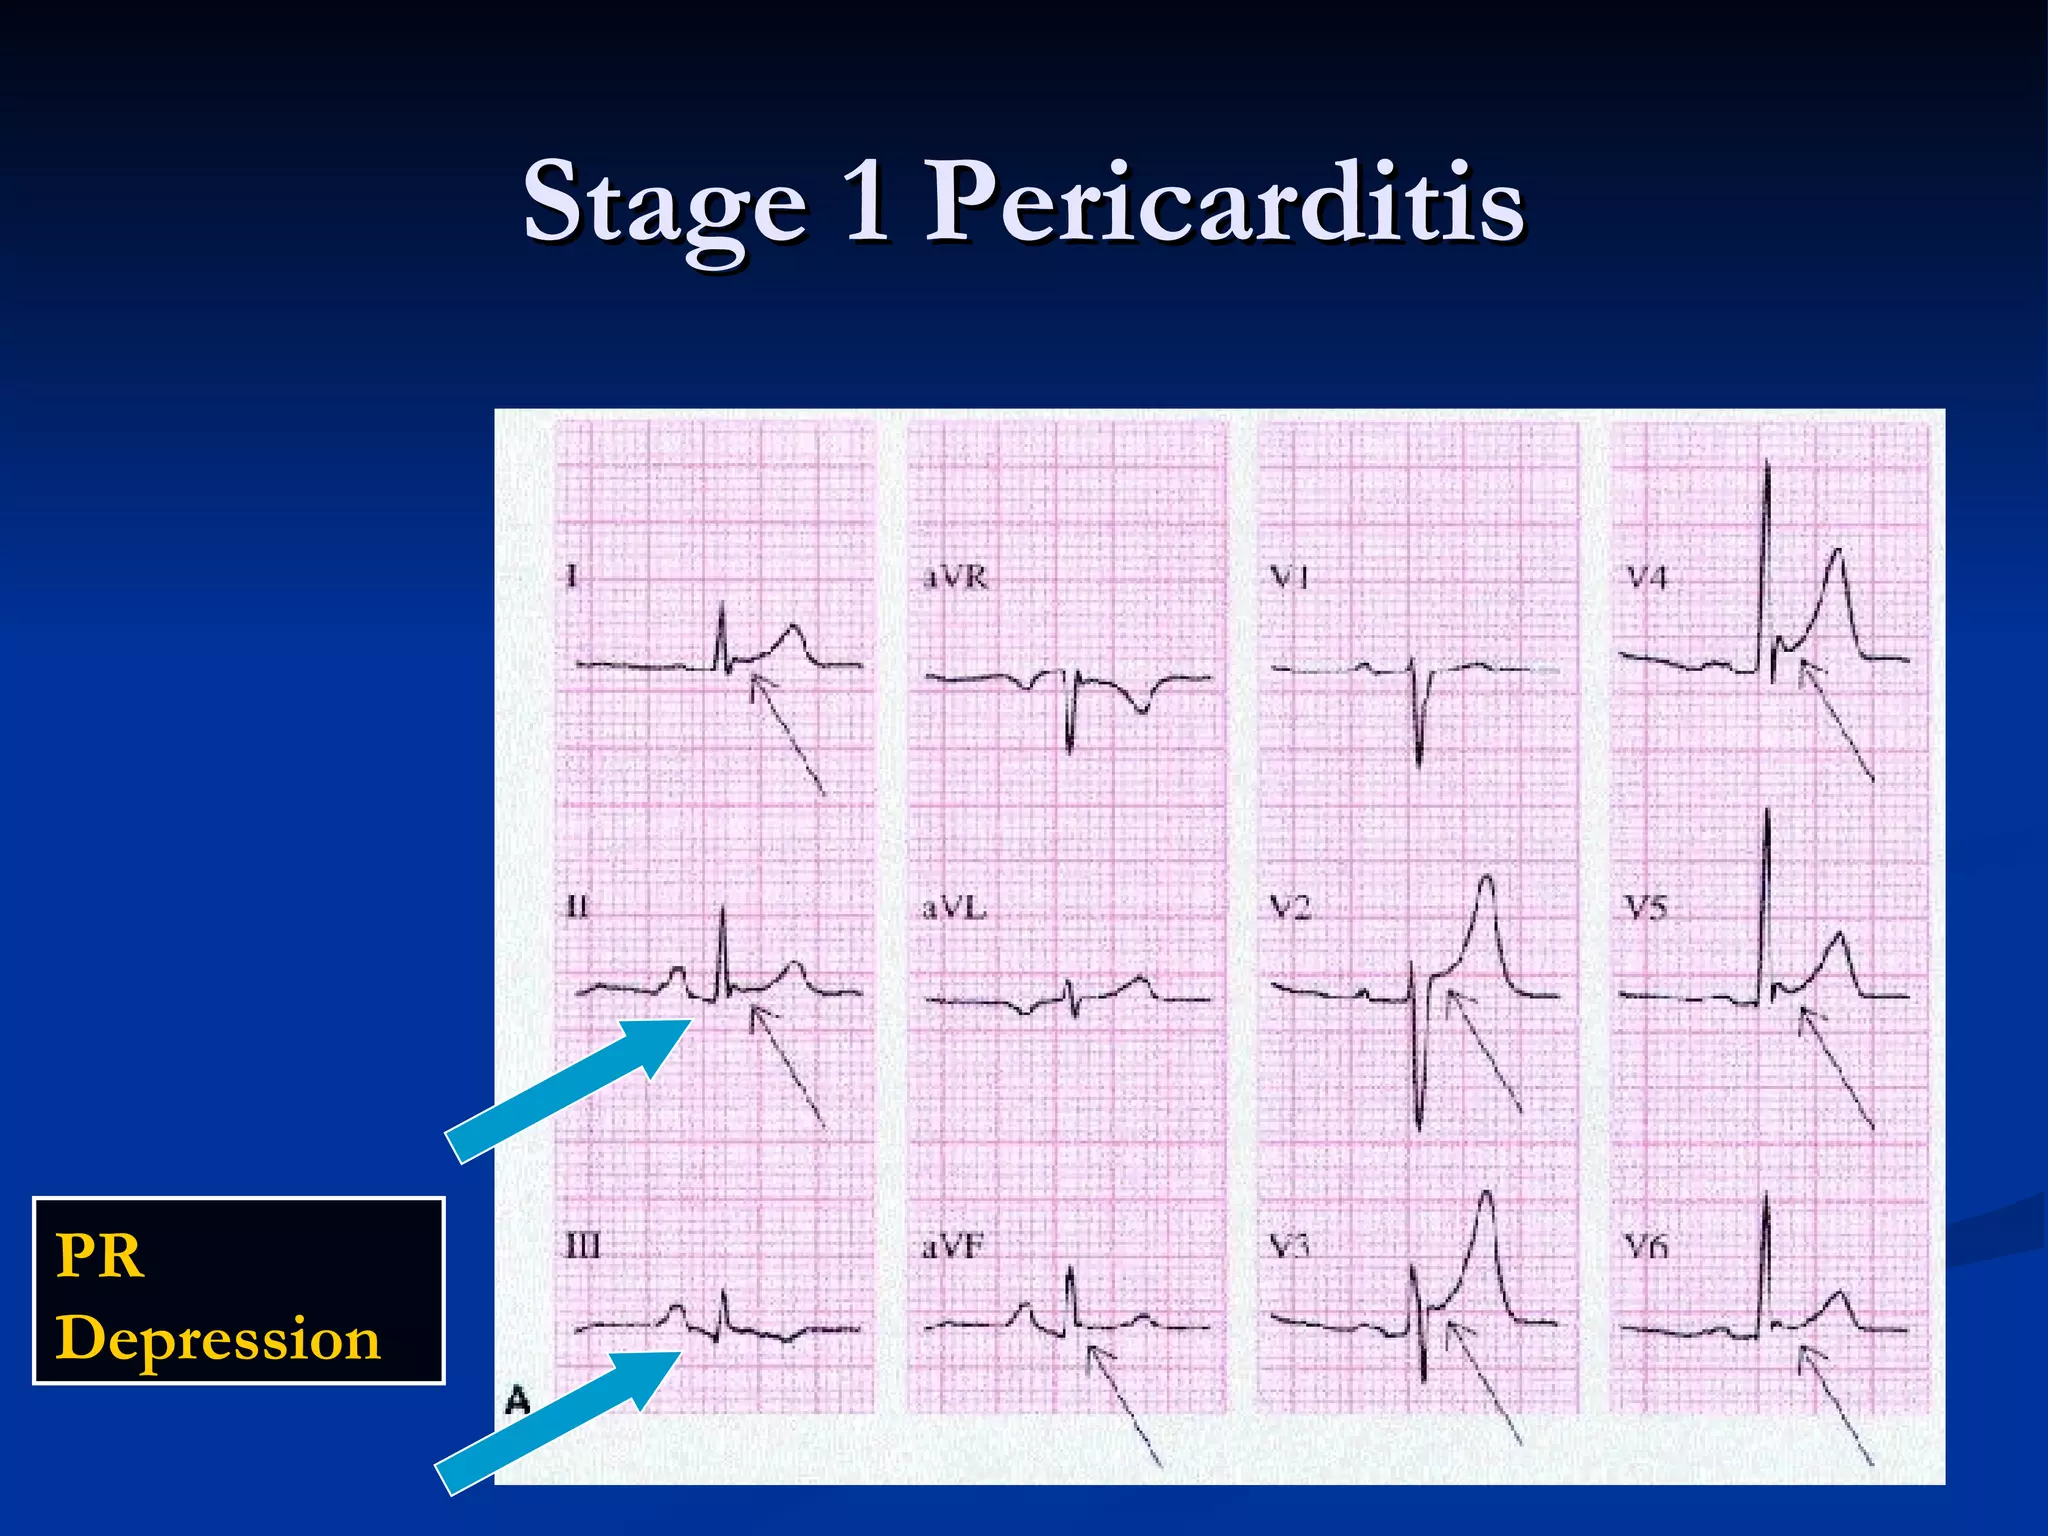
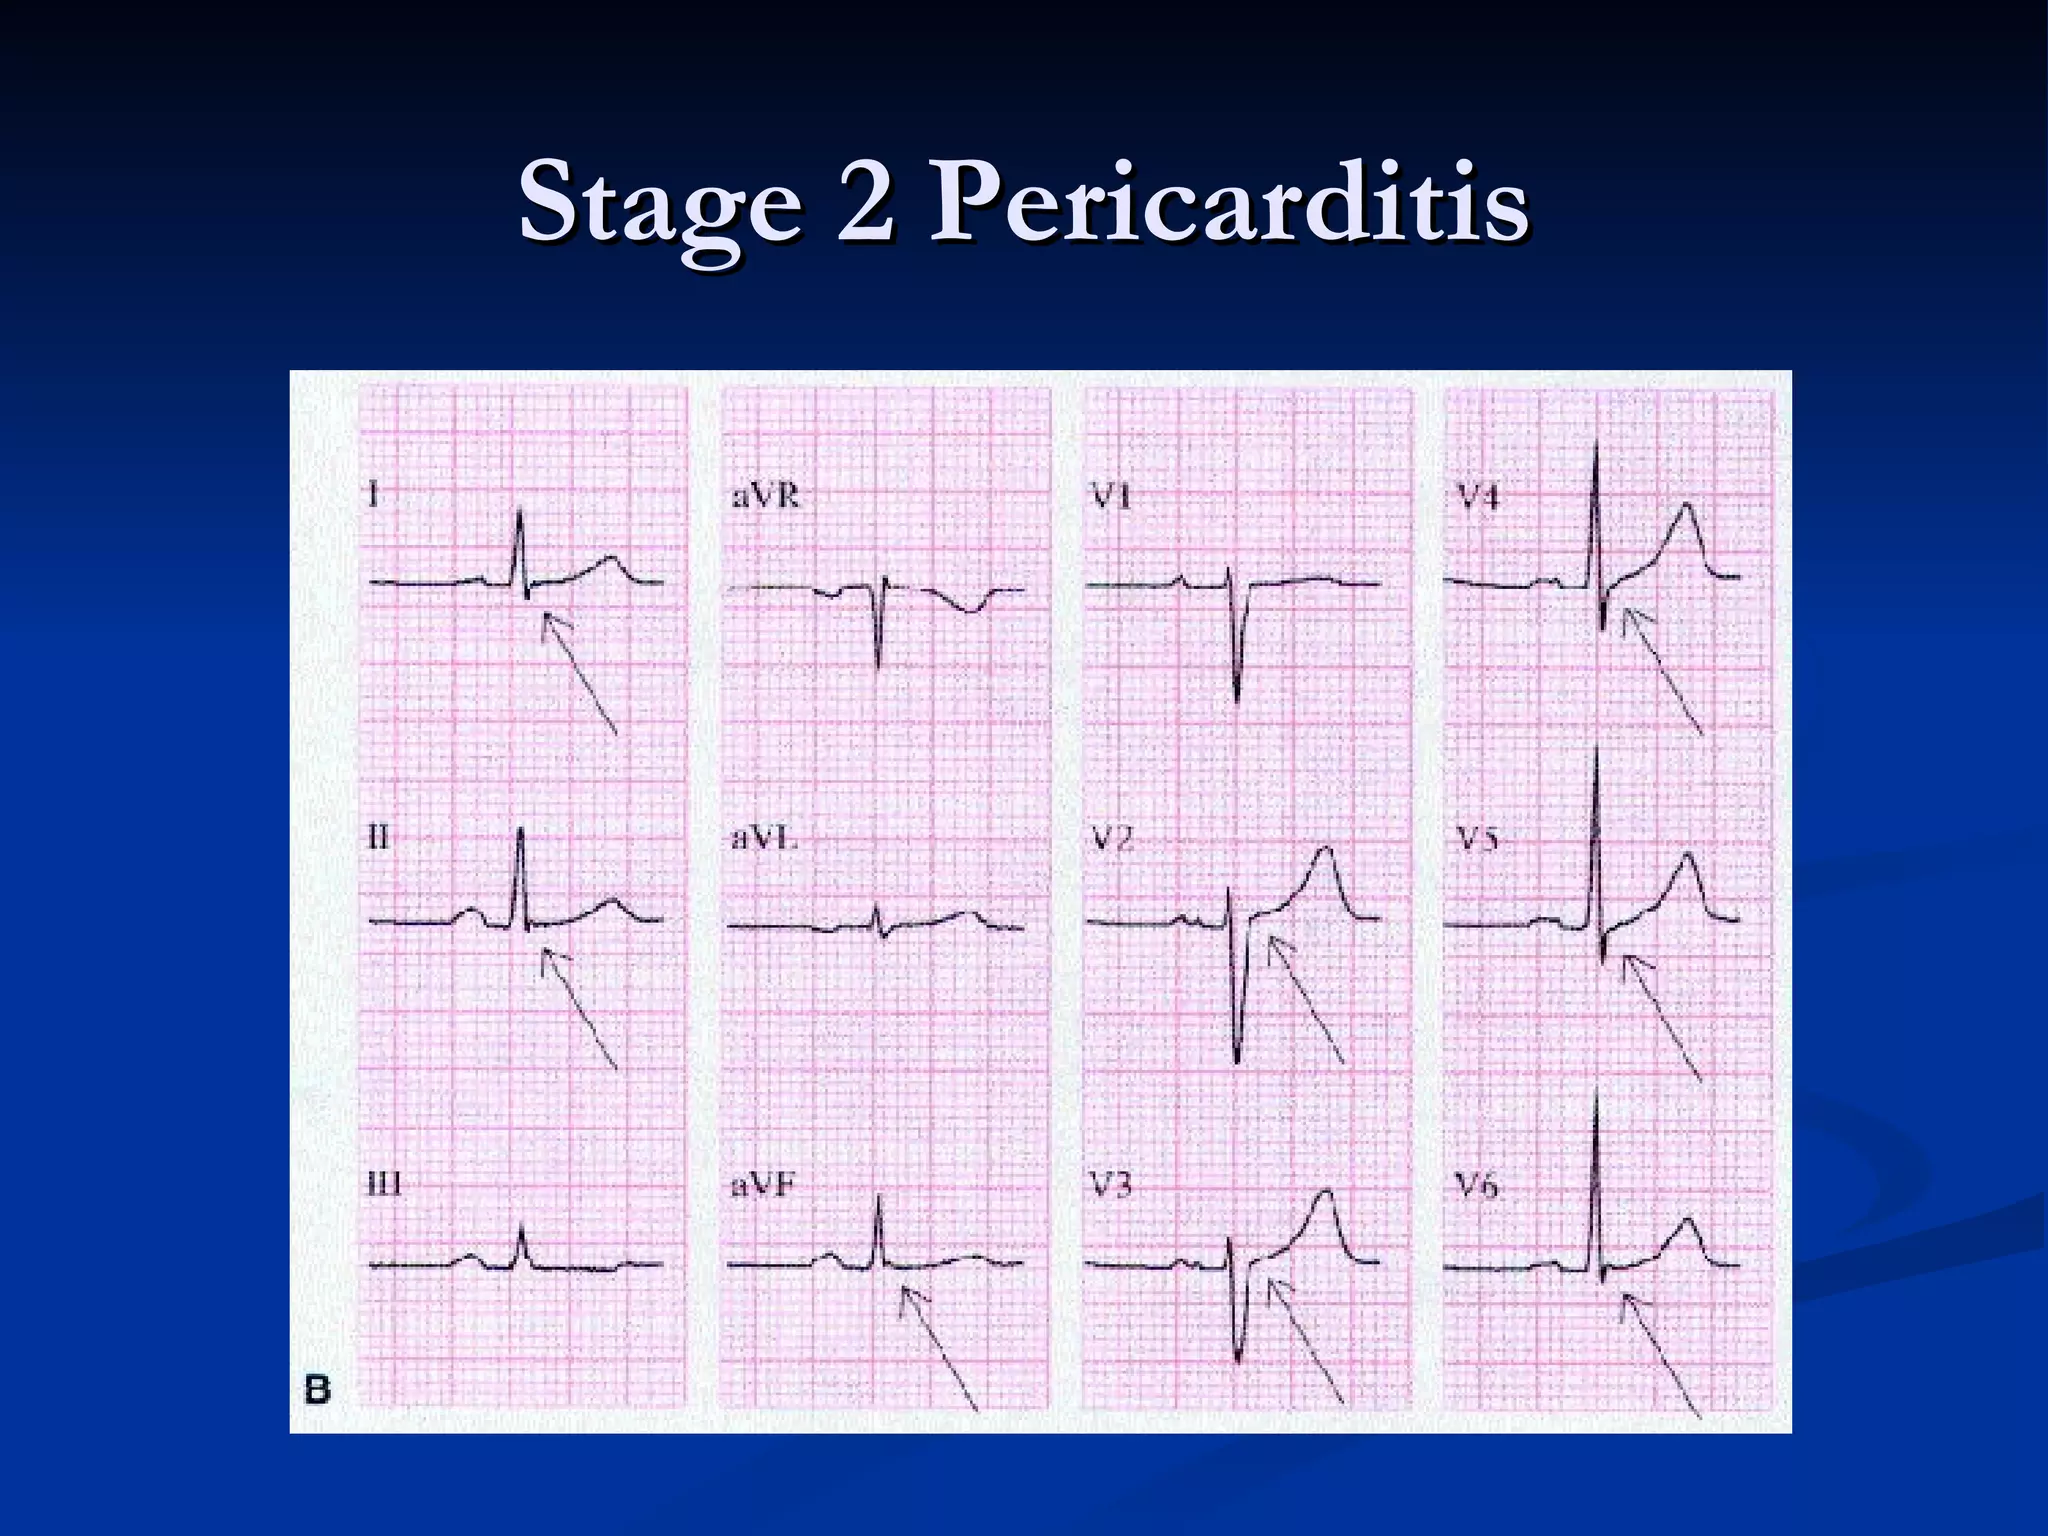
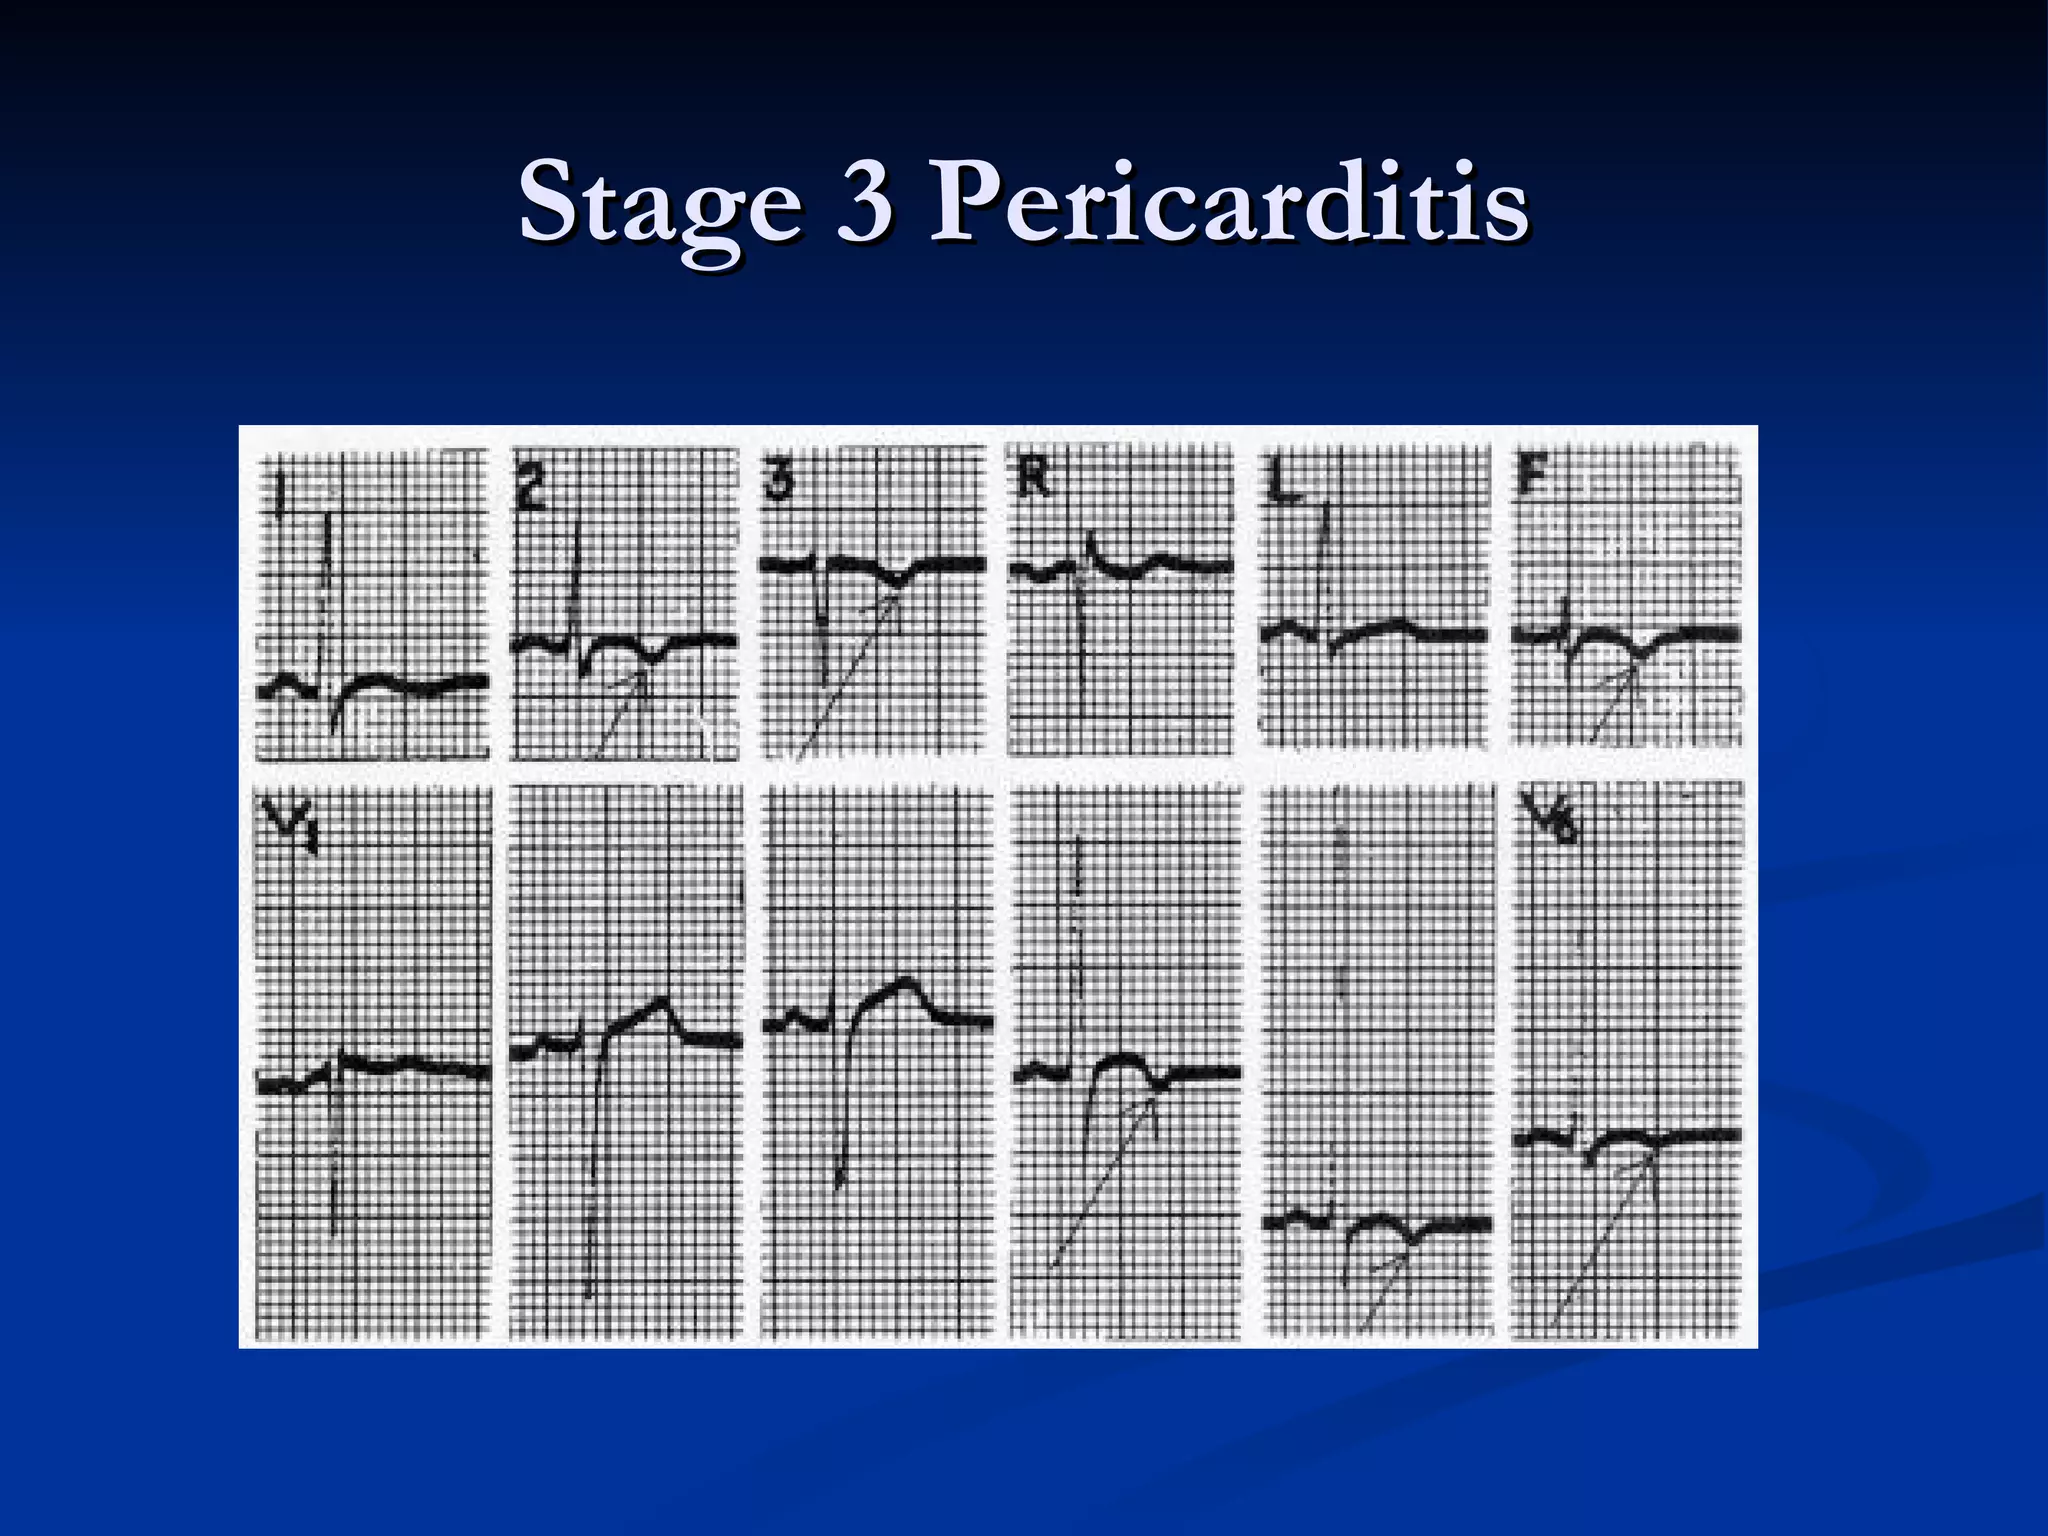
Insights on how to identify pericarditis stage changes, correlating specific ECG characteristics with clinical stages.
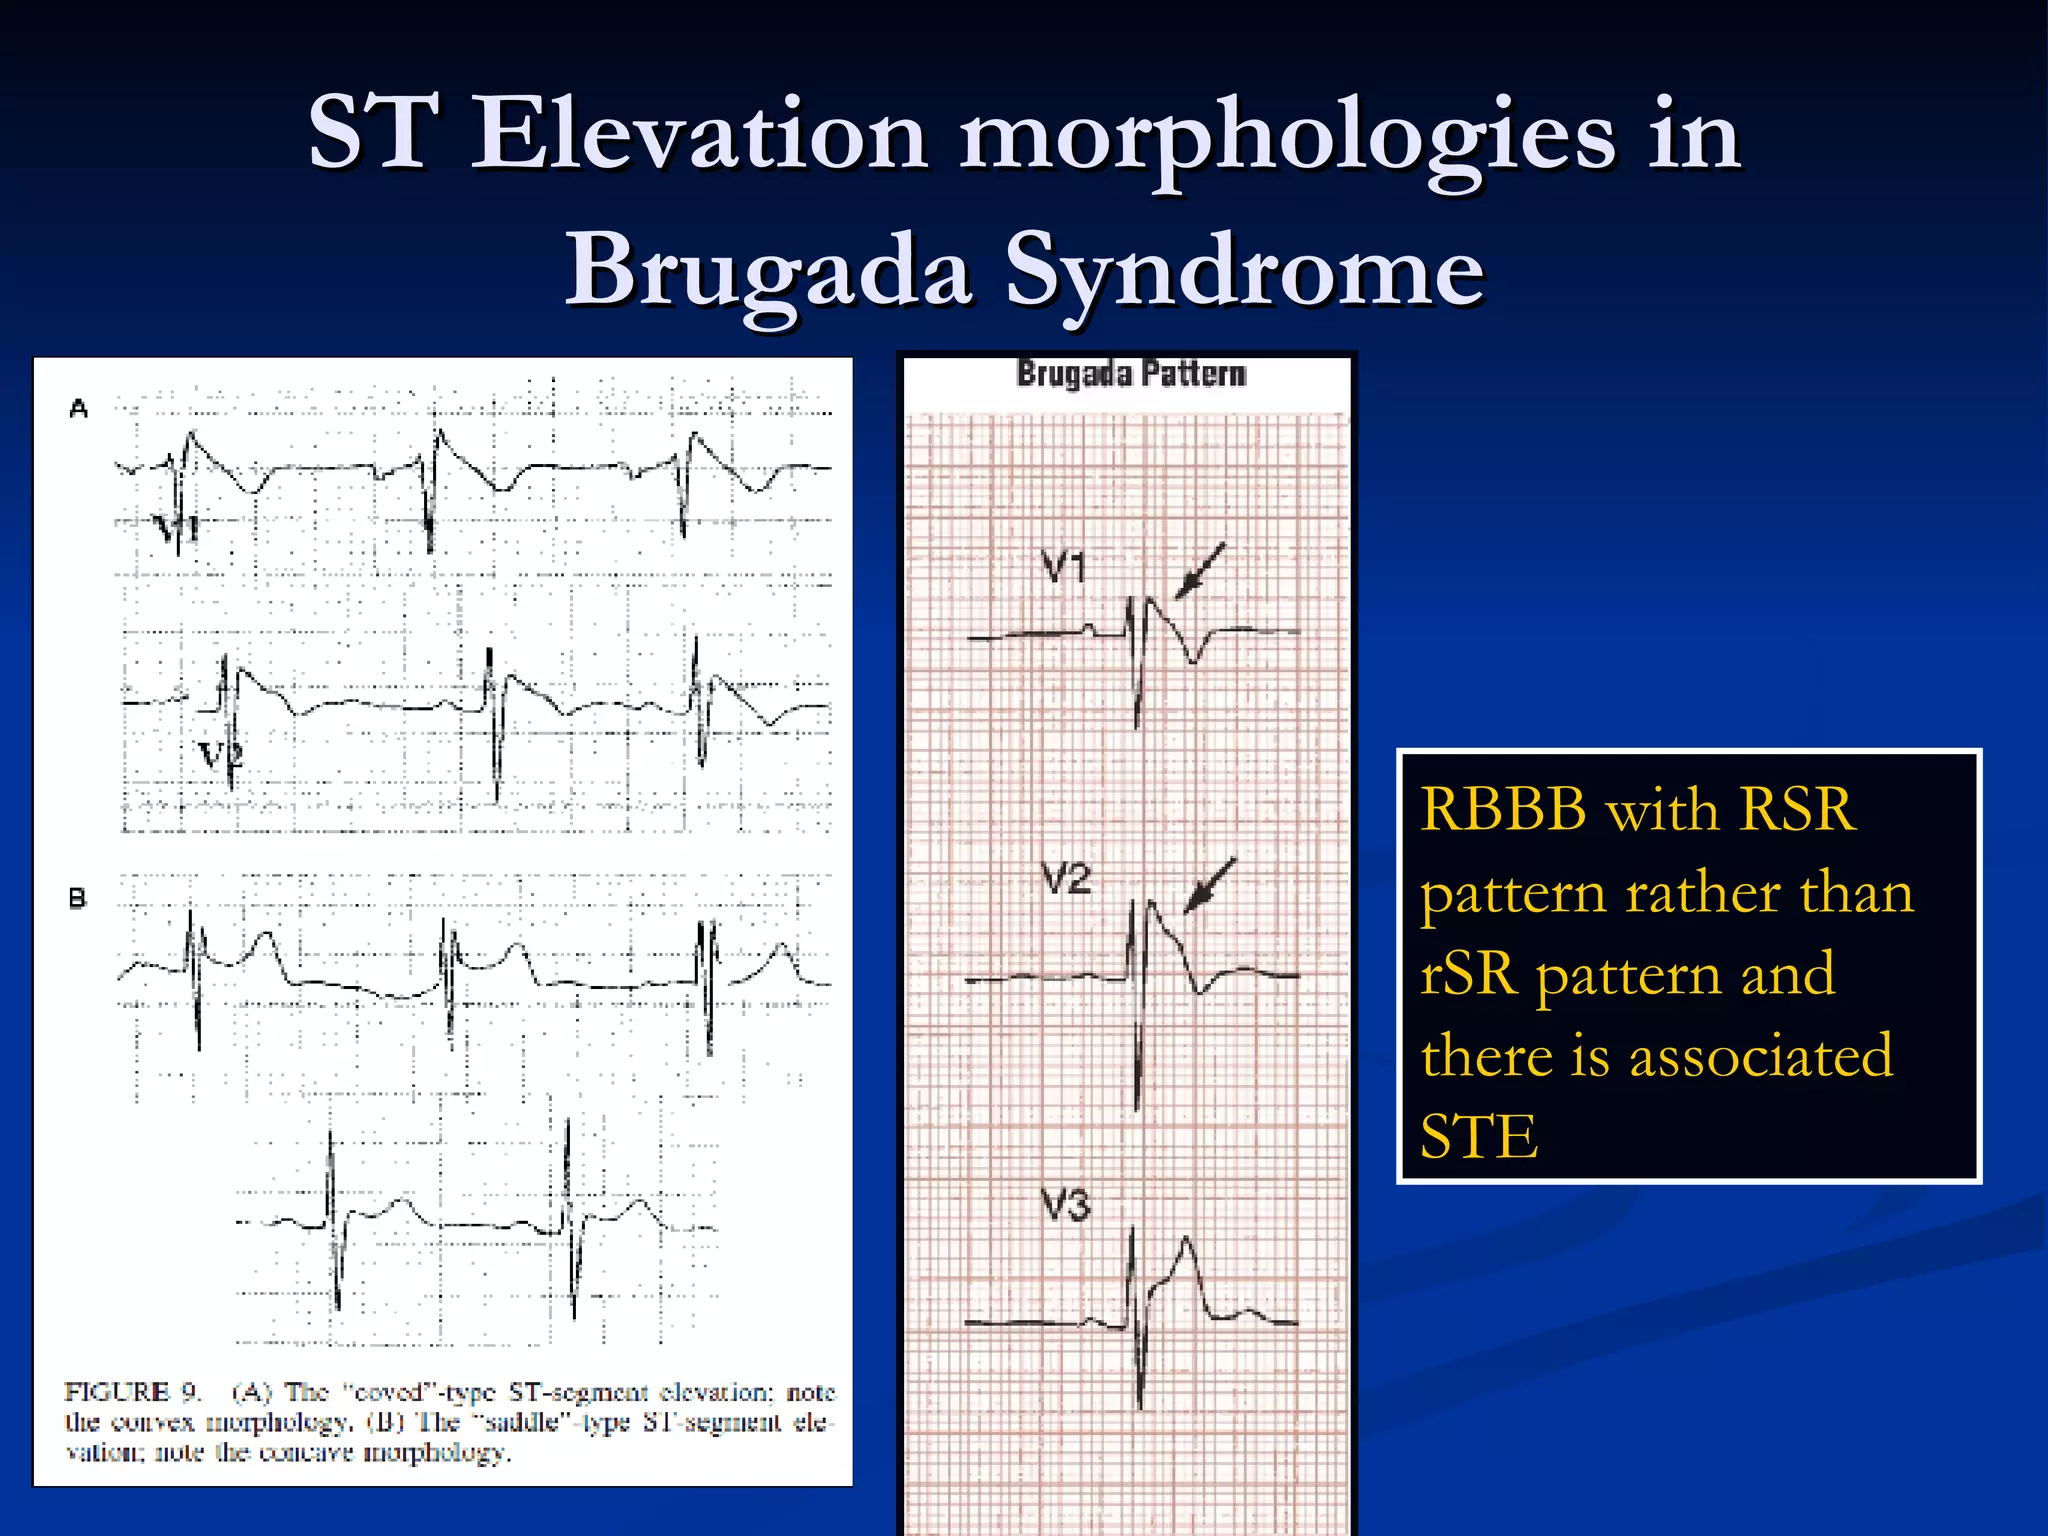
Introduction and identification of ECG patterns in Brugada Syndrome, identifiable by specific elevations and shapes.
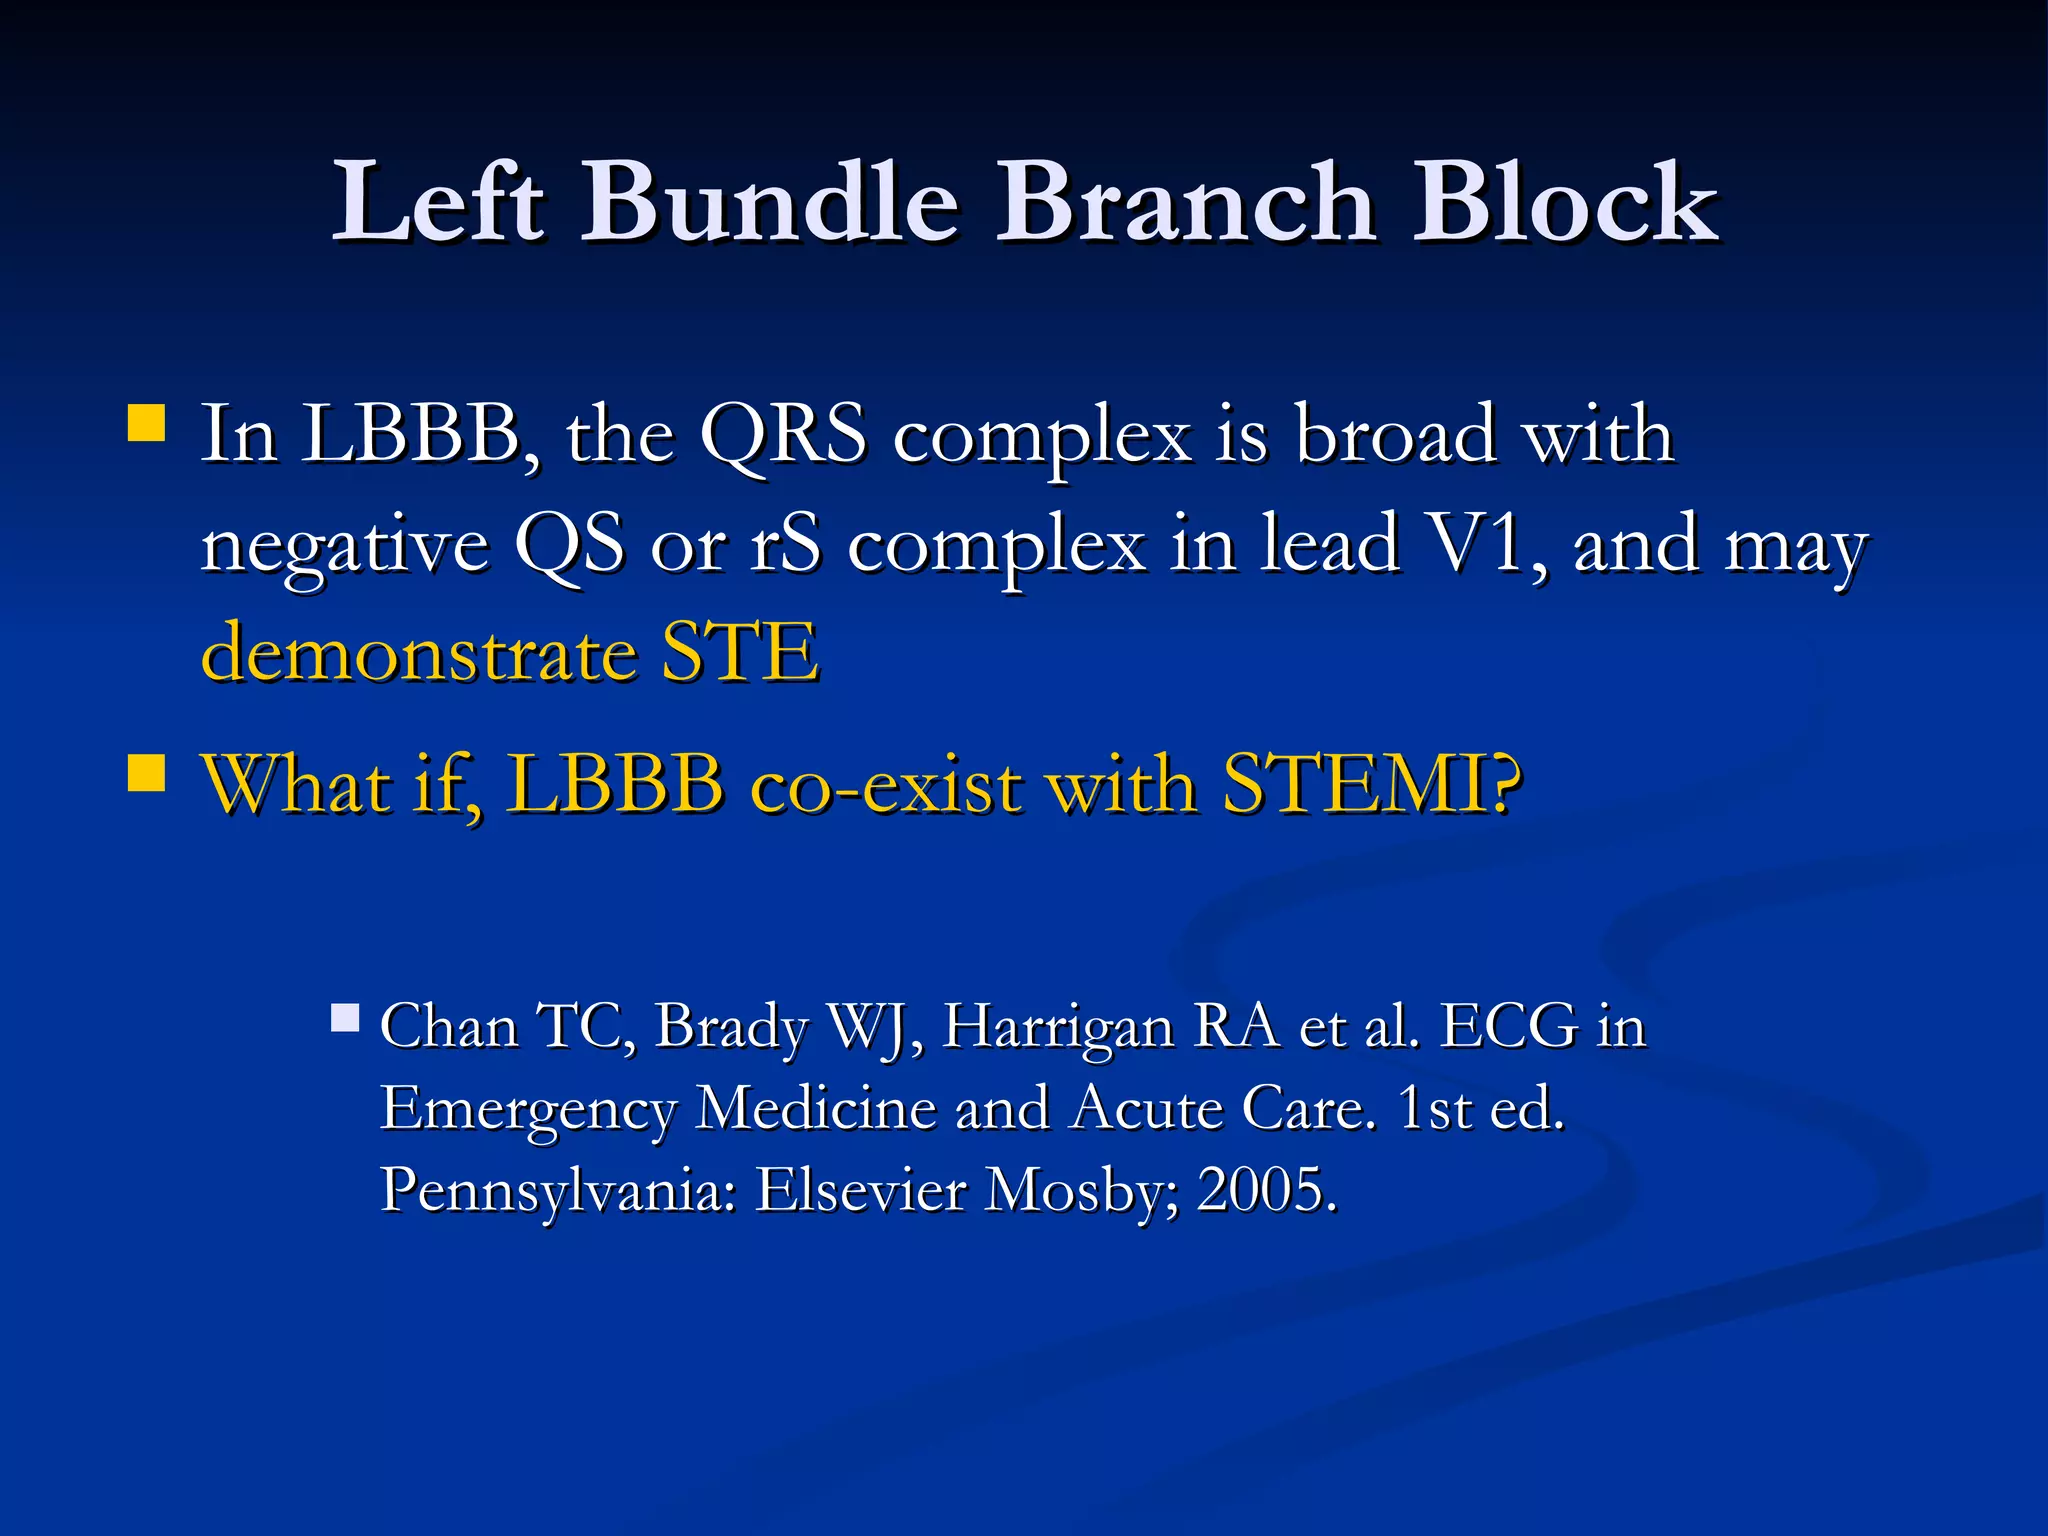
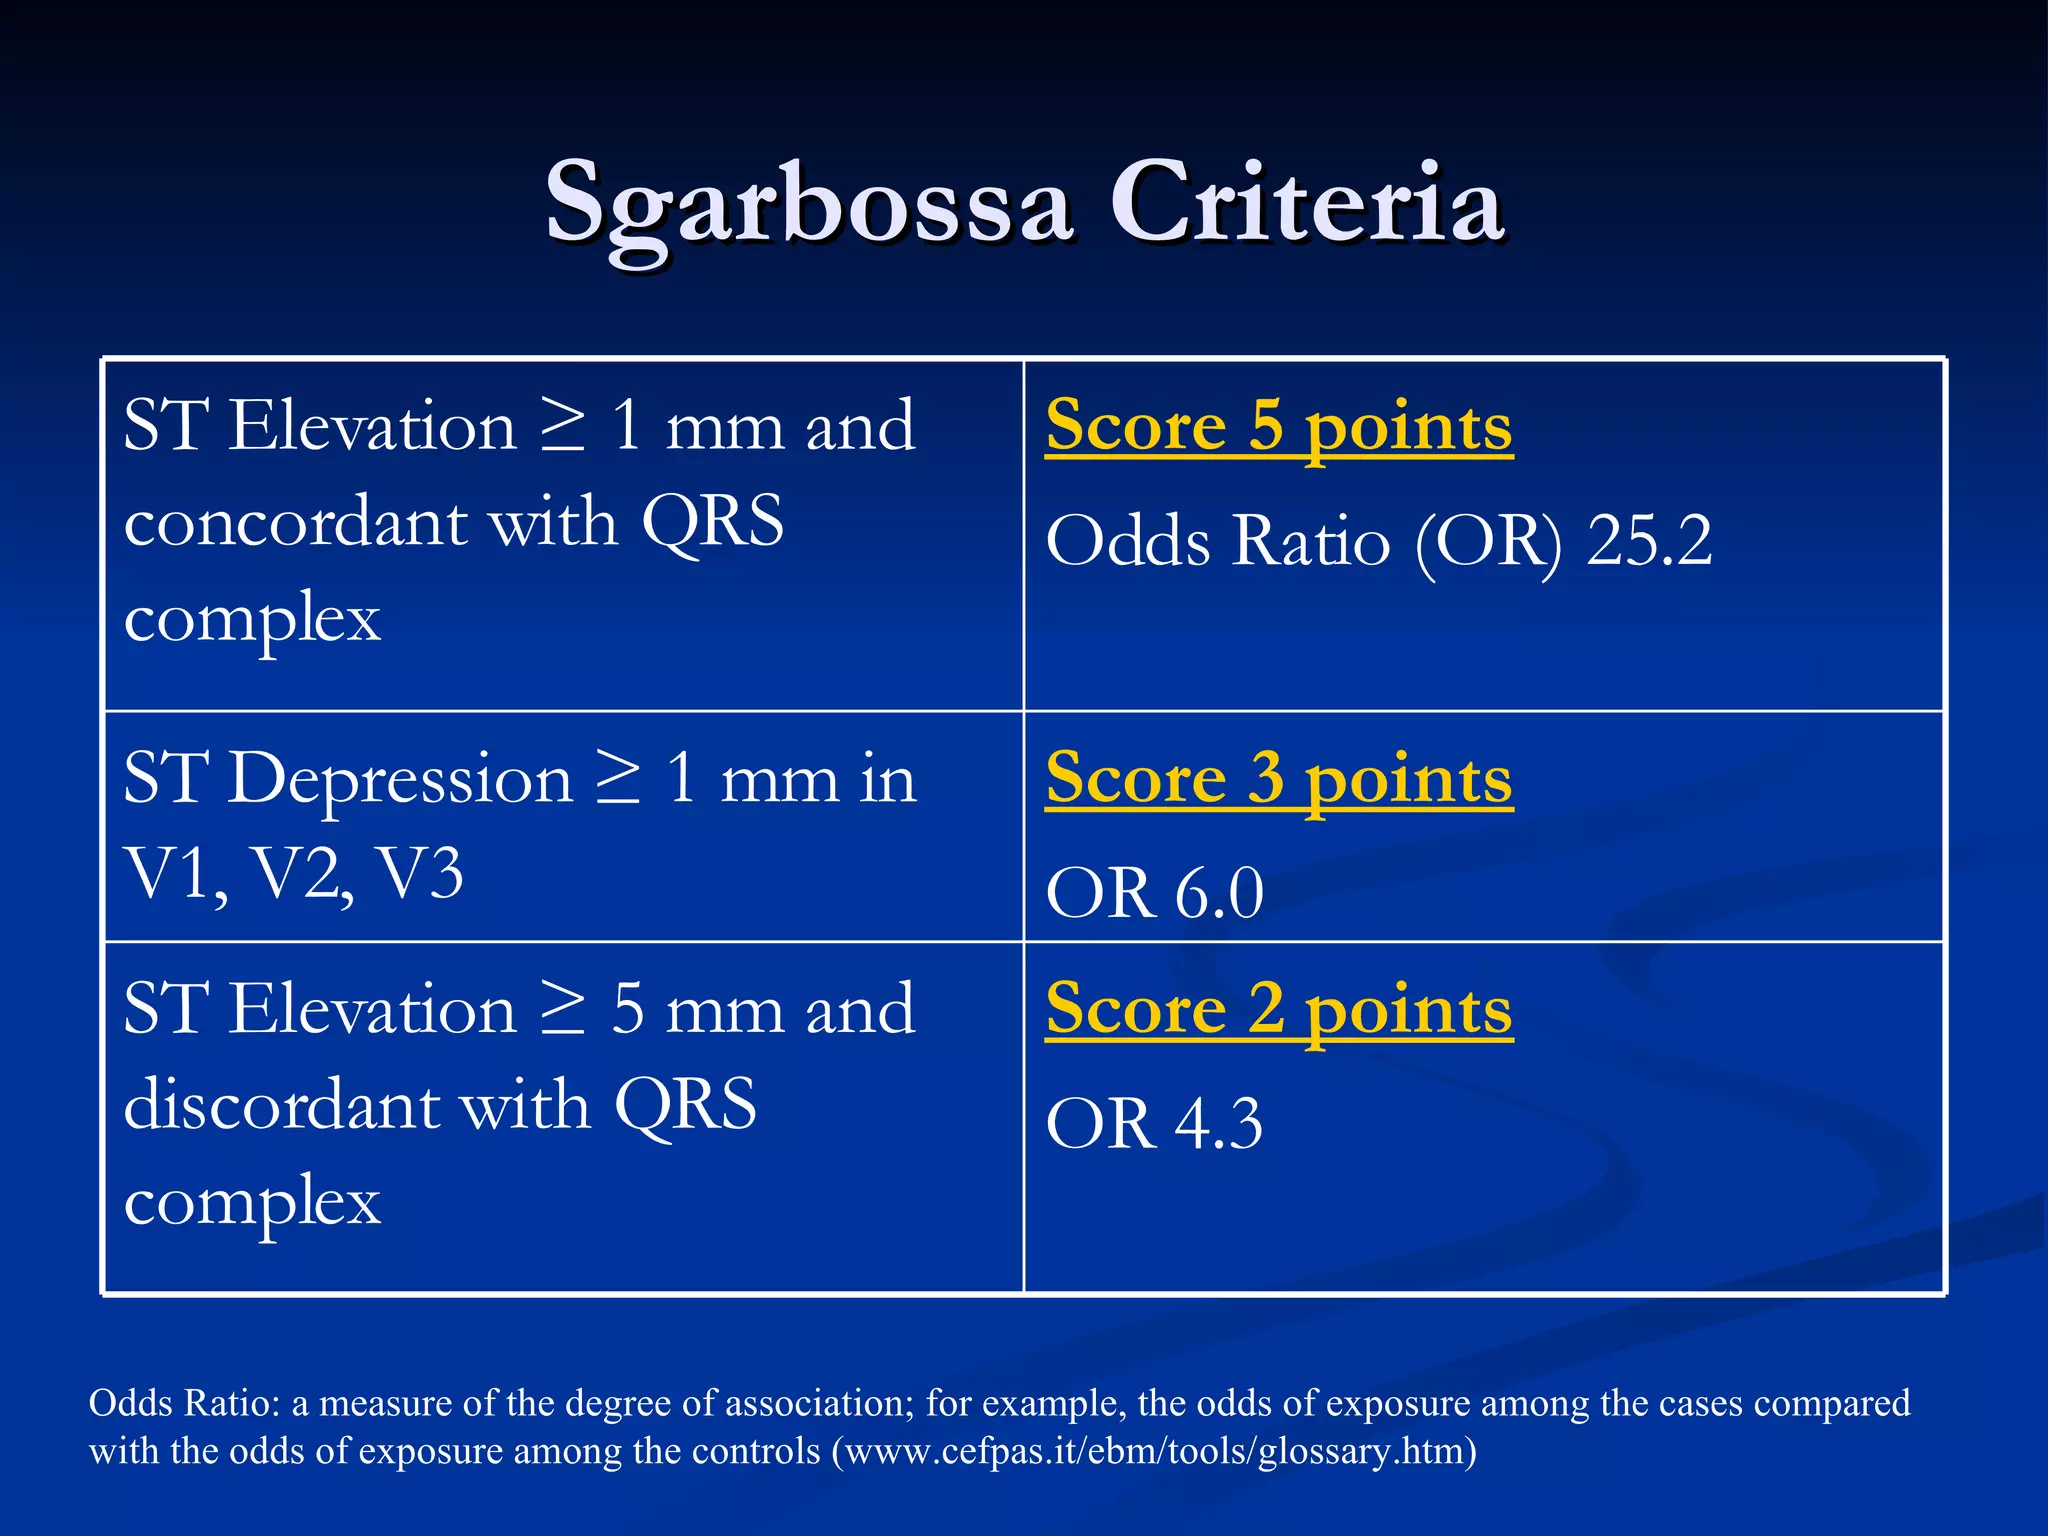
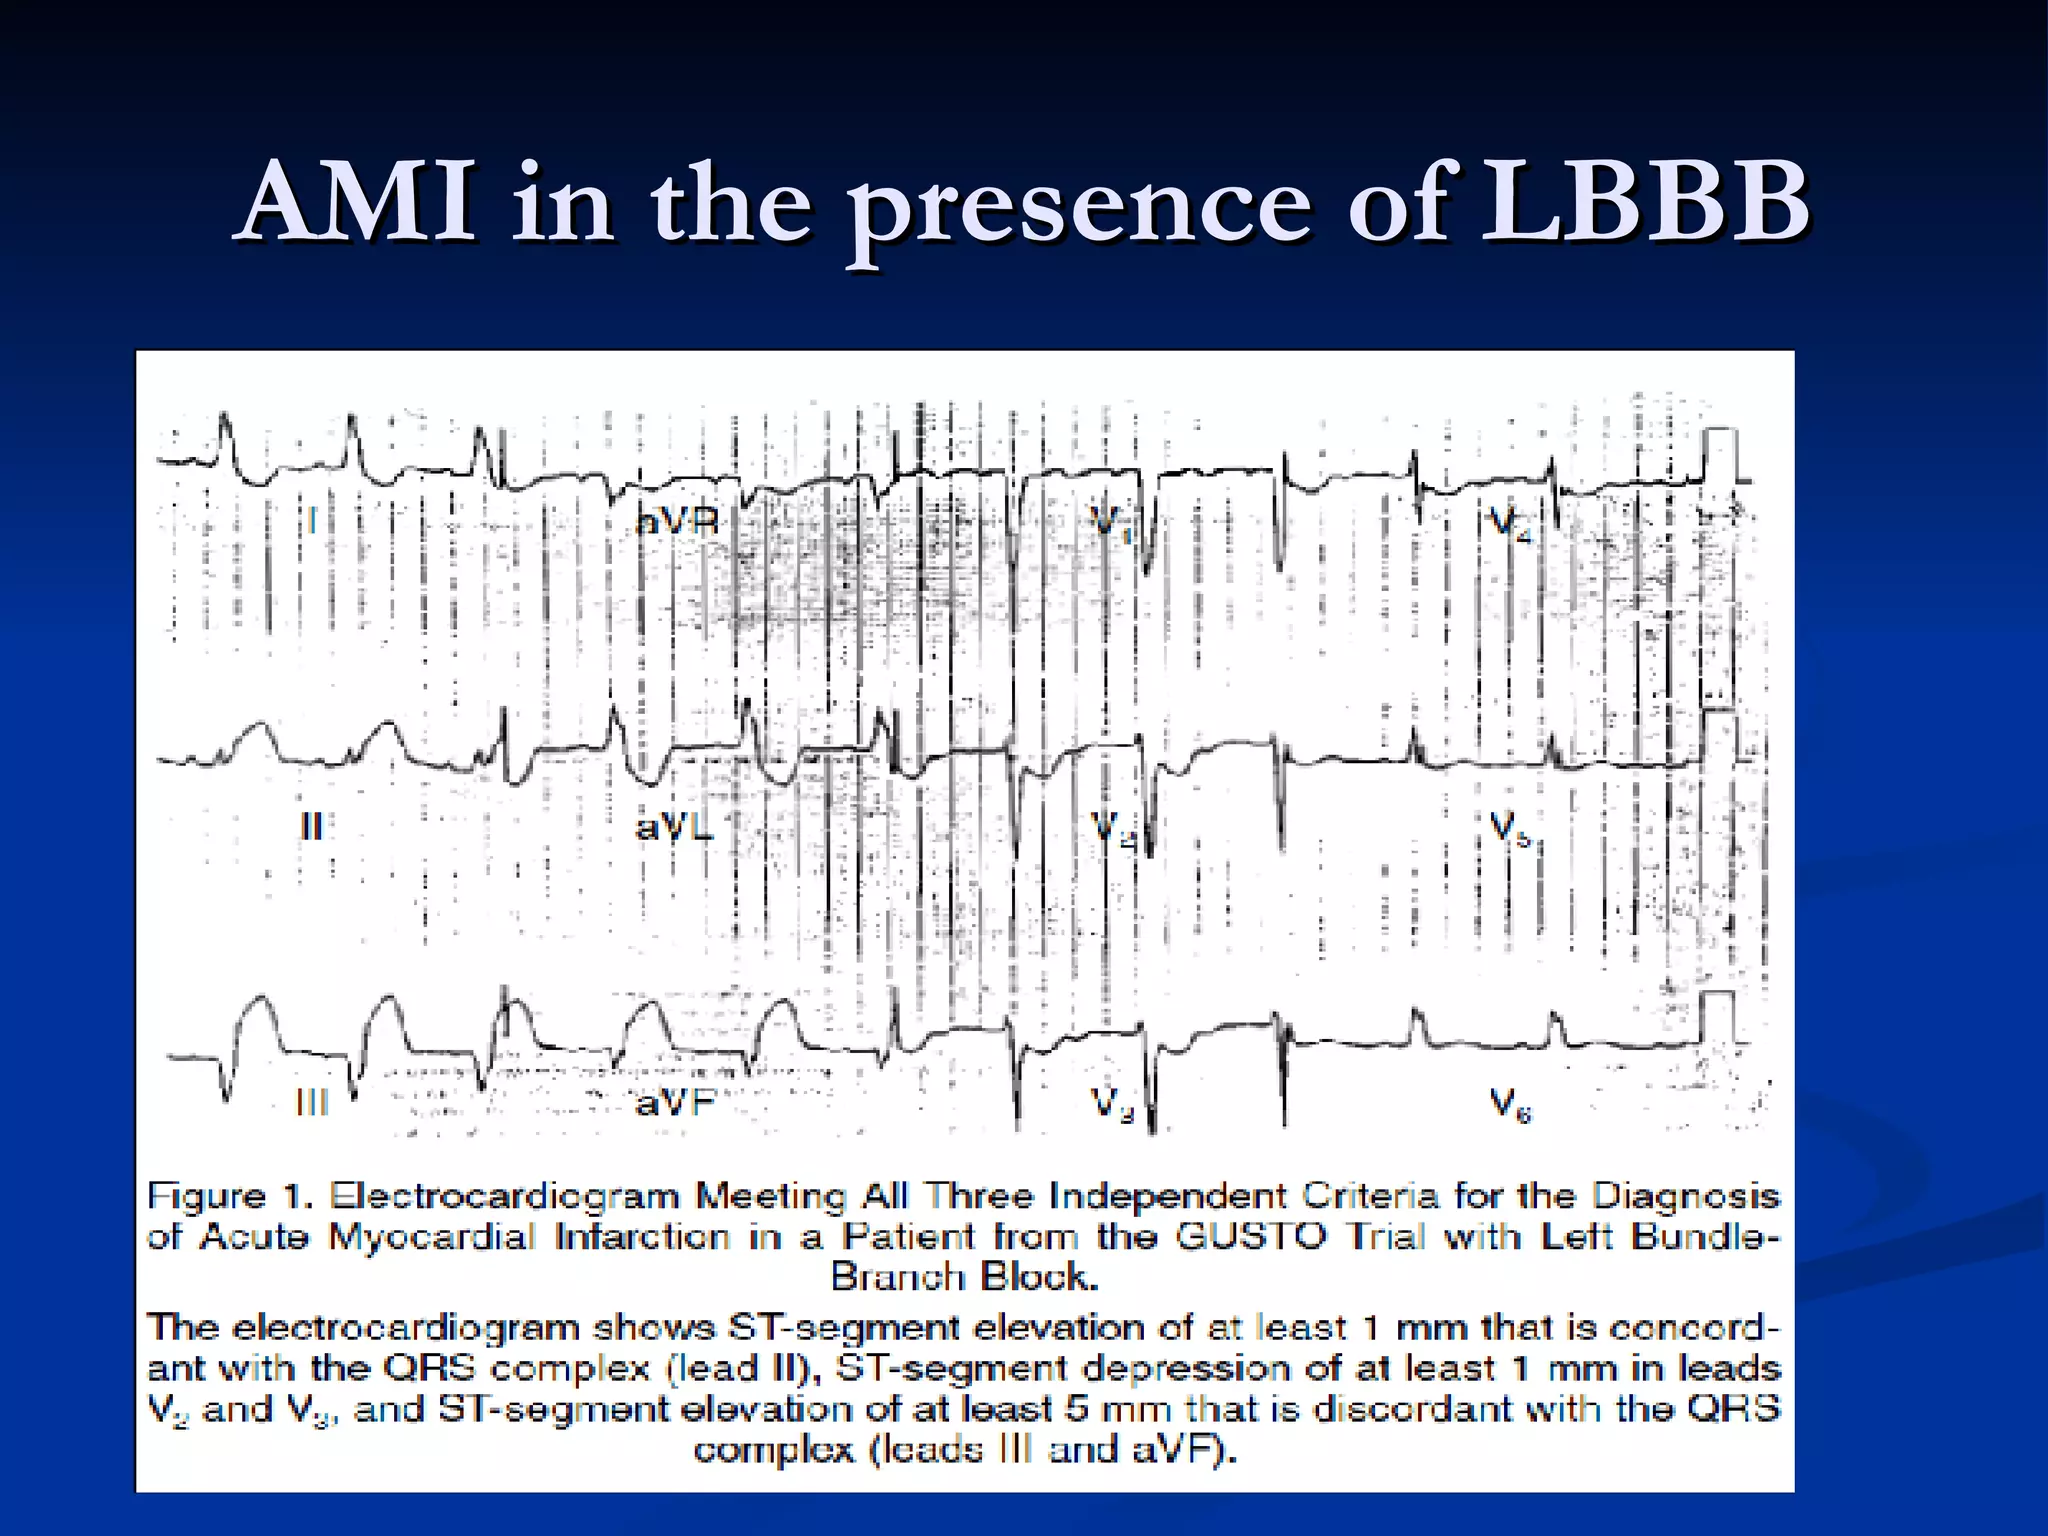
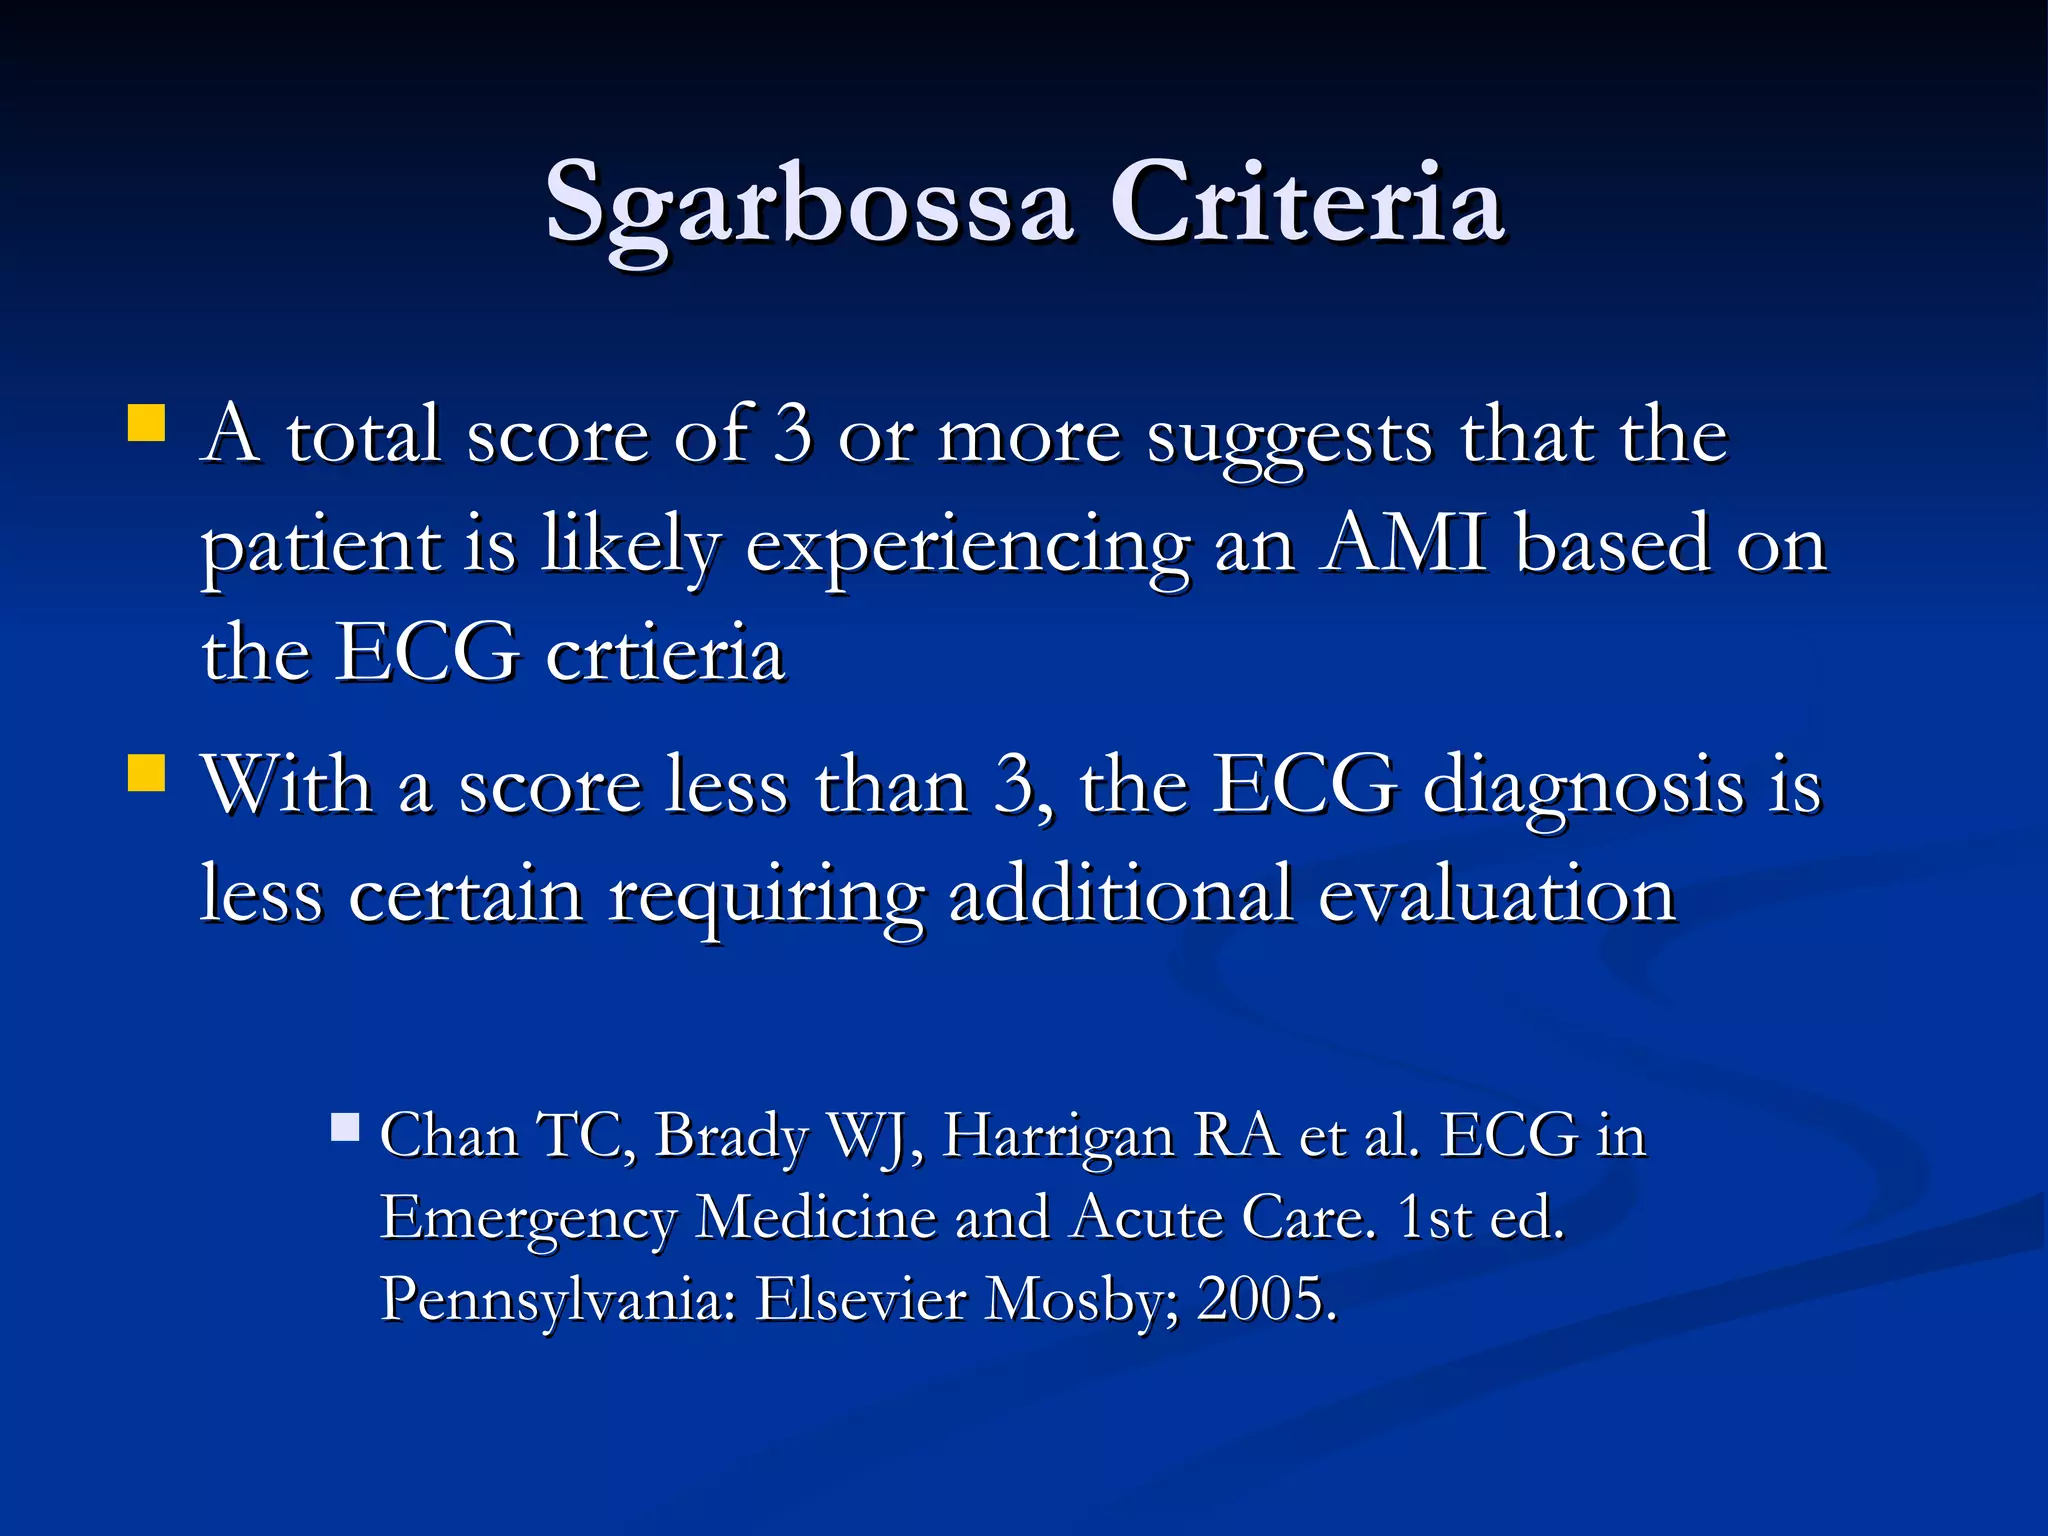
Discussion on diagnosing AMI in presence of LBBB using Sgarbossa criteria, which provides clinical evaluation metrics.
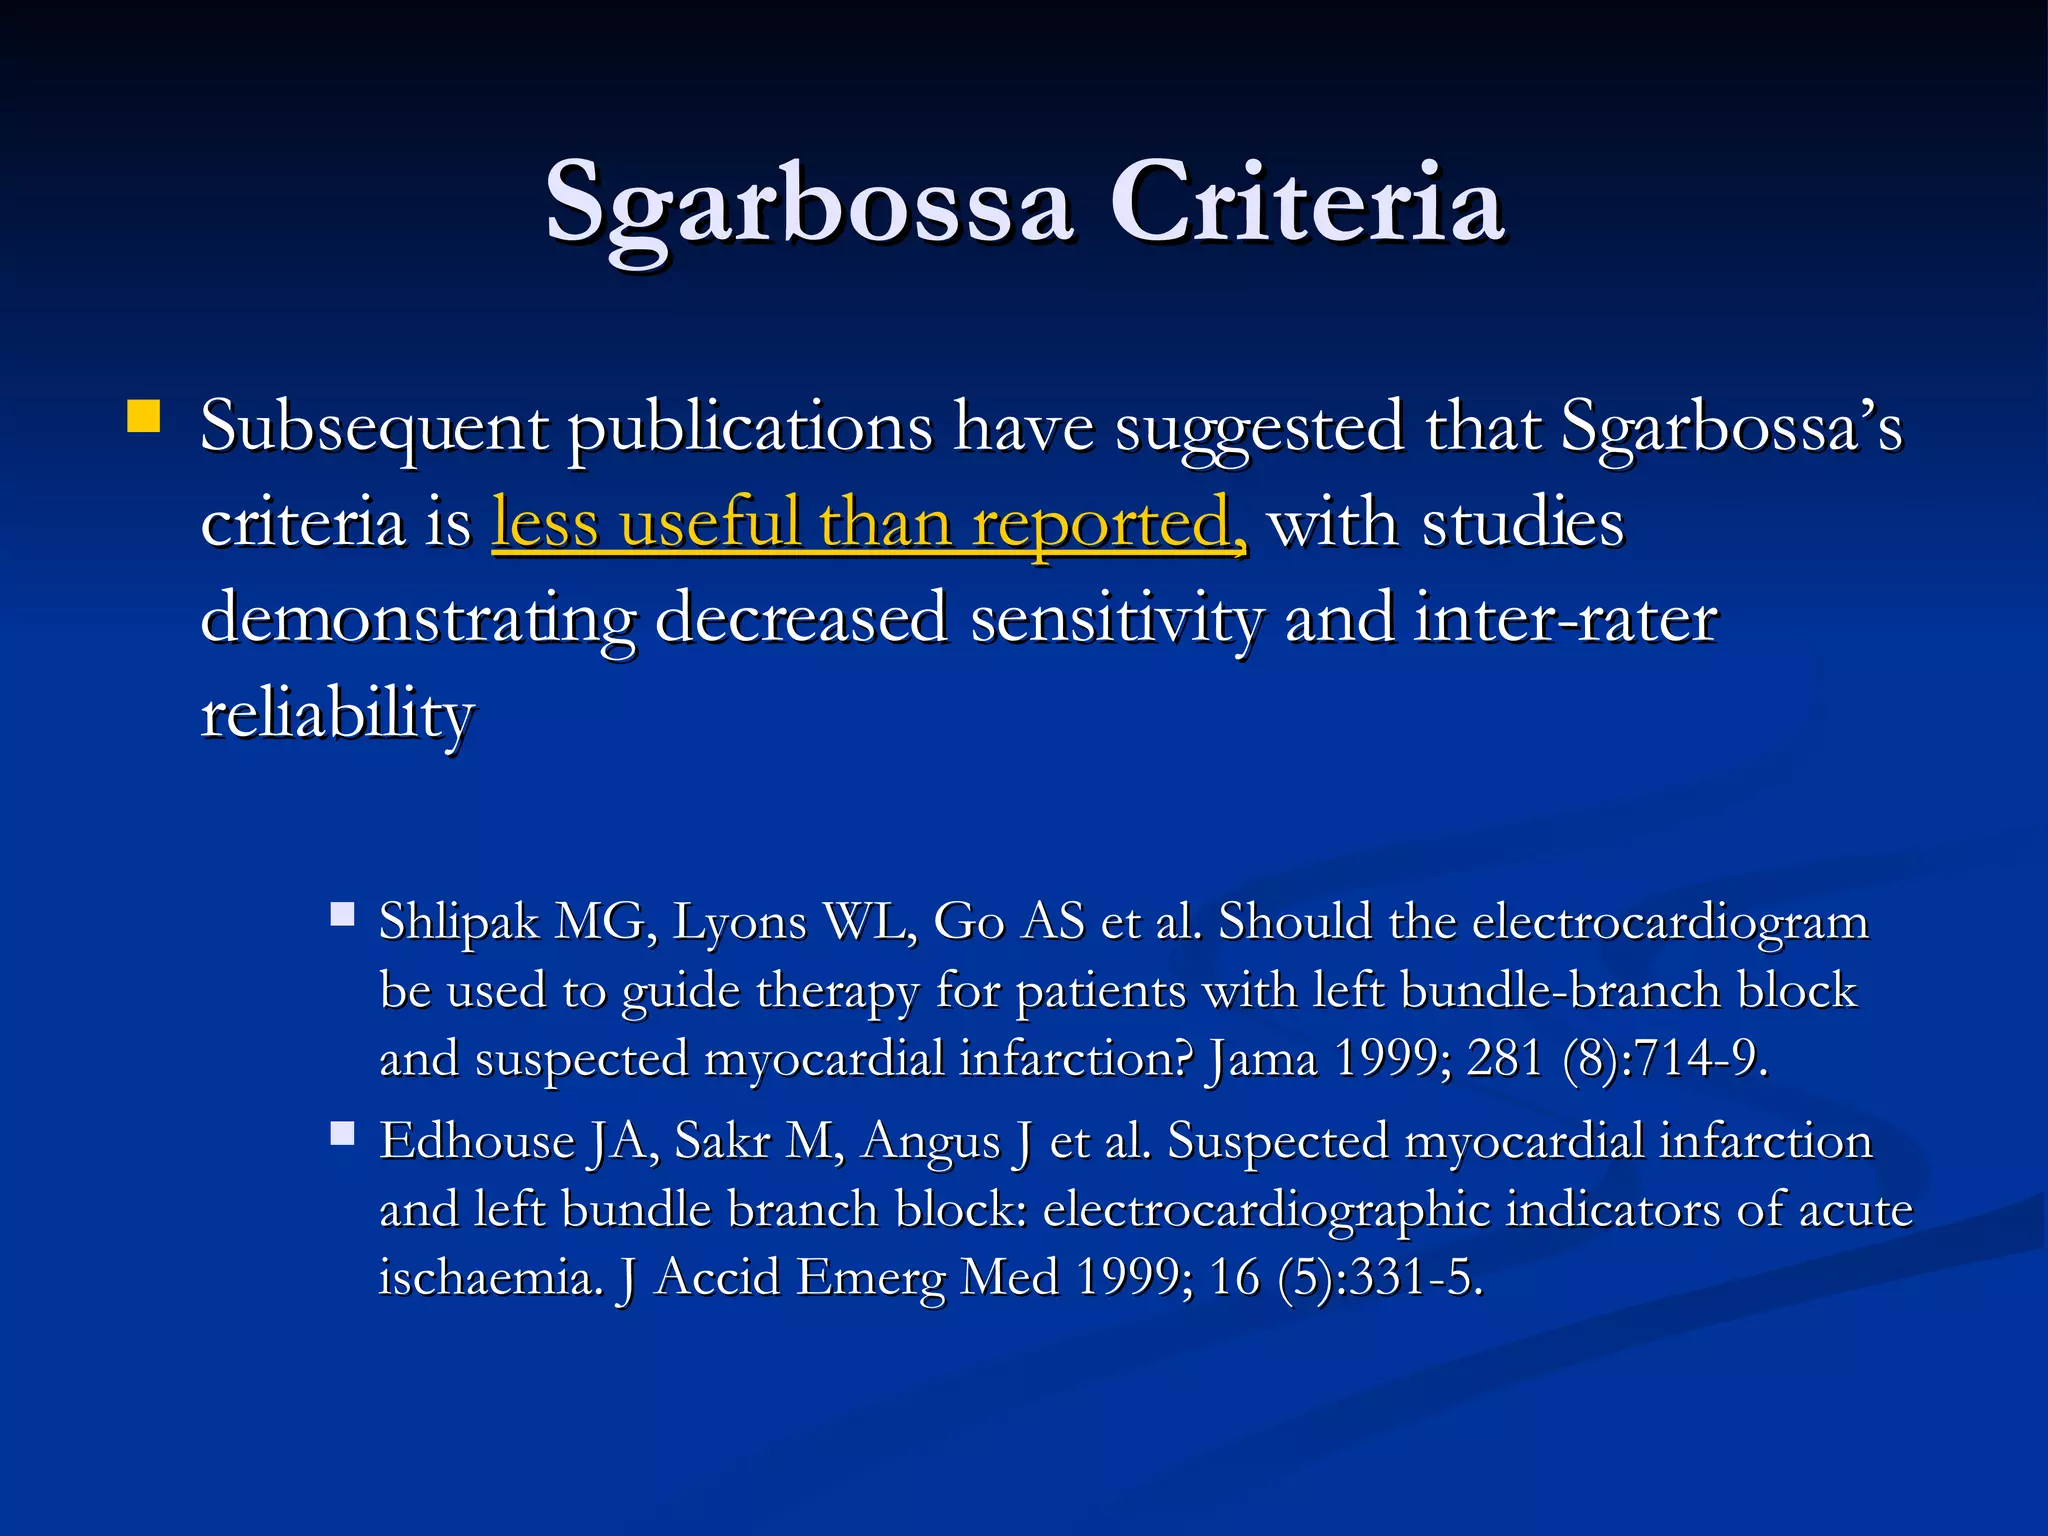
Evaluation of Sgarbossa's criteria in assessing AMI likelihood amidst LBBB, highlighting scoring significance and reliability concerns.
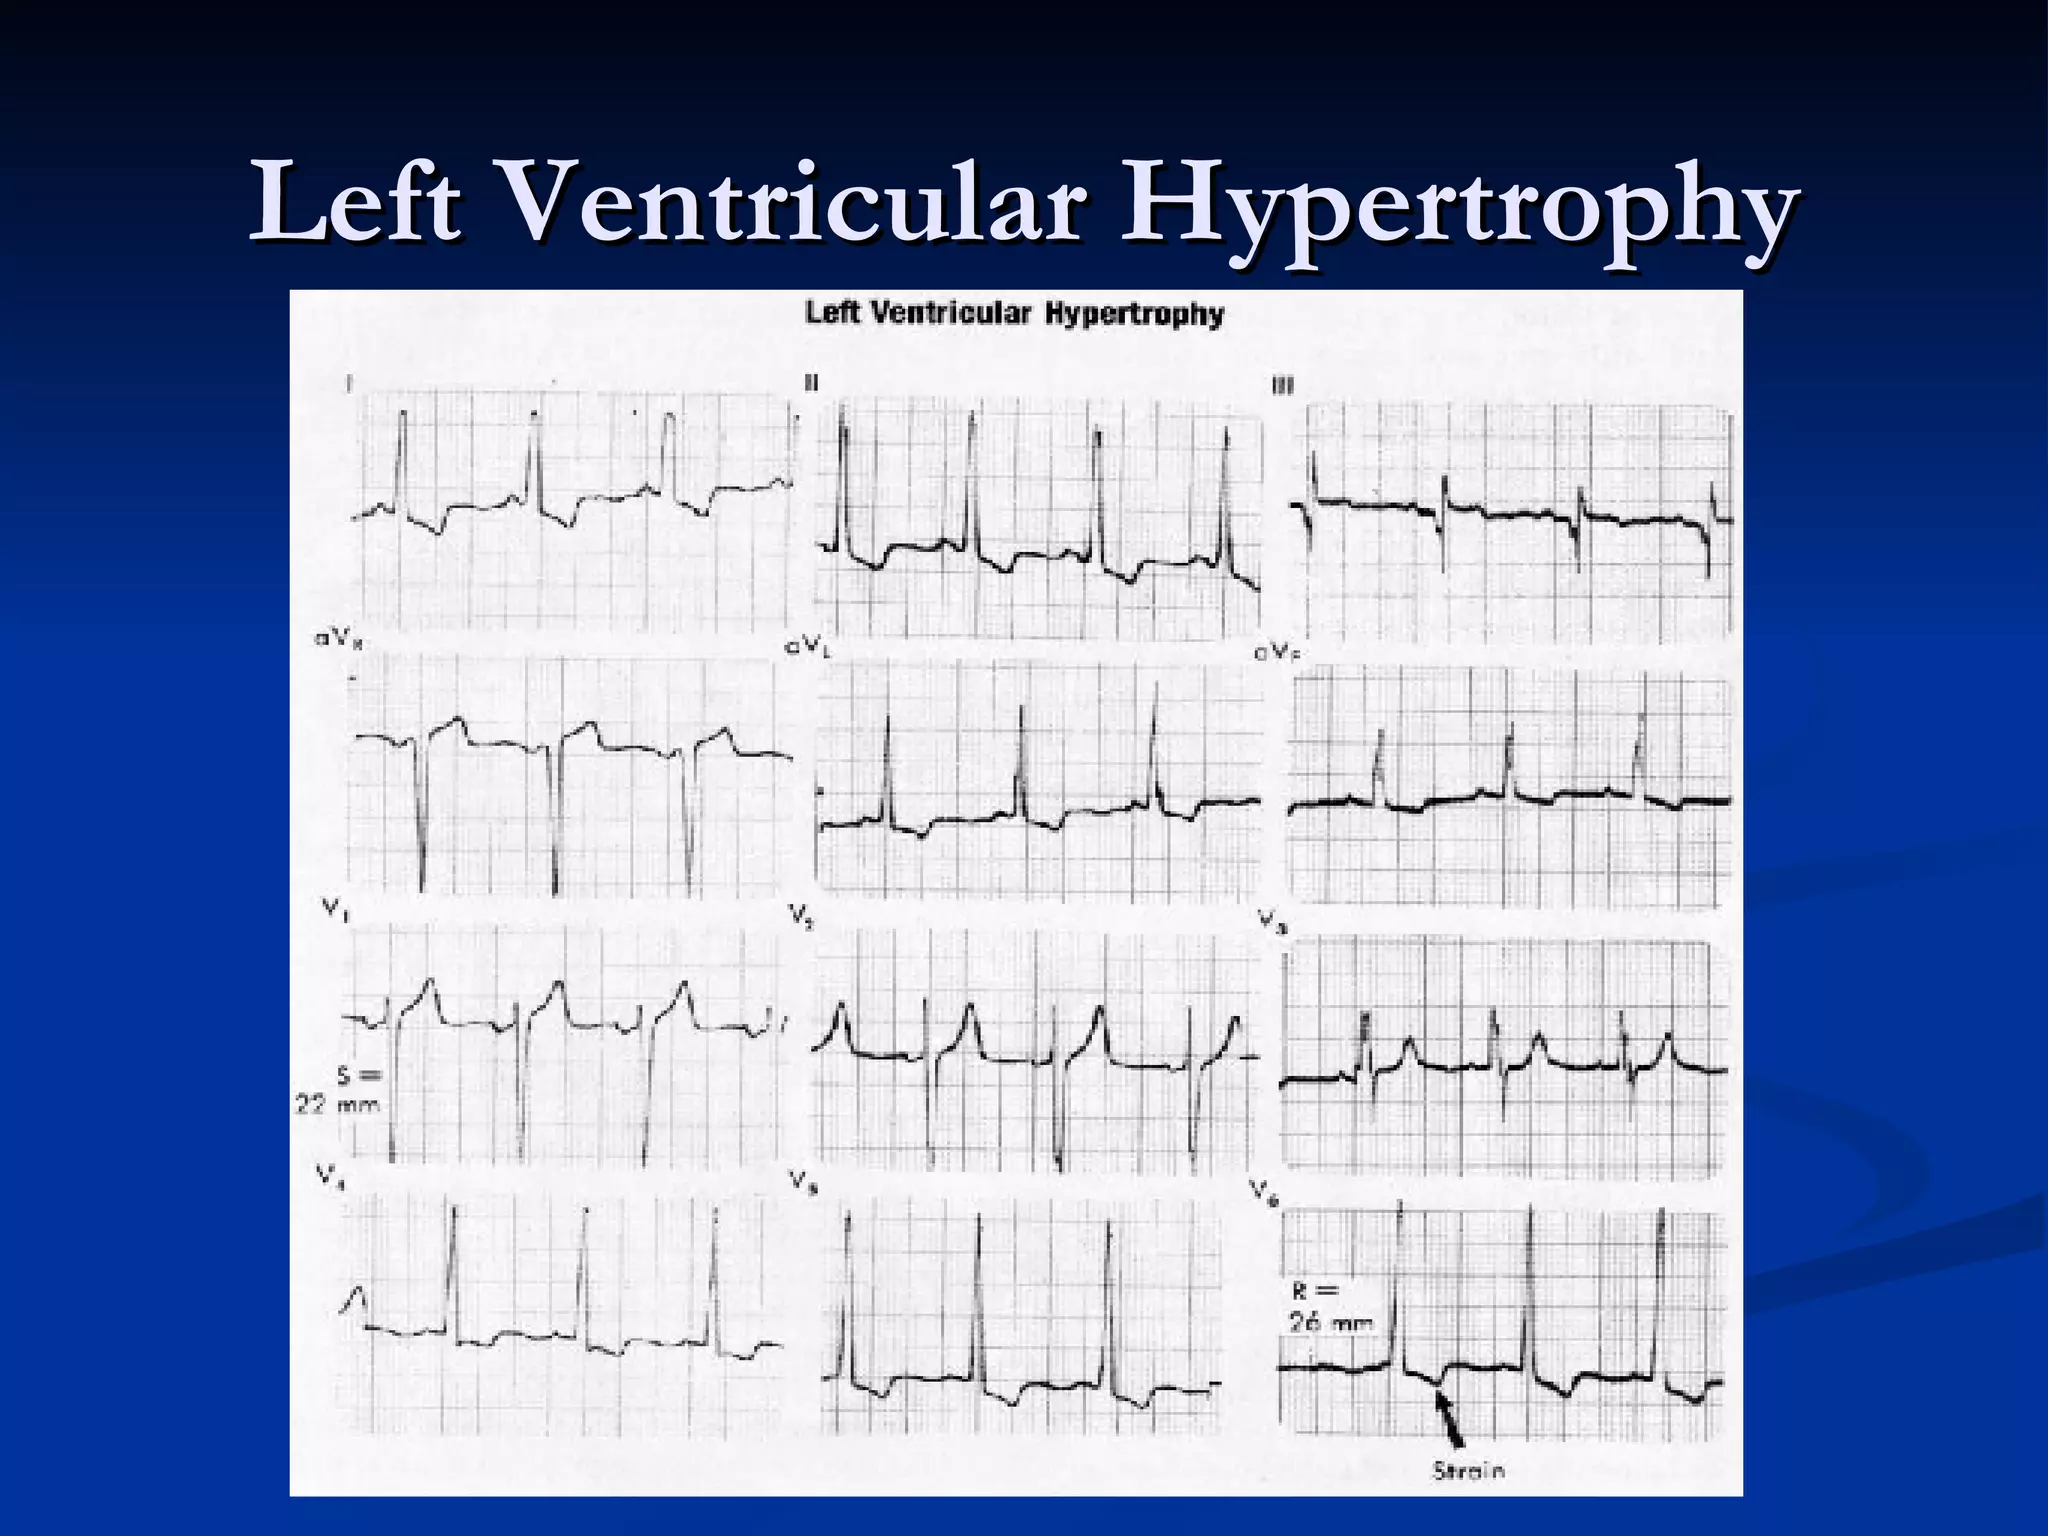
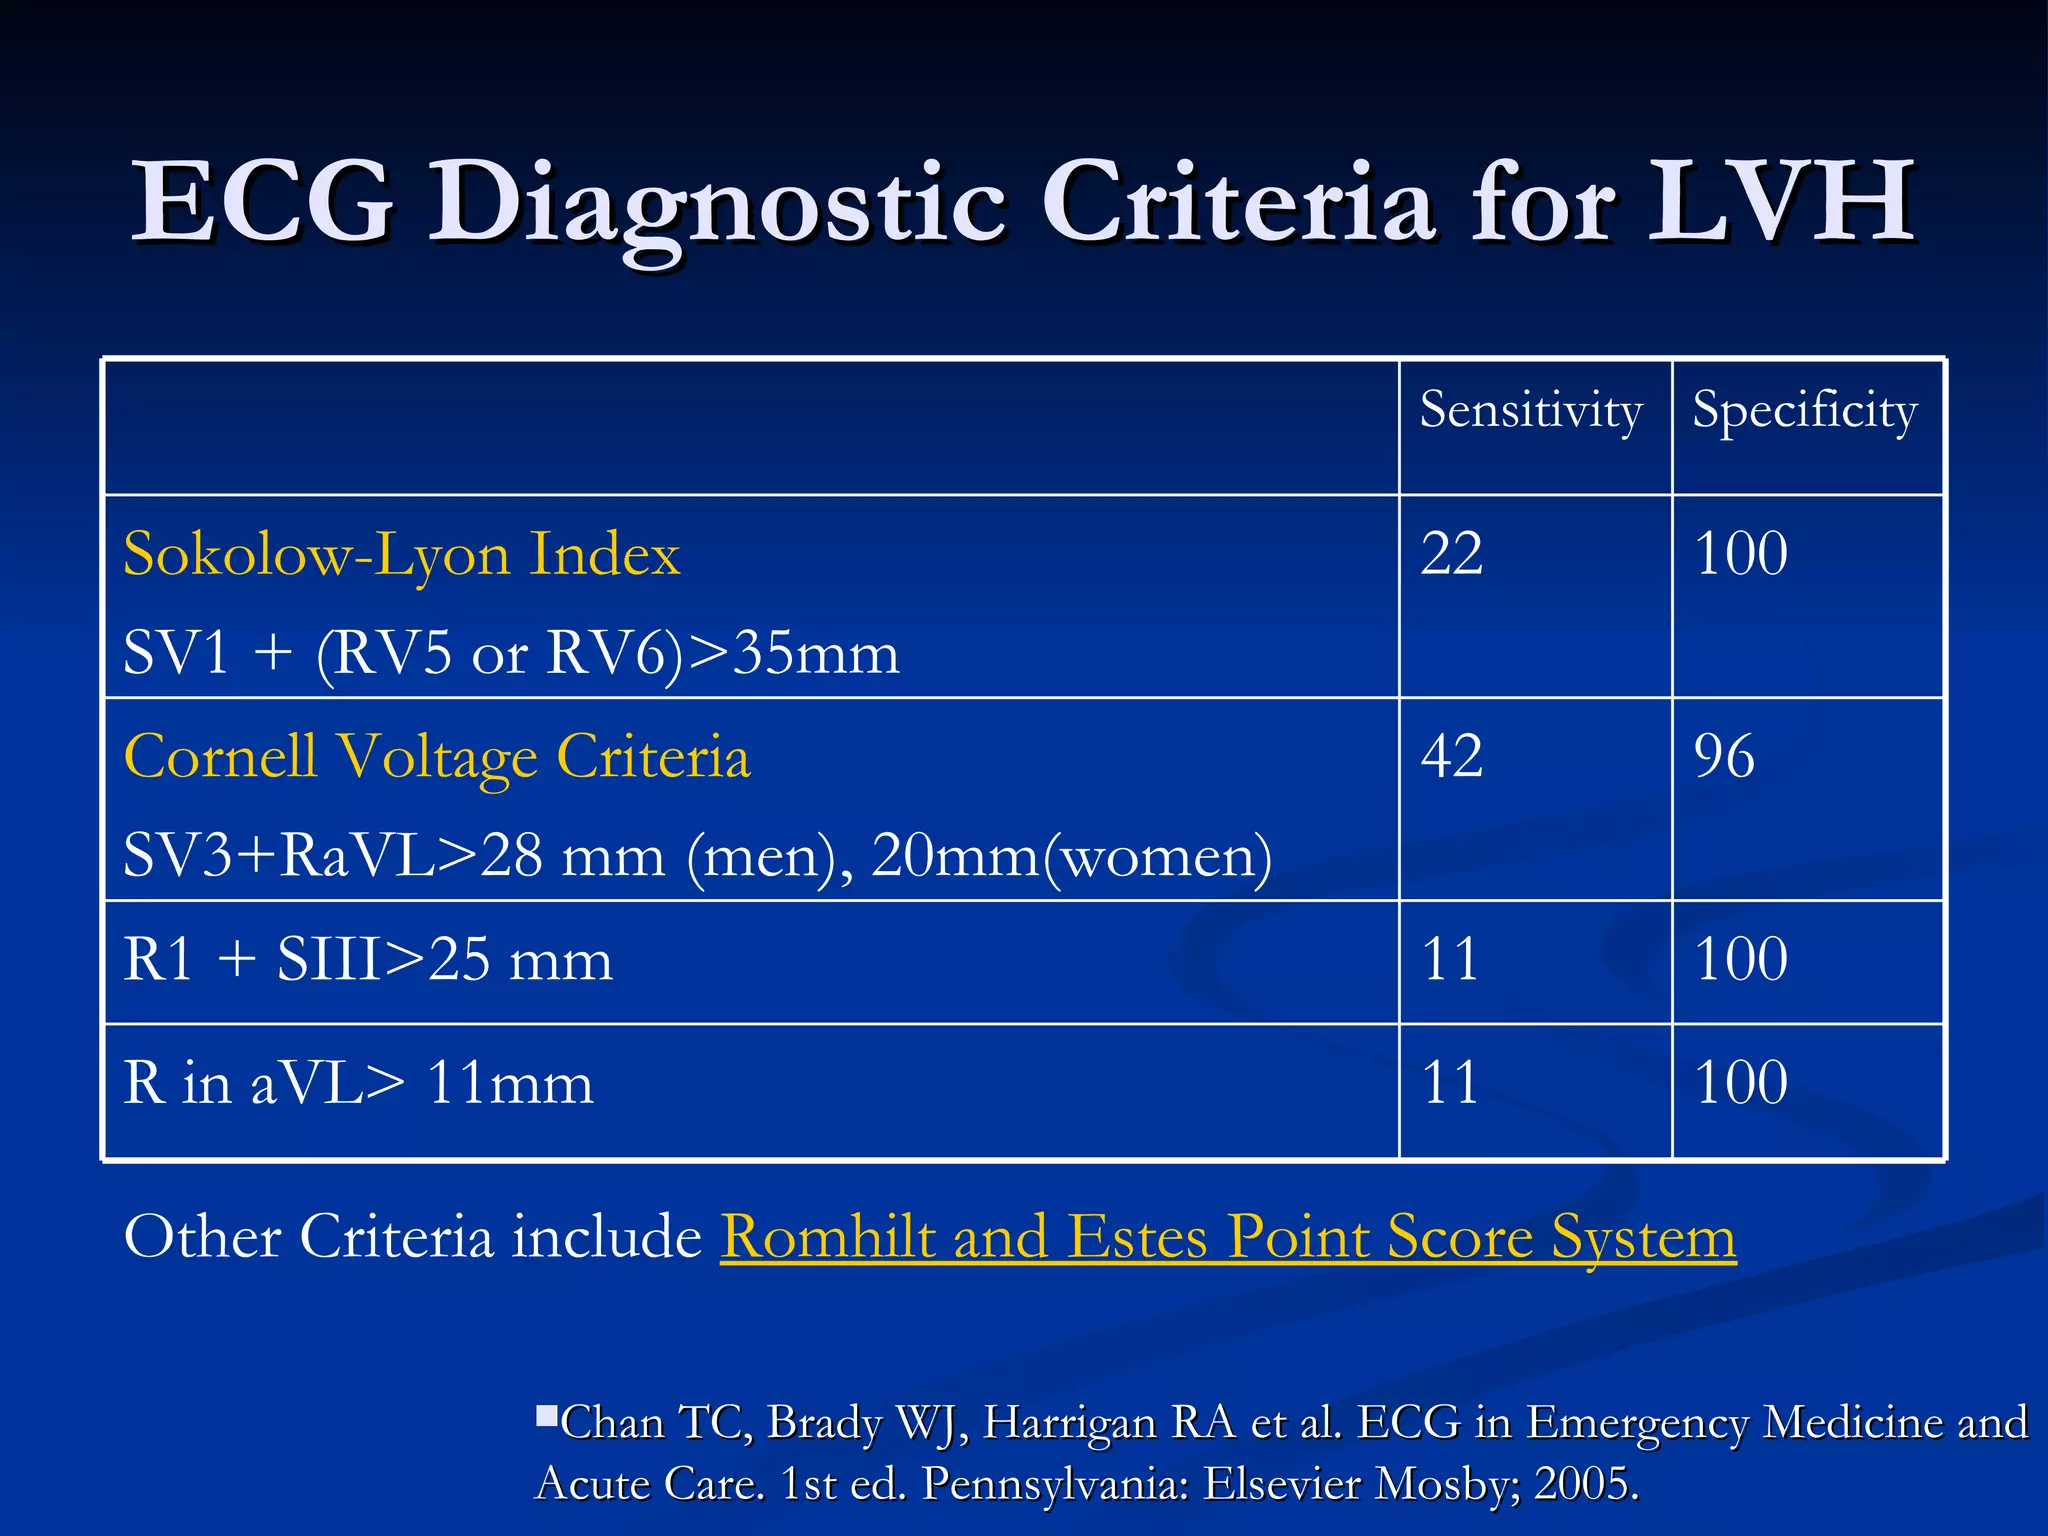
Emphasizes electrical forces in ECG and diagnostics in Left Ventricular Hypertrophy, contrasting with acute coronary syndromes.
Acknowledges that not all ST segment elevations indicate STEMI, promoting comprehensive evaluation of ECG alongside clinical examination.
Provides references to support the studies, guidelines, and criteria discussed throughout the presentation.


