Topics to beCovered
• Understanding STEMI
• STEMI Definition and Criteria
• Recognize that ST segment elevation often not
result of an MI
• Identify the most common STEMI Mimics
• Differentiating STEMI from STEMI Mimics
• STEMI Equivalents
3.
Causes of STelevation
Causes
Acute Myocardial Infarction LVH
Global ischemia Brugada
Early Repolarization Hypothermia
Pericarditis Takotsubo CMP
Vasospasm Hyperkalemia
Ventricular aneurysm WPW
LBBB/ Pacemaker Post-cardioversion
Pulmonary Embolism Raised Intracranial Pressure
4.
STE causes
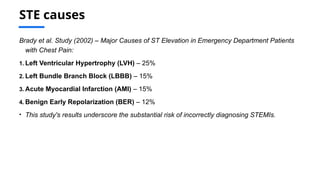
Brady etal. Study (2002) – Major Causes of ST Elevation in Emergency Department Patients
with Chest Pain:
1. Left Ventricular Hypertrophy (LVH) – 25%
2. Left Bundle Branch Block (LBBB) – 15%
3. Acute Myocardial Infarction (AMI) – 15%
4. Benign Early Repolarization (BER) – 12%
• This study's results underscore the substantial risk of incorrectly diagnosing STEMIs.
STEMI Mimics
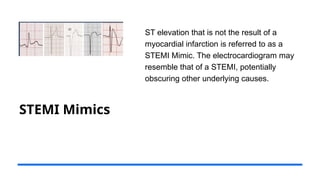
ST elevationthat is not the result of a
myocardial infarction is referred to as a
STEMI Mimic. The electrocardiogram may
resemble that of a STEMI, potentially
obscuring other underlying causes.
7.
Early Repolarization
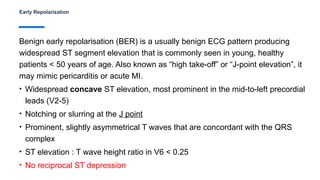
Benign earlyrepolarisation (BER) is a usually benign ECG pattern producing
widespread ST segment elevation that is commonly seen in young, healthy
patients < 50 years of age. Also known as “high take-off” or “J-point elevation”, it
may mimic pericarditis or acute MI.
• Widespread concave ST elevation, most prominent in the mid-to-left precordial
leads (V2-5)
• Notching or slurring at the J point
• Prominent, slightly asymmetrical T waves that are concordant with the QRS
complex
• ST elevation : T wave height ratio in V6 < 0.25
• No reciprocal ST depression
8.
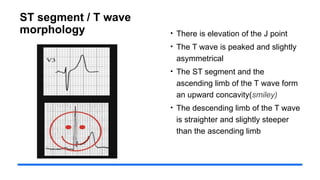
ST segment /T wave
morphology • There is elevation of the J point
• The T wave is peaked and slightly
asymmetrical
• The ST segment and the
ascending limb of the T wave form
an upward concavity(smiley)
• The descending limb of the T wave
is straighter and slightly steeper
than the ascending limb
9.
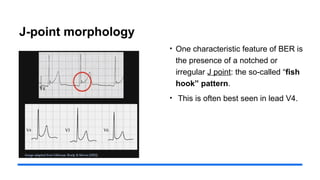
J-point morphology
• Onecharacteristic feature of BER is
the presence of a notched or
irregular J point: the so-called “fish
hook” pattern.
• This is often best seen in lead V4.
Pericarditis
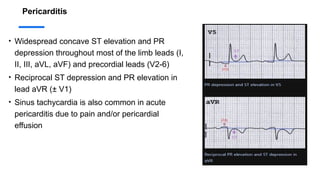
• Widespread concaveST elevation and PR
depression throughout most of the limb leads (I,
II, III, aVL, aVF) and precordial leads (V2-6)
• Reciprocal ST depression and PR elevation in
lead aVR (± V1)
• Sinus tachycardia is also common in acute
pericarditis due to pain and/or pericardial
effusion
13.
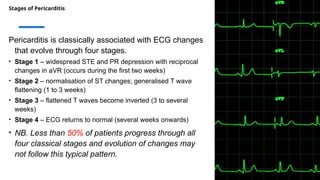
Stages of Pericarditis
Pericarditisis classically associated with ECG changes
that evolve through four stages.
• Stage 1 – widespread STE and PR depression with reciprocal
changes in aVR (occurs during the first two weeks)
• Stage 2 – normalisation of ST changes; generalised T wave
flattening (1 to 3 weeks)
• Stage 3 – flattened T waves become inverted (3 to several
weeks)
• Stage 4 – ECG returns to normal (several weeks onwards)
• NB. Less than 50% of patients progress through all
four classical stages and evolution of changes may
not follow this typical pattern.
14.
STEMI or AcutePericarditis
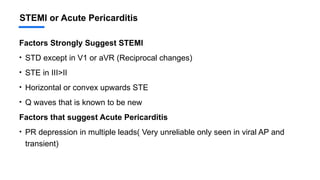
Factors Strongly Suggest STEMI
• STD except in V1 or aVR (Reciprocal changes)
• STE in III>II
• Horizontal or convex upwards STE
• Q waves that is known to be new
Factors that suggest Acute Pericarditis
• PR depression in multiple leads( Very unreliable only seen in viral AP and
transient)
15.
STEMI or AcutePericarditis
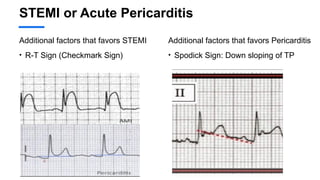
Additional factors that favors STEMI
• R-T Sign (Checkmark Sign)
Additional factors that favors Pericarditis
• Spodick Sign: Down sloping of TP
16.
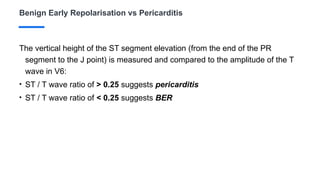
Benign Early Repolarisationvs Pericarditis
The vertical height of the ST segment elevation (from the end of the PR
segment to the J point) is measured and compared to the amplitude of the T
wave in V6:
• ST / T wave ratio of > 0.25 suggests pericarditis
• ST / T wave ratio of < 0.25 suggests BER
17.
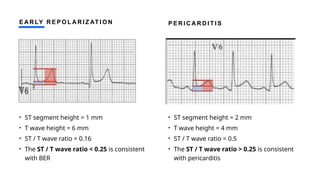
E A RLY R E P O L A R I Z AT I O N
• ST segment height = 1 mm
• T wave height = 6 mm
• ST / T wave ratio = 0.16
• The ST / T wave ratio < 0.25 is consistent
with BER
P E R I C A R D I T I S
• ST segment height = 2 mm
• T wave height = 4 mm
• ST / T wave ratio = 0.5
• The ST / T wave ratio > 0.25 is consistent
with pericarditis
18.
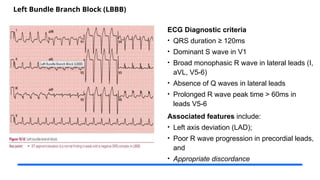
Left Bundle BranchBlock (LBBB)
ECG Diagnostic criteria
• QRS duration ≥ 120ms
• Dominant S wave in V1
• Broad monophasic R wave in lateral leads (I,
aVL, V5-6)
• Absence of Q waves in lateral leads
• Prolonged R wave peak time > 60ms in
leads V5-6
Associated features include:
• Left axis deviation (LAD);
• Poor R wave progression in precordial leads,
and
• Appropriate discordance
19.
Identify AMI inCase of LBBB
Tool/Sign What It Shows Usefulness
Sgarbossa (Modified) Concordance/Discordance ✅ Gold Standard
Cabrera Sign Notched S wave in V3–V4 ⚠️Supportive
Chapman Sign Notched R wave in lateral leads ⚠️Supportive
ST changes in aVR, I, V5–6 Possible posterior or LMCA
ischemia
🔍 Context-dependent
New LBBB + chest pain Suspect AMI Only if previous ECG available
Scarbrough Criteria Looks for Q waves, ST
elevation/depression, T wave
inversions across QRS polarity
🔍 Less validated, but may help
Vereckei Algorithm Uses R wave peak time, QRS
duration, and ST deviation in V1
🧭 Helps distinguish LBBB vs VT
(not AMI)
20.
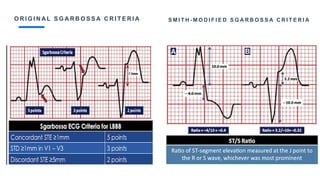
O R IG I N A L S G A R B O S S A C R I T E R I A S M I T H - M O D I F I E D S G A R B O S S A C R I T E R I A
21.
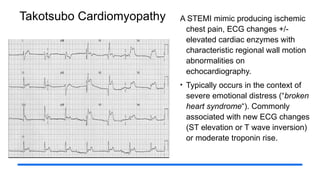
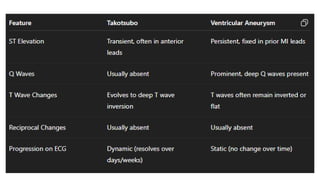
Takotsubo Cardiomyopathy ASTEMI mimic producing ischemic
chest pain, ECG changes +/-
elevated cardiac enzymes with
characteristic regional wall motion
abnormalities on
echocardiography.
• Typically occurs in the context of
severe emotional distress (“broken
heart syndrome“). Commonly
associated with new ECG changes
(ST elevation or T wave inversion)
or moderate troponin rise.
22.
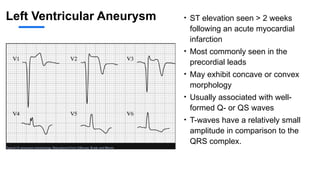
Left Ventricular Aneurysm• ST elevation seen > 2 weeks
following an acute myocardial
infarction
• Most commonly seen in the
precordial leads
• May exhibit concave or convex
morphology
• Usually associated with well-
formed Q- or QS waves
• T-waves have a relatively small
amplitude in comparison to the
QRS complex.
23.
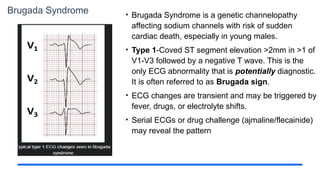
Brugada Syndrome •Brugada Syndrome is a genetic channelopathy
affecting sodium channels with risk of sudden
cardiac death, especially in young males.
• Type 1-Coved ST segment elevation >2mm in >1 of
V1-V3 followed by a negative T wave. This is the
only ECG abnormality that is potentially diagnostic.
It is often referred to as Brugada sign.
• ECG changes are transient and may be triggered by
fever, drugs, or electrolyte shifts.
• Serial ECGs or drug challenge (ajmaline/flecainide)
may reveal the pattern
24.
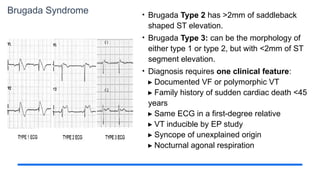
Brugada Syndrome •Brugada Type 2 has >2mm of saddleback
shaped ST elevation.
• Brugada Type 3: can be the morphology of
either type 1 or type 2, but with <2mm of ST
segment elevation.
• Diagnosis requires one clinical feature:
Documented VF or polymorphic VT
▸
Family history of sudden cardiac death <45
▸
years
Same ECG in a first-degree relative
▸
VT inducible by EP study
▸
Syncope of unexplained origin
▸
Nocturnal agonal respiration
▸
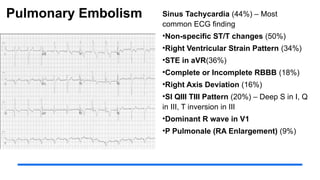
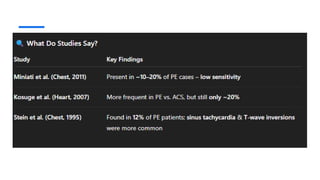
Pulmonary Embolism SinusTachycardia (44%) – Most
common ECG finding
•Non-specific ST/T changes (50%)
•Right Ventricular Strain Pattern (34%)
•STE in aVR(36%)
•Complete or Incomplete RBBB (18%)
•Right Axis Deviation (16%)
•SI QIII TIII Pattern (20%) – Deep S in I, Q
in III, T inversion in III
•Dominant R wave in V1
•P Pulmonale (RA Enlargement) (9%)
27.
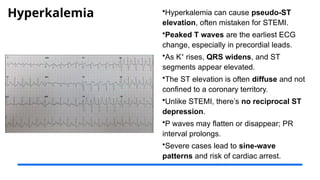
Hyperkalemia •Hyperkalemia cancause pseudo-ST
elevation, often mistaken for STEMI.
•Peaked T waves are the earliest ECG
change, especially in precordial leads.
•As K rises,
⁺ QRS widens, and ST
segments appear elevated.
•The ST elevation is often diffuse and not
confined to a coronary territory.
•Unlike STEMI, there’s no reciprocal ST
depression.
•P waves may flatten or disappear; PR
interval prolongs.
•Severe cases lead to sine-wave
patterns and risk of cardiac arrest.
28.
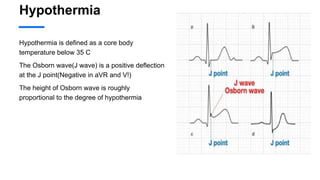
Hypothermia
Hypothermia is definedas a core body
temperature below 35 C
The Osborn wave(J wave) is a positive deflection
at the J point(Negative in aVR and V!)
The height of Osborn wave is roughly
proportional to the degree of hypothermia
29.
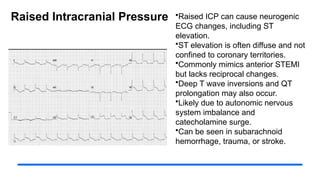
Raised Intracranial Pressure•Raised ICP can cause neurogenic
ECG changes, including ST
elevation.
•ST elevation is often diffuse and not
confined to coronary territories.
•Commonly mimics anterior STEMI
but lacks reciprocal changes.
•Deep T wave inversions and QT
prolongation may also occur.
•Likely due to autonomic nervous
system imbalance and
catecholamine surge.
•Can be seen in subarachnoid
hemorrhage, trauma, or stroke.
30.
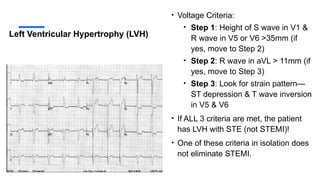
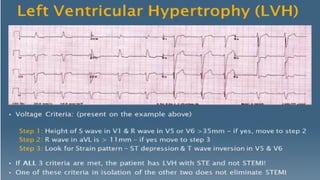
Left Ventricular Hypertrophy(LVH)
• Voltage Criteria:
• Step 1: Height of S wave in V1 &
R wave in V5 or V6 >35mm (if
yes, move to Step 2)
• Step 2: R wave in aVL > 11mm (if
yes, move to Step 3)
• Step 3: Look for strain pattern—
ST depression & T wave inversion
in V5 & V6
• If ALL 3 criteria are met, the patient
has LVH with STE (not STEMI)!
• One of these criteria in isolation does
not eliminate STEMI.
31.
STEMI Equivalent
Coronary arteryocclusion carries a level of severity and clinical urgency comparable to that of
a classic ST-segment elevation myocardial infarction (STEMI), even in cases where the typical
elevation of ≥1 mm in two adjacent leads is not present.
32.
Wellens
Syndrome
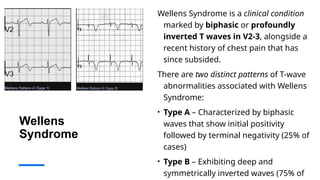
Wellens Syndrome isa clinical condition
marked by biphasic or profoundly
inverted T waves in V2-3, alongside a
recent history of chest pain that has
since subsided.
There are two distinct patterns of T-wave
abnormalities associated with Wellens
Syndrome:
• Type A – Characterized by biphasic
waves that show initial positivity
followed by terminal negativity (25% of
cases)
• Type B – Exhibiting deep and
symmetrically inverted waves (75% of
33.
Wellens Syndrome
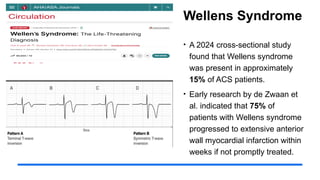
• A2024 cross-sectional study
found that Wellens syndrome
was present in approximately
15% of ACS patients.
• Early research by de Zwaan et
al. indicated that 75% of
patients with Wellens syndrome
progressed to extensive anterior
wall myocardial infarction within
weeks if not promptly treated.
34.
De Winter TWave
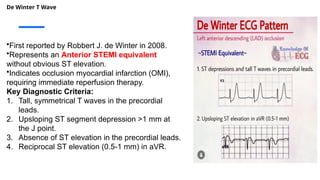
•First reported by Robbert J. de Winter in 2008.
•Represents an Anterior STEMI equivalent
without obvious ST elevation.
•Indicates occlusion myocardial infarction (OMI),
requiring immediate reperfusion therapy.
Key Diagnostic Criteria:
1. Tall, symmetrical T waves in the precordial
leads.
2. Upsloping ST segment depression >1 mm at
the J point.
3. Absence of ST elevation in the precordial leads.
4. Reciprocal ST elevation (0.5-1 mm) in aVR.
35.
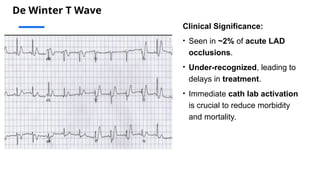
De Winter TWave
Clinical Significance:
• Seen in ~2% of acute LAD
occlusions.
• Under-recognized, leading to
delays in treatment.
• Immediate cath lab activation
is crucial to reduce morbidity
and mortality.
36.
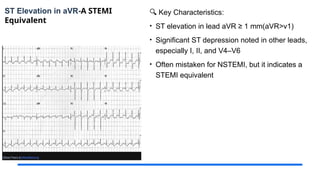
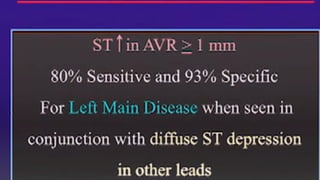
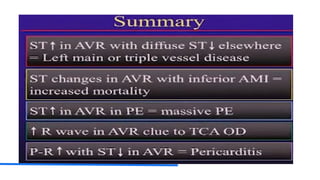
ST Elevation inaVR-A STEMI
Equivalent
🔍 Key Characteristics:
• ST elevation in lead aVR ≥ 1 mm(aVR>v1)
• Significant ST depression noted in other leads,
especially I, II, and V4–V6
• Often mistaken for NSTEMI, but it indicates a
STEMI equivalent
37.
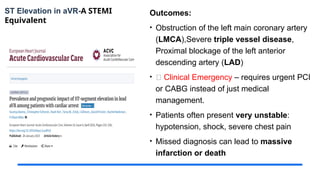
ST Elevation inaVR-A STEMI
Equivalent
Outcomes:
• Obstruction of the left main coronary artery
(LMCA),Severe triple vessel disease,
Proximal blockage of the left anterior
descending artery (LAD)
• 🛑 Clinical Emergency – requires urgent PCI
or CABG instead of just medical
management.
• Patients often present very unstable:
hypotension, shock, severe chest pain
• Missed diagnosis can lead to massive
infarction or death
38.
Key Takeaways
• Accuratediagnosis of STEMI is
crucial for effective treatment.
• Understanding STEMI mimics
ensures proper patient management.
• STEMI equivalents are conditions
that carry the same severity and
clinical urgency as classic STEMI,
even without the typical ST-segment
elevation, requiring urgent cath lab
activation
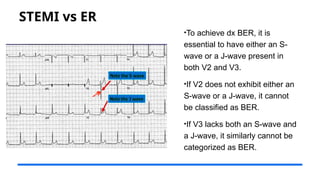
STEMI vs ER
•Toachieve dx BER, it is
essential to have either an S-
wave or a J-wave present in
both V2 and V3.
•If V2 does not exhibit either an
S-wave or a J-wave, it cannot
be classified as BER.
•If V3 lacks both an S-wave and
a J-wave, it similarly cannot be
categorized as BER.
43.
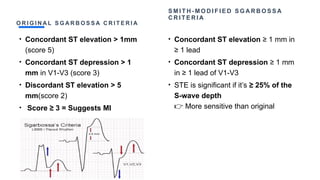
O R IG I N A L S G A R B O S S A C R I T E R I A
• Concordant ST elevation > 1mm
(score 5)
• Concordant ST depression > 1
mm in V1-V3 (score 3)
• Discordant ST elevation > 5
mm(score 2)
• Score ≥ 3 = Suggests MI
S M I T H - M O D I F I E D S G A R B O S S A
C R I T E R I A
• Concordant ST elevation ≥ 1 mm in
≥ 1 lead
• Concordant ST depression ≥ 1 mm
in ≥ 1 lead of V1-V3
• STE is significant if it’s ≥ 25% of the
S-wave depth
More sensitive than original
👉
48.
• Nonspecific ST-Twave abnormalities,
• is frequently used when the clinical data are not available to correlate with the ECG findings.
This does not mean that the ECG changes are unimportant! It is the responsibility of the
clinician providing care for the patient to ascertain the importance of the ECG findings.
Editor's Notes
#1 Generated by Copilot
The title "Unmasking STEMI Mimics and Equivalents" sets the stage for a critical discussion on differentiating true STEMI from conditions that may mimic its presentation. Dr. Seebat Masrur, a cardiology trainee, will guide us through this complex topic, emphasizing the importance of accurate diagnosis in emergency settings. Understanding these distinctions is vital for effective patient management and treatment outcomes.
______
Generated by Copilot
This presentation begins with a critical comparison of STEMI and its mimics, emphasizing the importance of accurate diagnosis and effective management. Dr. Seebat Masrur, a cardiology fellow, leads us through this topic, highlighting the role of ECG in identifying true STEMI cases. The accompanying ECG image serves as a visual aid to illustrate the cardiac activity that is central to our understanding of these conditions. As we delve into this subject, keep in mind the implications of misdiagnosis and the need for vigilance in interpreting ECG results.
---
This presentation aims to clarify the distinctions between ST-Elevation Myocardial Infarction (STEMI) and its mimics. We will explore definitions, clinical presentations, diagnostic tools, and management strategies to ensure accurate diagnosis and effective treatment.
#2 Generated by Copilot
This slide outlines the key topics we will cover today. We will start with a foundational understanding of STEMI, including its definition and diagnostic criteria. It's crucial to recognize that ST segment elevation can occur without myocardial infarction, which leads us to identify common STEMI mimics and how to differentiate them from true STEMI. We will also touch on STEMI equivalents, which are important to recognize in clinical practice.
______
"Assalamualaikum. Good morning, esteemed professors, colleagues, and juniors. Thank you for joining me today to discuss an important cardiology topic: distinguishing STEMI mimics and equivalents. It is crucial in our practice to differentiate true STEMI from other conditions that look similar on an ECG but require different management. We'll highlight key diagnostic tips to avoid misinterpretations and ensure optimal patient care."
#3 Generated by Copilot
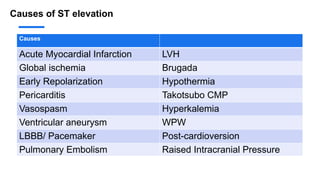
Here, we present a comprehensive table listing various causes of ST elevation. Each condition, from Acute Myocardial Infarction to Brugada syndrome, highlights the complexity of interpreting ECG results. Understanding these causes is essential for clinicians to avoid misdiagnosis and ensure appropriate treatment. Pay attention to how these conditions can overlap in presentation, which underscores the need for careful evaluation.
______
While Acute Myocardial Infarction is the most common cause, conditions like Left Ventricular Hypertrophy, Global Ischemia, Brugada syndrome, and Early Repolarization can mimic it. Factors like Hypothermia, Pericarditis, Takotsubo Cardiomyopathy, Vasospasm, Hyperkalemia, and Pulmonary Embolism also contribute. Accurate diagnosis depends on recognizing these conditions in a clinical context.
#4 Generated by Copilot
The findings from the Brady et al. study provide valuable insights into the major causes of ST elevation in emergency department patients. Notably, Left Ventricular Hypertrophy (LVH) and Left Bundle Branch Block (LBBB) are significant contributors, alongside Acute Myocardial Infarction. This data emphasizes the risk of misdiagnosing STEMIs, highlighting the need for thorough assessment and consideration of these common mimics in practice.
______
#5 Generated by Copilot
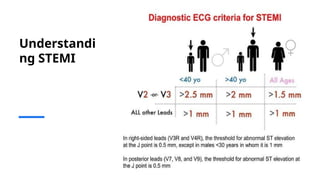
This slide focuses on the diagnostic ECG criteria for STEMI, detailing specific thresholds for different age groups and lead placements. Understanding these criteria is crucial for accurate diagnosis, as they guide clinicians in identifying true STEMI cases. The thresholds vary by lead and age, which is important to remember when interpreting ECGs in diverse patient populations.
______
Generated by Copilot
The focus here is on the diagnostic criteria for STEMI, which are essential for accurate identification. The table outlines specific thresholds for different age groups and lead placements, providing a clear framework for clinicians. For instance, the varying thresholds for V2 and V3 leads highlight the importance of age in interpreting ECG results. This information is crucial for ensuring timely and appropriate interventions, as misinterpretation can lead to significant delays in treatment.
______
STEMI is a serious condition that occurs when blood flow to a part of the heart is blocked. Understanding its definition and pathology is crucial for timely intervention.
#6 Generated by Copilot
STEMI mimics can present with ST elevation that is not due to myocardial infarction. This slide emphasizes the importance of recognizing these patterns on the ECG, as they can obscure underlying conditions. Understanding the characteristics of these mimics is essential for accurate diagnosis and appropriate management, ensuring that patients receive the correct treatment based on their actual condition.
______
Generated by Copilot
In this slide, we delve into the concept of STEMI mimics, which are conditions that can present with ST elevation but are not caused by a myocardial infarction. Understanding these mimics is critical, as they can obscure the true underlying issues and lead to misdiagnosis. The ECG may appear similar to a STEMI, making it essential for clinicians to maintain a high index of suspicion and consider alternative diagnoses when interpreting these readings.
______
#7 Generated by Copilot
Benign early repolarization (BER) is a common ECG pattern seen in younger patients, often mistaken for more serious conditions like pericarditis or acute myocardial infarction. This slide outlines the key features of BER, including the characteristic ST segment elevation and T wave morphology. Recognizing these patterns is crucial for avoiding unnecessary interventions in otherwise healthy individuals.
______
Generated by Copilot
Benign early repolarization (BER) is an important ECG pattern to recognize, especially in younger patients under 50. It's crucial to differentiate it from more serious conditions like pericarditis or acute myocardial infarction, as the ST segment elevation can be misleading. The characteristics of BER include widespread concave ST elevation, particularly in leads V2 to V5, and notable features such as notching or slurring at the J point. Additionally, the T waves are typically asymmetrical but remain concordant with the QRS complex. A key diagnostic criterion is the ST elevation to T wave height ratio in lead V6, which should be less than 0.25, and the absence of reciprocal ST depression further supports the diagnosis of BER. Understanding these nuances can aid in accurate interpretation and prevent unnecessary interventions.
______
#8 Generated by Copilot
This slide elaborates on the morphology of the ST segment and T wave in ECG readings. The characteristics described here, such as the elevation of the J point and the shape of the T wave, are critical for distinguishing between various cardiac conditions. Understanding these nuances can aid in accurate diagnosis and improve patient outcomes in clinical practice.
______
#9 Generated by Copilot
The J-point morphology, particularly the 'fish hook' pattern, is a distinctive feature of benign early repolarization. This slide highlights its significance in the context of ECG interpretation, especially in lead V4. Recognizing this pattern can help clinicians differentiate between benign and pathological conditions, reducing the risk of misdiagnosis.
______
Generated by Copilot
In this slide, we focus on the J-point morphology, particularly in the context of Bradypneaie (BER). A key feature to note is the irregular or notched J point, commonly referred to as the 'fish hook' pattern. This distinctive morphology is crucial for diagnosis and is most clearly observed in lead V4 of the ECG. The accompanying images illustrate this pattern, with the significant features highlighted in red for clarity. Understanding this morphology can aid in identifying underlying cardiac conditions, making it an essential aspect of ECG interpretation.
______
#10 Generated by Copilot
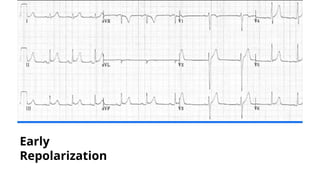
This slide presents an ECG image illustrating the characteristics of early repolarization. The visual representation reinforces the concepts discussed previously, providing a clear example of how these patterns appear in practice. Understanding these features is essential for clinicians to make informed decisions based on ECG findings.
______
ECG of Benign Early Repolarisation (BER), demonstrating:
1) Generalised concave ST elevation in precordial (V2-6) and limb leads (I, II, III, aVF)
2) J-point notching is evident in the inferior leads (II, III and aVF)
3) ST elevation : T wave ratio < 0.25 in V6
#11 While Benign Early Repolarization (BER) is often considered a harmless ECG pattern, the term ‘benign’ is actually a misnomer. Recent studies have shown that BER can be associated with a higher risk of arrhythmias, including ventricular fibrillation (VF), and may lead to sudden cardiac death. Therefore, it's important to not overlook the potential danger posed by BER, especially in patients with a history of heart disease or other risk factors.”
#12 “Acute pericarditis typically presents with widespread concave ST elevation and PR depression across most limb leads (I, II, III, aVL, aVF) and precordial leads (V2-V6). Reciprocal ST depression and PR elevation may also be seen in lead aVR and possibly V1. Additionally, sinus tachycardia is common in acute pericarditis, often due to pain or the presence of pericardial effusion.
#13 Generated by Copilot
The stages of pericarditis are outlined here, detailing the evolution of ECG changes over several weeks. Understanding these stages is important for clinicians, as it helps in monitoring the condition and anticipating potential complications. The slide also notes that not all patients will progress through all stages, which is a critical consideration in clinical practice.
______
#14 “It can be a dilemma to differentiate between STEMI and acute pericarditis, as both conditions can present with similar ECG changes. However, certain factors strongly suggest STEMI, including significant ST depression (STD) in all leads except V1 or aVR, ST elevation in lead III greater than in lead II, horizontal or upward convex ST elevation, and the presence of new Q waves. In contrast, acute pericarditis is suggested by PR depression in multiple leads, though this is very unreliable and typically only seen in viral acute pericarditis and is transient.”
#15 “There are additional signs that can aid in differentiating between STEMI and pericarditis, such as the R-T sign (also known as the checkmark sign). In this sign, the R wave forms a dome-like ST segment before it touches the baseline, which is specific for STEMI. On the other hand, the Spodick sign, characterized by a downward sloping of the TP segment, is specific for pericarditis. However, these signs are less reliable and should only be considered as supplementary to the previously mentioned diagnostic criteria.
#16 As I previously mentioned, distinguishing between STEMI and pericarditis or STEMI and BER is crucial. However, when it comes to differentiating ER from pericarditis, the ST/T ratio plays a key role. A ratio greater than 0.25 suggests pericarditis, while a ratio less than 0.25 is more indicative of early repolarization."
#17 In Early repolarization, the ST segment height is typically 1 mm, and the T wave height is 6 mm, resulting in an ST/T ratio of 0.16, which is consistent with ER. In contrast, pericarditis shows a higher ST segment height of 2 mm and a T wave height of 4 mm, giving an ST/T ratio of 0.5, which is consistent with pericarditis.
#18 Left Bundle Branch Block (LBBB) is another condition that presents a diagnostic dilemma when determining whether ST elevation (STE) is significant. It is characterized by a wide QRS complex, a dominant S wave in V1, and a broad R wave in the lateral leads, often with a left axis deviation (LAD). However, there are no Q waves, especially in the lateral leads. If Q waves are present in the lateral leads, it suggests a STEMI equivalent, specifically for a septal myocardial infarction.
#19 To resolve this dilemma, several scoring systems and criteria exist. New-onset LBBB is often considered indicative of AMI. However, in the context of our country, obtaining a previous ECG is challenging unless the patient develops LBBB during admission. Among these scoring systems, the modified Sgarbossa criteria is regarded as the gold standard because the sensitivity is above 50% and specificity is above 95%
#20 Original Sgarbossa Criteria and the Smith-Modified Sgarbossa Criteria, both used to diagnose acute MI in patients with LBBB.
On the left, original Sgarbossa uses a point system—concordant STE ≥1mm scores highest. However, it's not very sensitive but simpler
On the right, the modified version by Dr. Smith improves sensitivity by using the ST/S ratio. If the ST elevation is ≥25% of the depth of the S wave, it’s considered significant. Its more accurate
#21 Ventricular aneurysm causes persistent ST elevation >2 weeks post-MI, usually in precordial leads as aneurysm is common in Anterior MI, with concave or convex morphology, well-formed Q/QS waves, and low-amplitude T-waves. Unlike Takotsubo, it follows a prior MI and shows permanent Q waves, while Takotsubo lacks Q waves and is reversible.
#22 ST elevation observed more than 2 weeks after an acute myocardial infarction (MI), commonly seen in the precordial leads as it commonly happen with anterior MI. This ST elevation may present with either concave or convex morphology and is typically associated with well-formed Q- or QS waves, indicating a previous infarction. This persistent ST elevation is a characteristic feature in the recovery phase following an MI.
#23 Brugada Syndrome is a genetic sodium channelopathy associated with a high risk of sudden cardiac death, particularly in young males. The hallmark ECG finding is Type 1 Brugada pattern—coved ST segment elevation >2 mm in V1–V3, followed by a negative T wave. This is the only ECG pattern considered diagnostic and is known as the Brugada sign. ECG changes can be transient, often unmasked by fever, certain medications, or electrolyte imbalances. If the baseline ECG is inconclusive, serial ECGs or a sodium channel blocker challenge using ajmaline or flecainide may help reveal the diagnostic pattern.
#24 Brugada Type 2 shows >2 mm saddleback ST elevation; Type 3 has similar shape but <2 mm and is not diagnostic. Diagnosis requires ECG plus one clinical feature—such as VF, sudden cardiac death in a relative <45, similar ECG in family, inducible VT, unexplained syncope, or nocturnal agonal breathing.
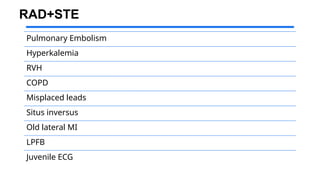
#25 There are several causes of RAD with ST elevation, but the most potentially life-threatening are hyperkalemia and pulmonary embolism. There recognition is crucial
#26 Pulmonary embolism can present with various ECG changes, though none are specific. Sinus tachycardia (44%) is the most common finding. Non-specific ST/T changes are seen in about half of cases. The right ventricular strain pattern (34%), and ST elevation in aVR (36%), reflect acute right heart overload. RBBB (18%), right axis deviation (16%), and the classic S1Q3T3 pattern (20%) may be present. Other signs include a dominant R wave in V1 and P pulmonale (9%), indicating right atrial enlargement. Recognizing this pattern helps raise suspicion for PE in the right clinical setting.
#27 Hyperkalemia can cause pseudo-ST elevation, often mistaken for STEMI, making accurate interpretation critical. The earliest sign is peaked T waves, especially in the precordial leads. As potassium levels rise, the QRS complex widens, and ST segments may appear elevated, often diffusely rather than in a specific vascular territory. Unlike true STEMI, there’s no reciprocal ST depression. P waves may flatten or disappear, and PR prolongation can occur. In severe cases, a sine-wave pattern may develop, signaling imminent cardiac arrest
#28 Hypothermia, defined as a core temperature <35°C, produces the characteristic Osborn (J) wave, that is a positive deflection at the J point—it is most prominent as hypothermia worsens.
#29 Raised ICP can trigger neurogenic ECG changes, including ST elevation, often mimicking anterior STEMI but without reciprocal changes. Other findings may include deep T wave inversions and QT prolongation, likely due to autonomic surge and catecholamine excess. Unlike true MI, there's no coronary obstruction
This ECG shows diffuse ST elevation in an 18-year-old girl with severe traumatic brain injury and massively raised intracranial pressure (30–40 mmHg) managing this with fibrinolysis would have been disasterous
#30 To diagnose LVH with STE, check the S wave in V1 and R wave in V5/V6 (both >35mm), then ensure the R wave in aVL is >11mm. Finally, look for ST depression and T wave inversion in V5/V6. If all three criteria are met, it's LVH with STE, not STEMI. One criterion alone does not rule out STEMI.
#31 Coronary artery occlusion carries a level of severity and clinical urgency comparable to that of a classic ST-segment elevation myocardial infarction (STEMI), even in cases where the typical elevation of ≥1 mm in two adjacent leads is not present.
#32 Wellens Syndrome is characterized by biphasic or profoundly inverted T waves in V2 and V3, usually in a patient with a recent history of chest pain that has since resolved. There are two patterns of T-wave abnormalities:
Type A: Biphasic T waves with initial positivity followed by terminal negativity (25% of cases).
Type B: Deep and symmetric T wave inversions (75% of cases).
This syndrome indicates a high risk for anterior wall myocardial infarction and requires immediate intervention.
#33 A 2024 cross-sectional study found that Wellens syndrome was present in about 15% of ACS patients. Early research by de Zwaan et al. showed that 75% of patients with Wellens syndrome developed extensive anterior wall myocardial infarction within weeks if not treated promptly. Notably, T-wave changes can evolve from a Type A (biphasic) to a Type B (deeply inverted) pattern over time, indicating worsening ischemia. Immediate intervention is critical to prevent progression.
#34 De Winter T Waves were first described by Robbert J. de Winter in 2008 and represent an anterior STEMI equivalent without the typical ST elevation. This pattern indicates occlusion myocardial infarction (OMI) and requires immediate reperfusion therapy. Key diagnostic features include tall, symmetrical T waves in the precordial leads, upslope ST segment depression >1 mm at the J point, and absence of ST elevation in the precordial leads. Additionally, reciprocal ST elevation of 0.5-1 mm is seen in aVR.
#35 ECG shows upward slope in ST depression observed in precordial leads, exceeding 1mm at the J point. T waves appear peaked in leads V2 through V6, beginning below the isoelectric baseline. A slight ST elevation is noted in lead aVR, measuring greater than 0.5mm. This pattern is seen in approximately **2% of acute LAD occlusions. It is often under-recognized, leading to delays in treatment. Immediate cath lab activation is essential to reduce morbidity and mortality, as timely reperfusion can prevent extensive myocardial damage.
#36 ST elevation in aVR ≥ 1 mm (aVR > V1) is a key diagnostic feature, often accompanied by significant ST depression in leads I, II, and V4–V6. While aVR was historically neglected, recent research has shown its increasing value in diagnosing severe coronary artery disease. This pattern is often mistaken for NSTEMI, but it indicates a STEMI equivalent,
#37 ST elevation in aVR indicates severe coronary artery occlusion, often related to left main coronary artery (LMCA) obstruction, severe triple vessel disease, or proximal LAD blockage. This pattern is a clinical emergency requiring urgent PCI or CABG, not just medical management. Patients often present in a very unstable state, with hypotension, shock, and severe chest pain. A missed diagnosis can lead to massive infarction or death. A 2023 study published in EHJ – Acute Cardiovascular Care found that 18.3% of acute coronary syndrome patients had ST elevation in aVR, and these patients were more likely to suffer out-of-hospital cardiac arrest and experience higher mortality rates.
#38 In summary, the accurate diagnosis of STEMI plays a critical role in initiating timely treatment, which can significantly improve patient outcomes. Understanding the various STEMI mimics is essential for clinicians to avoid misdiagnosis and ensure appropriate management. Finally, employing the right diagnostic tools effectively enhances patient care and reduces the risk of complications.
#40 Generated by Copilot
There's no content in this slide for me to generate speaker notes
______
#41 Generated by Copilot
This slide outlines the criteria for diagnosing BER, emphasizing the necessity of specific waveforms in leads V2 and V3. Understanding these criteria is crucial for accurate diagnosis, as misclassification can lead to inappropriate management. The accompanying ECG image reinforces these concepts visually.
______
#42 Generated by Copilot
There's no content in this slide for me to generate speaker notes
______
#43 Generated by Copilot
This slide compares the original and Smith-modified Sgarbossa criteria, highlighting their respective thresholds for diagnosing myocardial infarction. Understanding these criteria is essential for clinicians to accurately interpret ECGs in patients with LBBB, ensuring timely and appropriate treatment.
______
#44 Generated by Copilot
The slide summarizes key findings from studies on the prevalence of certain conditions in patients with pulmonary embolism. Understanding these statistics is crucial for clinicians to recognize the potential complications associated with PE and to guide appropriate management strategies.
______
#45 Generated by Copilot
This slide presents diagnostic guidelines for Left Main Disease, emphasizing the significance of ST depression in conjunction with other leads. Understanding these criteria is vital for accurate diagnosis, as they can significantly impact patient management and treatment outcomes.
______
#46 Generated by Copilot
The summary slide highlights important observations regarding ST segment changes and their implications for various cardiac conditions. Recognizing these patterns is essential for clinicians to make informed decisions and improve patient outcomes in emergency settings.
______
#47 Generated by Copilot
There's no content in this slide for me to generate speaker notes
______
#48 Generated by Copilot
This slide discusses the role of nonspecific ST-T wave abnormalities in ECG interpretation. It emphasizes the importance of correlating these findings with clinical data, reminding clinicians that even nonspecific changes can have significant implications for patient care.
______
Generated by Copilot
This slide addresses nonspecific ST-T wave abnormalities, which often arise when clinical data is lacking to correlate with ECG findings. It's important to note that these abnormalities should not be dismissed as unimportant. Clinicians must take responsibility for interpreting these findings within the broader context of patient care. Understanding the significance of these ECG changes is essential for making informed clinical decisions and ensuring comprehensive patient management.
______


![ONFH[AVN HIP] -TRIPLE REGIME -A NOVAL SURGICAL CONCEPT .pptx](https://cdn.slidesharecdn.com/ss_thumbnails/onfhavnhip2026koaconcalicutdrgokuldevdrmashraf-260210064517-213ec005-thumbnail.jpg?width=640&height=640&fit=bounds)


