Downloaded 163 times
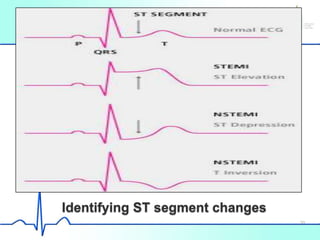
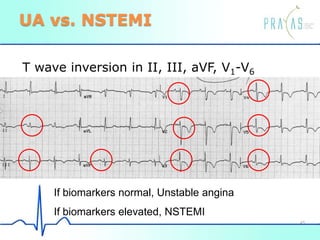
![Unstable angina/NSTEMI
ECG ST-segment depression or prominent T-
wave inversion and/or positive biomarkers
of necrosis in absence of ST-segment
elevation and appropriate clinical setting
(chest discomfort or anginal equivalent)
NSTEMI if elevated biomarkers present
(Troponin T, Troponin I or Creatine Kinase-
MB [CK-MB])
44](https://image.slidesharecdn.com/ecg-part1superfinal-130628062133-phpapp01/85/Ecg-44-320.jpg)


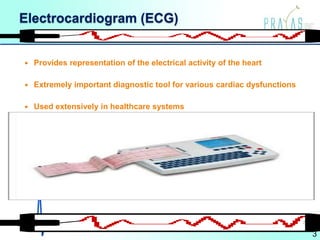
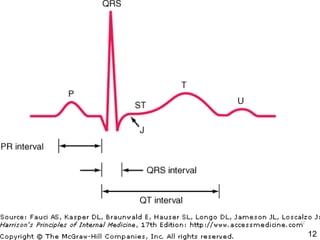
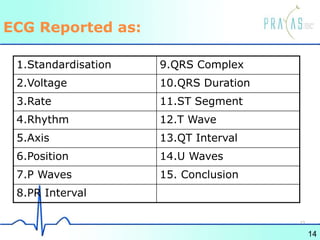
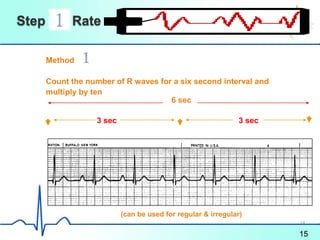
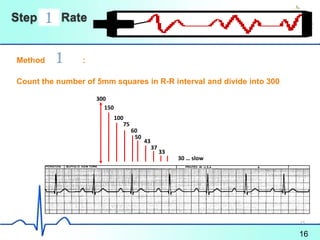
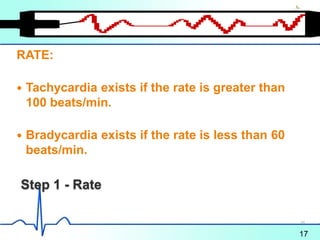
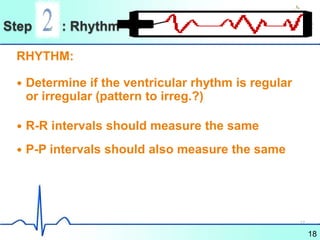
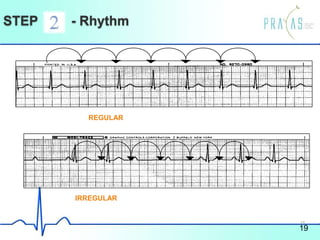
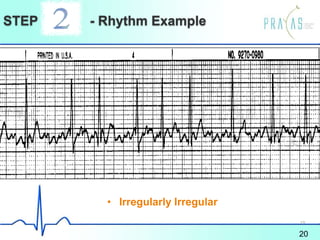
The document provides an overview of electrocardiogram (ECG) interpretation. It discusses how ECG is an important diagnostic tool that represents the heart's electrical activity. It then covers the steps for interpreting an ECG, including assessing the rate, rhythm, P waves, PR interval, QRS duration, ST segments, T waves, and changes that can indicate conditions like myocardial infarction. The document emphasizes how analyzing ECG findings can provide clinical insights, such as determining whether a patient may benefit from interventions like thrombolysis.


