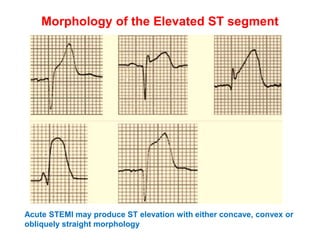
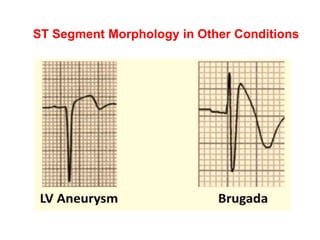
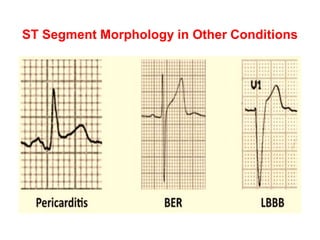
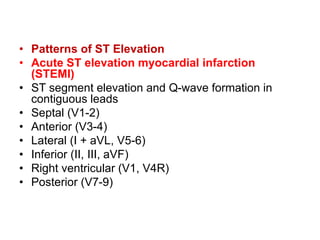
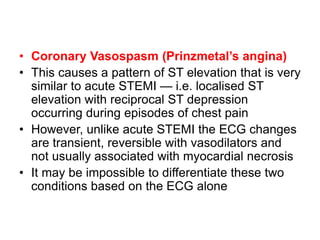
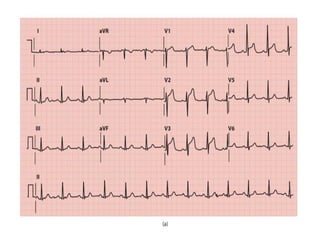
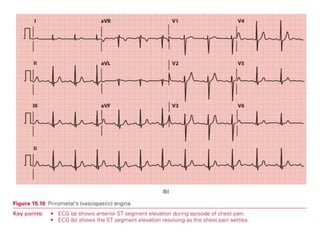
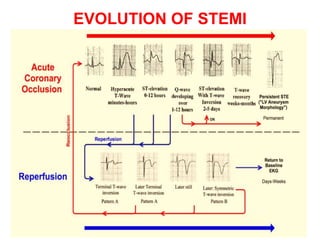
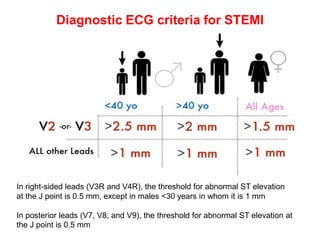
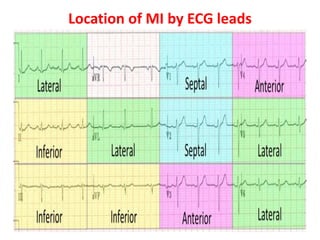
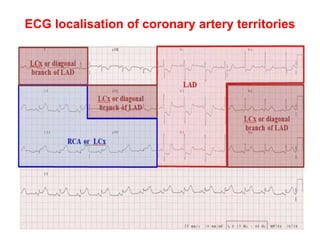
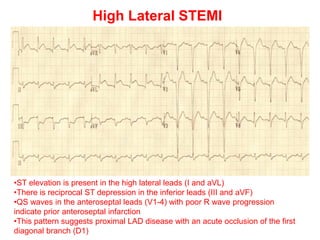
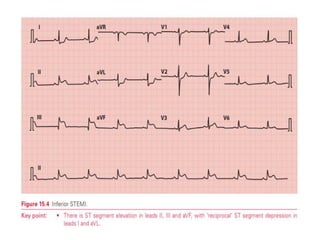
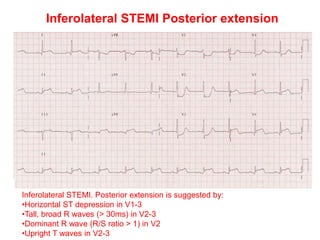
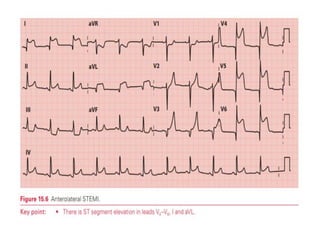
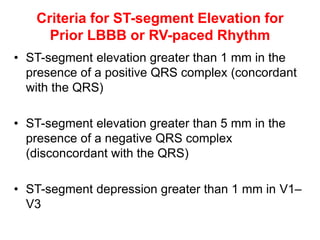
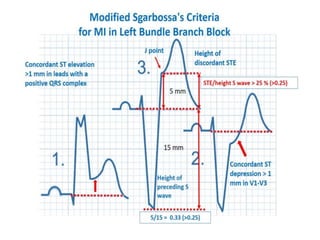
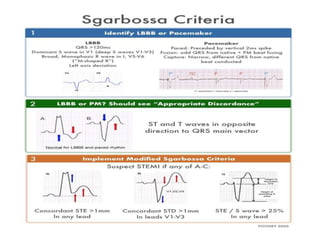
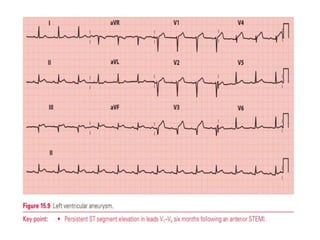
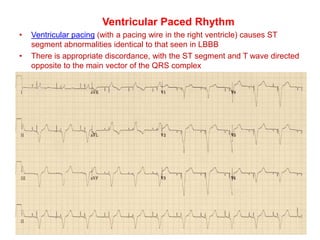
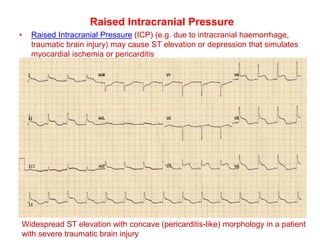
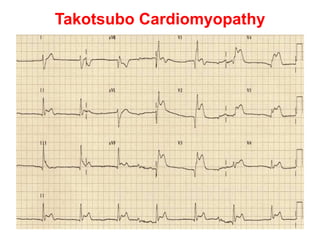
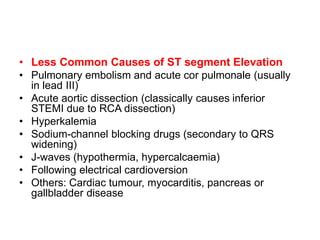
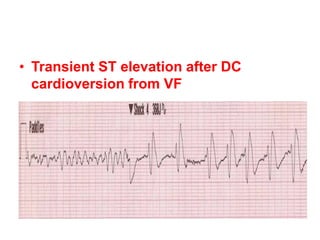
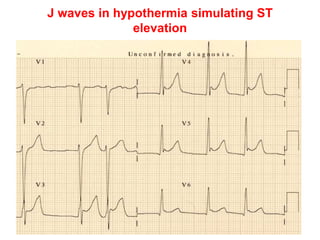
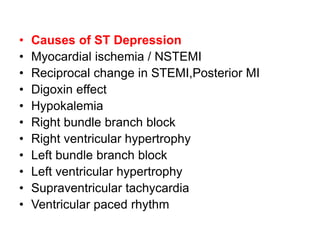
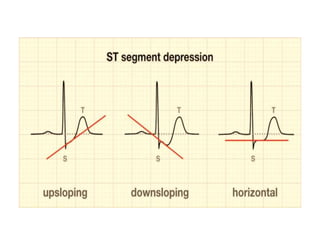
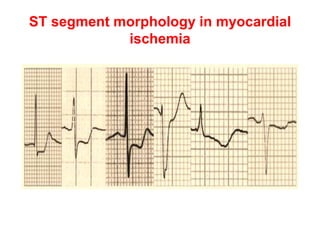
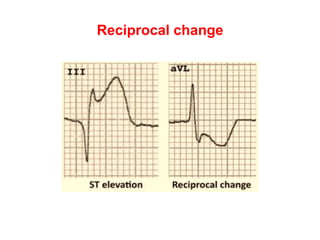
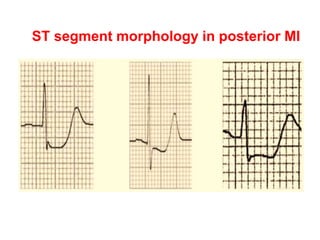
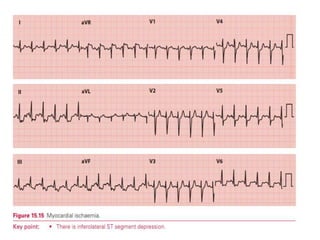
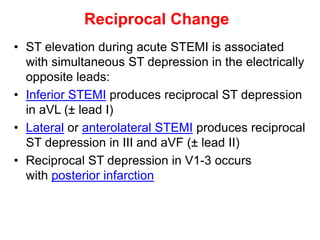
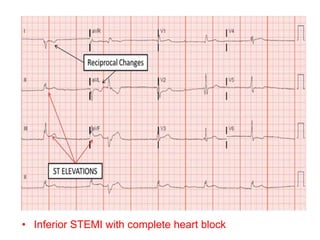
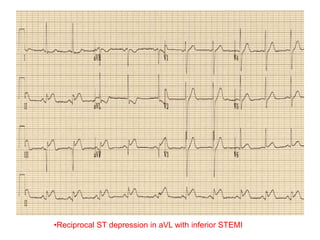
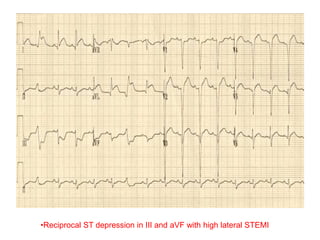
ST SEGMENT
Dr.G.VENKATA RAMANA
MBBS DNB FAMILY MEDICINE
• ST Segment
• Flat, isoelectric section of the ECG between the
end of the S wave (the J point) and the
beginning of the T wave
• Represents the interval between ventricular
depolarization and repolarization
• The most important cause of ST segment
abnormality (elevation or depression)
is myocardial ischaemia or infarction
• Causes of ST Segment Elevation
• ST segment elevation myocardial infarction
• Coronary vasospasm (Printzmetal’s angina)
• Pericarditis
• Benign early repolarization
• Brugada syndrome
• Left bundle branch block
• Left ventricular hypertrophy
• Ventricular aneurysm
• Ventricular paced rhythm
• Raised intracranial pressure
• Takotsubo Cardiomyopathy
Morphology of the Elevated ST segment
Acute STEMI may produce ST elevation with either concave, convex or
obliquely straight morphology
ST Segment Morphology in Other Conditions
• Patterns of ST Elevation
• Acute ST elevation myocardial infarction
(STEMI)
• ST segment elevation and Q-wave formation in
contiguous leads
• Septal (V1-2)
• Anterior (V3-4)
• Lateral (I + aVL, V5-6)
• Inferior (II, III, aVF)
• Right ventricular (V1, V4R)
• Posterior (V7-9)
• Coronary Vasospasm (Prinzmetal’s angina)
• This causes a pattern of ST elevation that is very
similar to acute STEMI — i.e. localised ST
elevation with reciprocal ST depression
occurring during episodes of chest pain
• However, unlike acute STEMI the ECG changes
are transient, reversible with vasodilators and
not usually associated with myocardial necrosis
• It may be impossible to differentiate these two
conditions based on the ECG alone
EVOLUTION OF STEMI
Diagnostic ECG criteria for STEMI
In right-sided leads (V3R and V4R), the threshold for abnormal ST elevation
at the J point is 0.5 mm, except in males <30 years in whom it is 1 mm
In posterior leads (V7, V8, and V9), the threshold for abnormal ST elevation at
the J point is 0.5 mm
Location of MI by ECG leads
ECG localisation of coronary artery territories
High Lateral STEMI
•ST elevation is present in the high lateral leads (I and aVL)
•There is reciprocal ST depression in the inferior leads (III and aVF)
•QS waves in the anteroseptal leads (V1-4) with poor R wave progression
indicate prior anteroseptal infarction
•This pattern suggests proximal LAD disease with an acute occlusion of the first
diagonal branch (D1)
Inferolateral STEMI Posterior extension
Inferolateral STEMI. Posterior extension is suggested by:
•Horizontal ST depression in V1-3
•Tall, broad R waves (> 30ms) in V2-3
•Dominant R wave (R/S ratio > 1) in V2
•Upright T waves in V2-3
Inferolateral STEMI Posterior extension
Marked ST elevation in V7-9 with Q-wave formation confirms involvement of
the posterior wall, making this an inferior-lateral-posterior STEMI (= big territory
infarct!)
Right ventricular infarction
• In patients with inferior STEMI, right ventricular
infarction is suggested by:
• ST elevation in V1
• ST elevation in V1 and ST depression in V2
(highly specific for RV infarction)
• Isoelectric ST segment in V1 with marked ST
depression in V2
• ST elevation in III > II
• Diagnosis is confirmed by the presence of
ST elevation in the right-sided leads (V3R-
V6R)
Inferior STEMI Right ventricular infarction
Inferior STEMI Right ventricular infarction is suggested by:
•ST elevation in V1
•ST elevation in lead III > lead II
Repeat ECG of the same patient with V4R
electrode position
•There is ST elevation in V4R consistent with RV infarction
• Another example of right ventricular infarction in the context of inferior STEMI:
• ST elevation in lead III > lead II
• Isoelectric ST segment in V1 with marked ST depression in V2
• There is ST elevation in V4R
Hyperacute Anteroseptal STEMI
Hyperacute Anteroseptal STEMI:
•ST elevation and hyperacute T waves in V2-4
•ST elevation in I and aVL with reciprocal ST depression in lead III
•Q waves are present in the septal leads V1-2
•These features indicate a hyperacute anteroseptal STEMI
Extensive anterior MI
Extensive anterior MI (“tombstoning” pattern)
•Massive ST elevation with “tombstone” morphology is present throughout
the precordial (V1-6) and high lateral leads (I, aVL)
•This pattern is seen in proximal LAD occlusion and indicates a large
territory infarction with a poor LV ejection fraction and high likelihood of
cardiogenic shock and death
Criteria for ST-segment Elevation for
Prior LBBB or RV-paced Rhythm
• ST-segment elevation greater than 1 mm in the
presence of a positive QRS complex (concordant
with the QRS)
• ST-segment elevation greater than 5 mm in the
presence of a negative QRS complex
(disconcordant with the QRS)
• ST-segment depression greater than 1 mm in V1–
V3
A score of 3 points or more has a 90% specificity (but a poor sensitivity) for the
diagnosis of STEMI
• Positive Sgarbossa criteria in a patient with LBBB and troponin-positive myocardial infarction:
• This patient presented with chest pain and had elevated cardiac enzymes.
• Previous ECG showed typical LBBB
• There is 1mm concordant ST elevation in aVL (= 5 points)
• Other features on this ECG that are abnormal in the context of LBBB (but not considered “positive” Sgarbossa criteria) are
the pathological Q wave in lead I and the concordant ST depression in the inferior leads III and aVF.
• This constellation of abnormalities suggests to the authors that the patient was having a high lateral infarction
• Positive Sgarbossa criteria in a patient with a ventricular paced rhythm:
• There is concordant ST depression in V2-5 (= Sgarbossa positive).
• The morphology in V2-5 is reminiscent of posterior STEMI, with horizontal ST
depression and prominent upright T waves
• Benign Early Repolarization (BER) causes mild ST elevation with tall T-
waves mainly in the precordial leads
• BER is a normal variant commonly seen in young, healthy patients. There is
often notching of the J-point — the “fish-hook” pattern
• The ST changes may be more prominent at slower heart rates and
disappear in the presence of tachycardia
There is slight concave ST elevation in the precordial and inferior
leads with notching of the J-point (the “fish-hook” pattern)
Brugada Syndrome
• Inherited channelopathy (a disease of
myocardial sodium channels) that leads to
paroxysmal ventricular arrhythmias and sudden
cardiac death in young patients
• The tell-tale sign on the resting ECG is the
“Brugada sign” — ST elevation and partial RBBB
in V1-2 with a “coved” morphology
There is ST elevation and partial RBBB in V1-2 with a coved morphology —
the “Brugada sign”
Left Bundle Branch Block
• In Left bundle branch block (LBBB), the ST
segments and T waves show “appropriate
discordance” — i.e. they are directed opposite to
the main vector of the QRS complex
• This produces ST elevation and upright T waves
in leads with a negative QRS complex (dominant
S wave), while producing ST depression and T
wave inversion in leads with a positive QRS
complex (dominant R wave)
Left Ventricular Hypertrophy (LVH)
•Left axis deviation
•Deep S waves with ST elevation in V1-3
•ST depression and T-wave inversion in the lateral leads V5-6
Ventricular Paced Rhythm
• Ventricular pacing (with a pacing wire in the right ventricle) causes ST
segment abnormalities identical to that seen in LBBB
• There is appropriate discordance, with the ST segment and T wave directed
opposite to the main vector of the QRS complex
Raised Intracranial Pressure
• Raised Intracranial Pressure (ICP) (e.g. due to intracranial haemorrhage,
traumatic brain injury) may cause ST elevation or depression that simulates
myocardial ischemia or pericarditis
Widespread ST elevation with concave (pericarditis-like) morphology in a patient
with severe traumatic brain injury
Takotsubo Cardiomyopathy
• A STEMI mimic producing ischemic chest pain,
ECG changes +/- elevated cardiac enzymes with
characteristic regional wall motion abnormalities
on echocardiography
• Typically occurs in the context of severe
emotional distress (“broken heart syndrome“)
• Commonly associated with new ECG changes
(ST elevation or T wave inversion) or moderate
troponin rise
Takotsubo Cardiomyopathy
• Less Common Causes of ST segment Elevation
• Pulmonary embolism and acute cor pulmonale (usually
in lead III)
• Acute aortic dissection (classically causes inferior
STEMI due to RCA dissection)
• Hyperkalemia
• Sodium-channel blocking drugs (secondary to QRS
widening)
• J-waves (hypothermia, hypercalcaemia)
• Following electrical cardioversion
• Others: Cardiac tumour, myocarditis, pancreas or
gallbladder disease
• Transient ST elevation after DC
cardioversion from VF
J waves in hypothermia simulating ST
elevation
• Causes of ST Depression
• Myocardial ischemia / NSTEMI
• Reciprocal change in STEMI,Posterior MI
• Digoxin effect
• Hypokalemia
• Right bundle branch block
• Right ventricular hypertrophy
• Left bundle branch block
• Left ventricular hypertrophy
• Supraventricular tachycardia
• Ventricular paced rhythm
Morphology of ST Depression
• ST depression can be either upsloping, downsloping, or
horizontal
• Horizontal or downsloping ST depression ≥ 0.5 mm at
the J-point in ≥ 2 contiguous leads indicates myocardial
ischaemia (according to the 2007 Task Force Criteria)
• Upsloping ST depression in the precordial leads with
prominent De Winter T waves is highly specific for
occlusion of the LAD
• Reciprocal change has a morphology that resembles
“upside down” ST elevation and is seen in leads
electrically opposite to the site of infarction
• Posterior MI manifests as horizontal ST depression in
V1-3 and is associated with upright T waves and tall R
waves
ST segment morphology in myocardial
ischemia
Reciprocal change
ST segment morphology in posterior MI
Patterns of ST depression
• Myocardial Ischemia
• Unlike myocardial infarction, ischaemia is
reversible and so the associated ECG
abnormalities are seen only while the patient is
experiencing an episode of pain
• ST segment depression is the commonest
abnormality associated with ischaemia and is
usually ‘horizontal’
Reciprocal Change
• ST elevation during acute STEMI is associated
with simultaneous ST depression in the electrically
opposite leads:
• Inferior STEMI produces reciprocal ST depression
in aVL (± lead I)
• Lateral or anterolateral STEMI produces reciprocal
ST depression in III and aVF (± lead II)
• Reciprocal ST depression in V1-3 occurs
with posterior infarction
• Inferior STEMI with complete heart block
•Reciprocal ST depression in aVL with inferior STEMI
•Reciprocal ST depression in III and aVF with high lateral STEMI
Posterior Myocardial Infarction
• ST depression in the anterior leads V1-3, along with dominant R waves (“Q-
wave equivalent”) and upright T waves
• ST elevation in the posterior leads V7-9
De Winter T Waves
• A pattern of up-sloping ST depression with symmetrically peaked T
waves in the precordial leads is considered to be a STEMI
equivalent, and is highly specific for an acute occlusion of the LAD
Digoxin Effect
• Treatment with digoxin causes downsloping ST
depression with a “sagging” morphology, reminiscent of
Salvador Dali’s moustache
Hypokalemia
• Causes widespread downsloping ST depression with T-wave
flattening/inversion, prominent U waves and a prolonged QU interval
Right ventricular hypertrophy with ‘strain’
• Causes ST depression and T-wave inversion in the right
precordial leads V1-3
Right Bundle Branch Block (RBBB)
• Produce a similar pattern of repolarisation abnormalities
to RVH, with ST depression and T wave inversion in V1-3
Supraventricular tachycardia (SVT)
• SVT (e.g. AVNRT) typically causes widespread horizontal ST depression,
most prominent in the left precordial leads (V4-6)
• This rate-related ST depression does not necessarily indicate the presence
of myocardial ischaemia, provided that it resolves with treatment

ST SEGMENT IN ECG,ST ELEVATION AND ST DEPRESSION

  • 1.
  • 2.
    • ST Segment •Flat, isoelectric section of the ECG between the end of the S wave (the J point) and the beginning of the T wave • Represents the interval between ventricular depolarization and repolarization • The most important cause of ST segment abnormality (elevation or depression) is myocardial ischaemia or infarction
  • 3.
    • Causes ofST Segment Elevation • ST segment elevation myocardial infarction • Coronary vasospasm (Printzmetal’s angina) • Pericarditis • Benign early repolarization • Brugada syndrome • Left bundle branch block • Left ventricular hypertrophy • Ventricular aneurysm • Ventricular paced rhythm • Raised intracranial pressure • Takotsubo Cardiomyopathy
  • 4.
    Morphology of theElevated ST segment Acute STEMI may produce ST elevation with either concave, convex or obliquely straight morphology
  • 5.
    ST Segment Morphologyin Other Conditions
  • 6.
    ST Segment Morphologyin Other Conditions
  • 7.
    • Patterns ofST Elevation • Acute ST elevation myocardial infarction (STEMI) • ST segment elevation and Q-wave formation in contiguous leads • Septal (V1-2) • Anterior (V3-4) • Lateral (I + aVL, V5-6) • Inferior (II, III, aVF) • Right ventricular (V1, V4R) • Posterior (V7-9)
  • 8.
    • Coronary Vasospasm(Prinzmetal’s angina) • This causes a pattern of ST elevation that is very similar to acute STEMI — i.e. localised ST elevation with reciprocal ST depression occurring during episodes of chest pain • However, unlike acute STEMI the ECG changes are transient, reversible with vasodilators and not usually associated with myocardial necrosis • It may be impossible to differentiate these two conditions based on the ECG alone
  • 11.
  • 12.
    Diagnostic ECG criteriafor STEMI In right-sided leads (V3R and V4R), the threshold for abnormal ST elevation at the J point is 0.5 mm, except in males <30 years in whom it is 1 mm In posterior leads (V7, V8, and V9), the threshold for abnormal ST elevation at the J point is 0.5 mm
  • 13.
    Location of MIby ECG leads
  • 14.
    ECG localisation ofcoronary artery territories
  • 15.
    High Lateral STEMI •STelevation is present in the high lateral leads (I and aVL) •There is reciprocal ST depression in the inferior leads (III and aVF) •QS waves in the anteroseptal leads (V1-4) with poor R wave progression indicate prior anteroseptal infarction •This pattern suggests proximal LAD disease with an acute occlusion of the first diagonal branch (D1)
  • 17.
    Inferolateral STEMI Posteriorextension Inferolateral STEMI. Posterior extension is suggested by: •Horizontal ST depression in V1-3 •Tall, broad R waves (> 30ms) in V2-3 •Dominant R wave (R/S ratio > 1) in V2 •Upright T waves in V2-3
  • 18.
    Inferolateral STEMI Posteriorextension Marked ST elevation in V7-9 with Q-wave formation confirms involvement of the posterior wall, making this an inferior-lateral-posterior STEMI (= big territory infarct!)
  • 19.
    Right ventricular infarction •In patients with inferior STEMI, right ventricular infarction is suggested by: • ST elevation in V1 • ST elevation in V1 and ST depression in V2 (highly specific for RV infarction) • Isoelectric ST segment in V1 with marked ST depression in V2 • ST elevation in III > II • Diagnosis is confirmed by the presence of ST elevation in the right-sided leads (V3R- V6R)
  • 21.
    Inferior STEMI Rightventricular infarction Inferior STEMI Right ventricular infarction is suggested by: •ST elevation in V1 •ST elevation in lead III > lead II
  • 22.
    Repeat ECG ofthe same patient with V4R electrode position •There is ST elevation in V4R consistent with RV infarction
  • 23.
    • Another exampleof right ventricular infarction in the context of inferior STEMI: • ST elevation in lead III > lead II • Isoelectric ST segment in V1 with marked ST depression in V2 • There is ST elevation in V4R
  • 24.
    Hyperacute Anteroseptal STEMI HyperacuteAnteroseptal STEMI: •ST elevation and hyperacute T waves in V2-4 •ST elevation in I and aVL with reciprocal ST depression in lead III •Q waves are present in the septal leads V1-2 •These features indicate a hyperacute anteroseptal STEMI
  • 25.
    Extensive anterior MI Extensiveanterior MI (“tombstoning” pattern) •Massive ST elevation with “tombstone” morphology is present throughout the precordial (V1-6) and high lateral leads (I, aVL) •This pattern is seen in proximal LAD occlusion and indicates a large territory infarction with a poor LV ejection fraction and high likelihood of cardiogenic shock and death
  • 27.
    Criteria for ST-segmentElevation for Prior LBBB or RV-paced Rhythm • ST-segment elevation greater than 1 mm in the presence of a positive QRS complex (concordant with the QRS) • ST-segment elevation greater than 5 mm in the presence of a negative QRS complex (disconcordant with the QRS) • ST-segment depression greater than 1 mm in V1– V3
  • 30.
    A score of3 points or more has a 90% specificity (but a poor sensitivity) for the diagnosis of STEMI
  • 31.
    • Positive Sgarbossacriteria in a patient with LBBB and troponin-positive myocardial infarction: • This patient presented with chest pain and had elevated cardiac enzymes. • Previous ECG showed typical LBBB • There is 1mm concordant ST elevation in aVL (= 5 points) • Other features on this ECG that are abnormal in the context of LBBB (but not considered “positive” Sgarbossa criteria) are the pathological Q wave in lead I and the concordant ST depression in the inferior leads III and aVF. • This constellation of abnormalities suggests to the authors that the patient was having a high lateral infarction
  • 32.
    • Positive Sgarbossacriteria in a patient with a ventricular paced rhythm: • There is concordant ST depression in V2-5 (= Sgarbossa positive). • The morphology in V2-5 is reminiscent of posterior STEMI, with horizontal ST depression and prominent upright T waves
  • 34.
    • Benign EarlyRepolarization (BER) causes mild ST elevation with tall T- waves mainly in the precordial leads • BER is a normal variant commonly seen in young, healthy patients. There is often notching of the J-point — the “fish-hook” pattern • The ST changes may be more prominent at slower heart rates and disappear in the presence of tachycardia There is slight concave ST elevation in the precordial and inferior leads with notching of the J-point (the “fish-hook” pattern)
  • 36.
    Brugada Syndrome • Inheritedchannelopathy (a disease of myocardial sodium channels) that leads to paroxysmal ventricular arrhythmias and sudden cardiac death in young patients • The tell-tale sign on the resting ECG is the “Brugada sign” — ST elevation and partial RBBB in V1-2 with a “coved” morphology
  • 37.
    There is STelevation and partial RBBB in V1-2 with a coved morphology — the “Brugada sign”
  • 39.
    Left Bundle BranchBlock • In Left bundle branch block (LBBB), the ST segments and T waves show “appropriate discordance” — i.e. they are directed opposite to the main vector of the QRS complex • This produces ST elevation and upright T waves in leads with a negative QRS complex (dominant S wave), while producing ST depression and T wave inversion in leads with a positive QRS complex (dominant R wave)
  • 41.
    Left Ventricular Hypertrophy(LVH) •Left axis deviation •Deep S waves with ST elevation in V1-3 •ST depression and T-wave inversion in the lateral leads V5-6
  • 43.
    Ventricular Paced Rhythm •Ventricular pacing (with a pacing wire in the right ventricle) causes ST segment abnormalities identical to that seen in LBBB • There is appropriate discordance, with the ST segment and T wave directed opposite to the main vector of the QRS complex
  • 44.
    Raised Intracranial Pressure •Raised Intracranial Pressure (ICP) (e.g. due to intracranial haemorrhage, traumatic brain injury) may cause ST elevation or depression that simulates myocardial ischemia or pericarditis Widespread ST elevation with concave (pericarditis-like) morphology in a patient with severe traumatic brain injury
  • 45.
    Takotsubo Cardiomyopathy • ASTEMI mimic producing ischemic chest pain, ECG changes +/- elevated cardiac enzymes with characteristic regional wall motion abnormalities on echocardiography • Typically occurs in the context of severe emotional distress (“broken heart syndrome“) • Commonly associated with new ECG changes (ST elevation or T wave inversion) or moderate troponin rise
  • 46.
  • 47.
    • Less CommonCauses of ST segment Elevation • Pulmonary embolism and acute cor pulmonale (usually in lead III) • Acute aortic dissection (classically causes inferior STEMI due to RCA dissection) • Hyperkalemia • Sodium-channel blocking drugs (secondary to QRS widening) • J-waves (hypothermia, hypercalcaemia) • Following electrical cardioversion • Others: Cardiac tumour, myocarditis, pancreas or gallbladder disease
  • 48.
    • Transient STelevation after DC cardioversion from VF
  • 49.
    J waves inhypothermia simulating ST elevation
  • 50.
    • Causes ofST Depression • Myocardial ischemia / NSTEMI • Reciprocal change in STEMI,Posterior MI • Digoxin effect • Hypokalemia • Right bundle branch block • Right ventricular hypertrophy • Left bundle branch block • Left ventricular hypertrophy • Supraventricular tachycardia • Ventricular paced rhythm
  • 51.
    Morphology of STDepression • ST depression can be either upsloping, downsloping, or horizontal • Horizontal or downsloping ST depression ≥ 0.5 mm at the J-point in ≥ 2 contiguous leads indicates myocardial ischaemia (according to the 2007 Task Force Criteria) • Upsloping ST depression in the precordial leads with prominent De Winter T waves is highly specific for occlusion of the LAD • Reciprocal change has a morphology that resembles “upside down” ST elevation and is seen in leads electrically opposite to the site of infarction • Posterior MI manifests as horizontal ST depression in V1-3 and is associated with upright T waves and tall R waves
  • 53.
    ST segment morphologyin myocardial ischemia
  • 54.
  • 55.
    ST segment morphologyin posterior MI
  • 56.
    Patterns of STdepression • Myocardial Ischemia • Unlike myocardial infarction, ischaemia is reversible and so the associated ECG abnormalities are seen only while the patient is experiencing an episode of pain • ST segment depression is the commonest abnormality associated with ischaemia and is usually ‘horizontal’
  • 58.
    Reciprocal Change • STelevation during acute STEMI is associated with simultaneous ST depression in the electrically opposite leads: • Inferior STEMI produces reciprocal ST depression in aVL (± lead I) • Lateral or anterolateral STEMI produces reciprocal ST depression in III and aVF (± lead II) • Reciprocal ST depression in V1-3 occurs with posterior infarction
  • 59.
    • Inferior STEMIwith complete heart block
  • 60.
    •Reciprocal ST depressionin aVL with inferior STEMI
  • 61.
    •Reciprocal ST depressionin III and aVF with high lateral STEMI
  • 62.
    Posterior Myocardial Infarction •ST depression in the anterior leads V1-3, along with dominant R waves (“Q- wave equivalent”) and upright T waves • ST elevation in the posterior leads V7-9
  • 63.
    De Winter TWaves • A pattern of up-sloping ST depression with symmetrically peaked T waves in the precordial leads is considered to be a STEMI equivalent, and is highly specific for an acute occlusion of the LAD
  • 64.
    Digoxin Effect • Treatmentwith digoxin causes downsloping ST depression with a “sagging” morphology, reminiscent of Salvador Dali’s moustache
  • 66.
    Hypokalemia • Causes widespreaddownsloping ST depression with T-wave flattening/inversion, prominent U waves and a prolonged QU interval
  • 68.
    Right ventricular hypertrophywith ‘strain’ • Causes ST depression and T-wave inversion in the right precordial leads V1-3
  • 69.
    Right Bundle BranchBlock (RBBB) • Produce a similar pattern of repolarisation abnormalities to RVH, with ST depression and T wave inversion in V1-3
  • 70.
    Supraventricular tachycardia (SVT) •SVT (e.g. AVNRT) typically causes widespread horizontal ST depression, most prominent in the left precordial leads (V4-6) • This rate-related ST depression does not necessarily indicate the presence of myocardial ischaemia, provided that it resolves with treatment