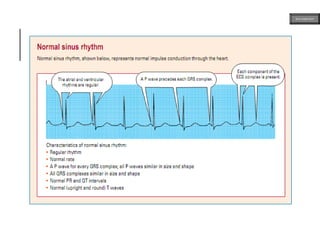
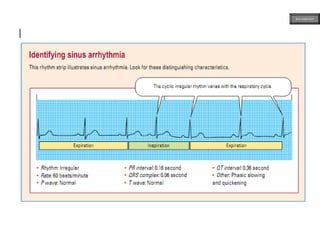
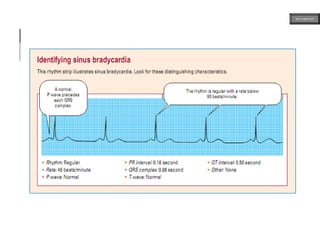
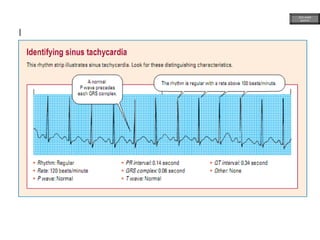
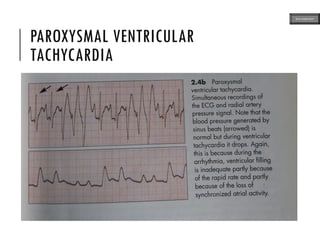
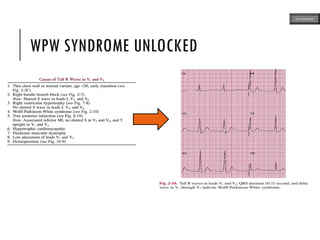
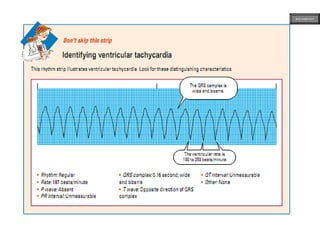
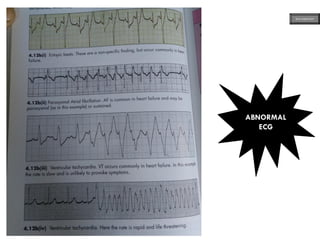
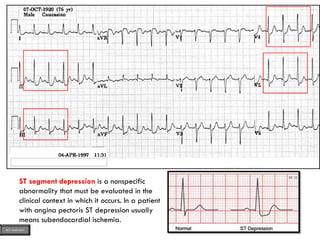
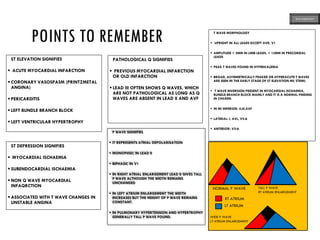
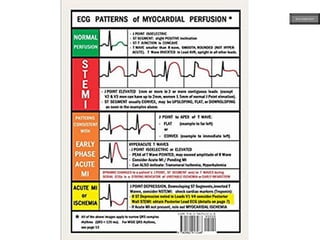
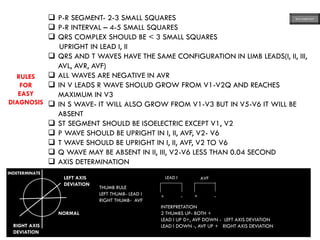
This document provides an overview of ECG samples and diagnosis for medical students. It discusses the basics of ECG interpretation, normal sinus rhythm, intervals, waveforms, abnormalities, myocardial infarction, bundle branch blocks, ventricular hypertrophy, atrial fibrillation, and more. Examples of various abnormal ECG patterns are presented along with explanations. Sources include textbooks and online resources for ECG learning. The document is intended for educational presentation purposes.
This document provides an overview of an ECG workshop that aims to teach the anatomy and physiology of the heart, understanding ECGs, ischaemia and myocardial infarction, caring for cardiac patients, and case studies. It covers topics like the anatomy of the heart chambers and coronary arteries, electrical conduction system, understanding ECG lead placement and components of the PQRST complex, identifying abnormalities like ischemia, infarction locations and evolutions, and care of the cardiac patient.
Interpretation of normal 12 leads electrocardiogram & someHarihar Adhikari
This document provides an overview of interpreting normal 12-lead electrocardiograms and some abnormal findings. It discusses the electrical conduction system of the heart and how depolarization spreads. Key aspects of a normal ECG are described, including intervals, waves, and what each lead measures. Common abnormalities are explained like arrhythmias, conduction defects, myocardial infarction, and hypertrophy. The diagnostic value of ECGs for conditions like coronary artery disease and various cardiac arrhythmias is also covered.
The document provides an overview of electrocardiography (ECG) interpretation. It discusses the heart's electrical conduction system and action potential, as well as the basics of reading an ECG including assessing rhythm, rate, axis, P waves, QRS complex, ST segment, and T waves. It outlines common abnormalities and provides examples of ECG interpretations for case scenarios involving myocardial infarction, left ventricular hypertrophy, sinus arrhythmia, and atrial fibrillation. The goal is to teach readers how to systematically evaluate an ECG tracing and identify potential cardiac issues.
The ECG represents the electrical activity of the heart. It can provide insight into cardiac pathophysiology by analyzing the distinctive waveforms of each cardiac event. The ECG can identify arrhythmias, ischemia, infarction, pericarditis, chamber hypertrophy, and electrolyte disturbances. The standard 12-lead ECG consists of 3 limb leads, 3 augmented limb leads, and 6 precordial leads, which provide different views of the heart. Analysis of the P wave, PR interval, QRS complex, ST segment, T wave, and QT interval can reveal normal sinus rhythm or abnormalities that require further investigation.
The document provides an overview of electrocardiography (ECG) basics including lead positions, ECG paper and timing, standardization, the normal ECG waves including P, PR, QRS, ST segments, T waves, and QT interval, and abnormalities. Key findings of right and left ventricular hypertrophy, atrial enlargement, bundle branch blocks, myocardial infarction, and various degrees of atrioventricular block are also summarized.
This document provides an overview of basics of ECG, including:
- A brief history of ECG development from 1842 to present day.
- An explanation of what an ECG measures and how it can be used to identify arrhythmias, ischemia, infarction and other cardiac conditions.
- A breakdown of the components of a normal ECG waveform including the P wave, PR interval, QRS complex, ST segment, and T wave.
- Descriptions of the 12-lead ECG system and how each lead views electrical activity from different angles in the heart.
- Explanations of how to analyze an ECG, including determining heart rate and cardiac axis. Bradyarrhythm
1. The document describes various EKG abnormalities including early repolarization, pericarditis, fascicular blocks, ventricular hypertrophy, electrolyte abnormalities, prolonged QT interval, and more.
2. Key details are provided on differentiating early repolarization from anterior MI and pericarditis. Stages of pericarditis are outlined.
3. Fascicular blocks are described along with their characteristic axis deviations and block locations. Different forms of ventricular hypertrophy and their EKG patterns are also summarized.
This document provides an overview of electrocardiography (ECG) for paramedics and junior medical officers. It discusses the anatomy and physiology underlying the ECG waveform, including the conduction system of the heart and cardiac action potentials. It then describes how to properly perform and interpret a standard 12-lead ECG, defining the various waves, segments, intervals and other components as well as common abnormalities. Factors that can affect the ECG tracing are also reviewed.
1. The document discusses electrocardiographic (ECG) interpretation including determining cardiac rate and rhythm, identifying conduction disturbances, myocardial ischemia or infarction, and other abnormalities.
2. It provides details on properly placing ECG leads and determining the cardiac axis. Common rhythms, conduction blocks, hypertrophy, and other ECG findings are explained.
3. A mnemonic device, RRAHIM, is presented to guide the systematic interpretation of an ECG, covering rate, rhythm, axis, hypertrophy, ischemia/infarction, and other findings.
This document provides an overview of basics of electrocardiography (ECG or EKG). It discusses the history of ECG development from 1842 to modern use. Key aspects of ECG are described, including the cardiac cycle waveform known as PQRST, conduction system, normal values, and interpretation of abnormalities. Common uses of ECG include identifying arrhythmias, ischemia, infarction and other cardiac conditions. Proper placement of ECG leads and use of rules to evaluate a normal tracing are also outlined.
1) An ECG provides a picture of the electrical activity of the heart by recording the electric waves through electrodes. It can help identify cardiac abnormalities.
2) Key aspects of an ECG include waves, intervals, segments and complexes which indicate different electrical events in the heart. A normal ECG is analyzed based on rhythm, rate, axis, P wave, PR interval, QRS complex, and ST segments.
3) Abnormal findings on an ECG can help diagnose conditions like myocardial infarction, arrhythmias, ventricular hypertrophy, and conduction blocks. Proper placement of electrodes and a systematic approach is used to accurately interpret ECGs.
This document provides a history of the electrocardiogram (EKG/ECG) and describes how it is used to evaluate cardiac electrical activity and identify various cardiac conditions. Some key points:
- The EKG was developed in the late 19th/early 20th century, with scientists like Matteucci, Marey, and Einthoven contributing to its invention and clinical use.
- An EKG records the heart's electrical activity through electrodes on the skin and can be used to detect arrhythmias, ischemia, infarction, and other conditions.
- It analyzes the P wave, QRS complex, ST segment, and T wave to evaluate conduction and identify abnormalities.
This document discusses various abnormalities that can be seen on electrocardiograms (ECGs). It covers rate abnormalities like tachycardia and bradycardia. It also discusses atrial and ventricular enlargements and the patterns they produce. Various rhythm abnormalities are outlined like junctional rhythm, idioventricular rhythm, and atrioventricular blocks. Bundle branch blocks and fascicular blocks are also described. The document then covers electrolyte disturbances and various arrhythmias including supraventricular arrhythmias, ventricular tachycardias, ventricular fibrillation, and patterns seen in myocardial infarction. It concludes by emphasizing the importance of ECG in identifying many heart conditions and changes.
The document discusses the history and importance of the electrocardiogram (ECG or EKG). It notes that while the ECG was initially not thought to find extensive clinical use, it is now one of the most commonly performed cardiovascular tests, with over 100 million performed annually in the US. The document then provides information on indications for ECGs, the components of an ECG, basic principles of ECG interpretation including intervals and patterns, and abnormalities that can be identified on an ECG.
The document provides information on electrocardiography (ECG) including:
1. It describes the normal conduction system of the heart and how it relates to the ECG waves and intervals.
2. It explains the basics of reading an ECG such as determining the heart rate, analyzing waves, segments, and intervals, and identifying abnormalities.
3. It discusses ECG findings associated with various cardiac conditions like myocardial infarction, left ventricular hypertrophy, bundle branch blocks, and cardiac arrhythmias.
This document provides an overview of electrocardiography (ECG) including what an ECG is, how it is recorded and interpreted. It discusses the cardiac conduction system, the standard 12-lead ECG configuration, normal ECG waveforms and intervals, and techniques for determining heart rate, rhythm, and electrical axis. Common normal variants and abnormalities that can be detected on ECG are also outlined. The document emphasizes the importance of correlating ECG findings with the clinical presentation in order to provide an accurate final impression.
This presentation covers few basic things about ECG, especially for UG Medical students like ECG leads, normal ECG waves, axis of ECG and how to look for common ECG misplacements.
The document outlines a systematic 7+2 step approach for interpreting electrocardiograms (ECGs) that involves analyzing the rhythm, rate, conduction, axes, wave morphologies, segment changes, and comparing to previous ECGs to form a clinical conclusion. The 7 steps examine the rhythm, rate, conduction intervals, axes, P wave, QRS, and ST-T wave morphologies. The +2 steps involve comparing the ECG to previous tracings and formulating a concluding statement.
This document provides an overview of electrocardiography (ECG). It defines an ECG as a tracing of the heart's electrical activity. The objectives are to learn how to perform an ECG, interpret the results, and recognize various pathologies. Key points covered include electrode placement, components of the ECG wave, the physiology of cardiac conduction, interpreting the rate, rhythm, axis, and analyzing P, QRS, and T waves. Causes of axis deviations and details on analyzing the P wave are also summarized.
This document provides an overview of cardiac physiology concepts including preload, afterload, contractility and the phases of the cardiac cycle. It then links these concepts to ECG patterns and discusses how electrolyte imbalances can affect the ECG. Specific conditions like atrial fibrillation, myocardial infarction and ventricular tachycardia are examined. A case study example is presented of a patient experiencing a potential inferior wall MI. Key aspects of the ECG like the ST segment and T wave are discussed in relation to evaluating for cell injury during a heart attack. Finally, a short quiz is provided to test recognition of ECG components.
The document provides information about electrocardiography (EKG/ECG). It describes the conduction system of the heart and how electrical signals are conducted to trigger heart contractions. It explains how an EKG works, including electrode placement and what different parts of the EKG waveform represent. It also covers how to interpret an EKG, such as measuring heart rate and identifying abnormalities. Common abnormalities, their causes, and clinical significance are discussed.
The ECG represents the electrical activity of the heart during the cardiac cycle. Each waveform provides insight into cardiac physiology and pathology. The ECG can be used to identify arrhythmias, ischemia, infarction, conduction abnormalities, chamber enlargement, and electrolyte disturbances. It consists of 12 leads that view the heart from different angles. The waveform intervals like P wave, PR interval, QRS complex, and ST segment must be carefully analyzed to interpret the ECG tracing.
This document provides an overview of ECG basics, including the orientation and types of leads, limb and chest lead placement, cardiac conduction system, normal ECG intervals and measurements, common clinical conditions like ischemia and hypertrophy, arrhythmias including atrial fibrillation and ventricular tachycardia, conduction abnormalities such as bundle branch blocks, and pacemaker function. It describes the waves, segments, and intervals that make up an ECG and what they represent physiologically. Diagrams and examples are provided to illustrate different pathologies.
1. The document provides an overview of essential clinical ECG skills, including understanding what an ECG is, heart anatomy and electrophysiology, ECG waveform components, and how to interpret ECGs.
2. It reviews ECG basics like lead placements, normal sinus rhythm, abnormal rhythms, rates, axes, and chamber enlargements.
3. Guidelines are given for identifying ischemic patterns from ST segments, T waves, and Q waves that indicate myocardial ischemia, injury, and infarction.
This document outlines a standardized method for interpreting 12-lead electrocardiograms (ECGs). The method involves analyzing six major sections in a specific order: heart rate, PR interval, QRS duration, QT interval, QRS axis, and waveforms. Each section is analyzed to identify any abnormalities, including intervals outside normal ranges or irregular waveforms. After following this method, the interpreter provides an overall interpretation of the ECG as normal or abnormal, listing any findings.
The document provides an introduction to an ECG presentation aimed at teaching ECG interpretation fundamentals to doctors. It outlines the objectives of sensitizing doctors to ECG learning, explaining clinical concepts, illustrating patterns with diagrams and real ECG charts, and highlighting differential diagnoses. Resources consulted for the presentation are listed. Basic ECG terminology and components are defined, including complexes, intervals and graph paper measurements. Examples of normal ECGs and some abnormal rhythms are shown.
(1) An ECG records and displays the electrical activity of the heart over time using electrodes placed on the skin. It is used to evaluate cardiac rate, rhythm, and detect any abnormalities. (2) Key aspects of an ECG include the P wave, QRS complex, T wave, and intervals between them like the PR and QT. Together these provide information on depolarization and repolarization of the heart's chambers. (3) A standard 12-lead ECG positions 10 electrodes on the limbs and chest to measure electrical activity from multiple angles and identify any damage or disease.
This document discusses cardiac dysrhythmias and their electrophysiological interpretation. It begins by defining heart block and describing different types including first, second and third degree heart block. It then discusses bundle branch blocks, atrial and ventricular enlargements, ischemia, injury and infarction patterns on ECG. Various cardiac arrhythmias and abnormalities are related to their characteristics on ECG tracings. Investigation methods and management of arrhythmias are also summarized.
The document discusses how ECG can be used to diagnose acute myocardial infarction (AMI) and locate the culprit artery. It provides details on:
1) Common ECG patterns seen in AMI including ST elevation, Q waves, T wave changes.
2) How ECG patterns can localize the infarct region and suggest the underlying coronary artery, such as ST elevation in certain leads indicating right coronary or left anterior descending artery.
3) Limitations of ECG including inability to detect all AMIs and accurately estimate infarct size due to individual variations in anatomy and collateral circulation. ECG is not optimal for posterior wall infarcts.
Some slides are taken from different textbooks of medicine like Davidson, Kumar and Clark and Oxford, and some from other presentations made by respected tutors. I'm barely responsible for compilation of various resources per my interest. These resources are free for use, and I do not claim any copyright. Hoping knowledge remains free for all, forever.
This document summarizes electrocardiogram (ECG) findings related to myocardial infarction (MI). It describes the ECG changes that occur in the hyperacute, evolved, and chronic phases of MI. These include ST segment elevation, T wave changes, Q wave development, and other abnormalities. It also discusses ECG patterns related to injury of specific coronary artery territories and criteria for diagnosing MI when a left bundle branch block is present.
This document summarizes different types of heart block seen on electrocardiograms (ECGs). It describes first, second (Mobitz types I and II), and third-degree heart block and their characteristics such as P wave and QRS relationships. Causes of heart block including drugs, diseases and medical conditions are provided. Management of the different types of heart block is also summarized.
This document provides an overview of electrocardiography (ECG/EKG) including:
1. A definition of ECG as a medical device that detects and records the electrical signals of the heart to help doctors interpret cardiac conditions.
2. A brief history of the ECG machine from its invention in 1903 to modern computerized systems.
3. Descriptions of the placement of electrodes and principles of recording, including potential issues like artifacts.
4. Explanations of ECG waves including the P, QRS, and T waves and how they relate to the electrical conduction system and depolarization/repolarization of the heart.
The document discusses electrocardiography (ECG), which records the electrical activity of the heart. It describes how the ECG is formed based on the direction of current flow and the placement of electrodes. The standard 12-lead ECG is described, including limb leads, augmented limb leads, and chest leads. Common ECG patterns such as the P wave, QRS complex, and ST segment are defined. Various cardiac arrhythmias and conduction abnormalities are also summarized, including sinus arrhythmia, heart block, bundle branch block, and atrial fibrillation.
Lethal ECG pattern reading and diagnosis.pptxHussein Alwais
This document contains a series of ECGs with clinical scenarios and questions. It discusses various cardiac conditions that can be diagnosed based on abnormalities seen on ECGs, including hypertrophic cardiomyopathy, Wolff-Parkinson-White syndrome, arrhythmogenic right ventricular dysplasia, hyperkalemia, sodium channel blockade, Brugada syndrome, myocardial infarction, and pericardial effusion. The document uses ECGs to test the reader's ability to identify key abnormalities and determine the underlying cardiac diagnosis suggested by the ECG pattern.
This document provides an overview of electrocardiograms (ECGs). It describes what an ECG is, how it works, the parts of an ECG waveform including the P, QRS, T, and U waves, intervals like the P-R and Q-T intervals, segments like the S-T segment, how to calculate heart rate from an ECG, the clinical significance of various ECG parameters, and common abnormalities that can be diagnosed using an ECG.
An electrocardiogram (ECG) records the electrical activity of the heart. It detects depolarization and repolarization of the myocardium through electrodes attached to the skin. The normal conduction pathway in the heart involves electrical signals traveling from the sinoatrial node through the atria and atrioventricular node before reaching the ventricles. An ECG provides 12 leads that give different views of the heart. It is used to diagnose conditions like myocardial infarction, dysrhythmias, and electrolyte imbalances.
An electrocardiogram (ECG) records the electrical activity of the heart. It detects depolarization and repolarization of the myocardium through electrodes attached to the skin. The normal conduction pathway in the heart involves electrical signals traveling from the sinoatrial node through the atria and atrioventricular node before reaching the ventricles. An ECG provides 12 leads that together give multiple views of the heart's electrical activity. Key waves include the P wave, QRS complex, ST segment, and T wave. Nurses must ensure proper ECG procedure and monitor for any abnormalities.
The document discusses the electrocardiogram (ECG), which shows the electrical pattern generated by the heart as it activates from the atria to the ventricles. The ECG uses leads to provide a 3D view of the direction of depolarization. The conduction system of the heart includes the sinoatrial node, AV node, bundle of His, bundle branches, and Purkinje fibers. The normal ECG shows the P wave, QRS complex, and T wave representing atrial depolarization, ventricular depolarization, and ventricular repolarization, respectively. The positions of the leads determine which part of the heart is visualized on the ECG.
This document summarizes key information about interpreting electrocardiograms (ECGs):
1. It discusses how to recognize normal sinus rhythm, 13 common arrhythmias, and acute myocardial infarction on ECGs.
2. It explains the differences between ST elevation and non-ST elevation myocardial infarctions and how they present differently on ECGs over time with ischemia, infarction, and fibrosis.
3. It also reviews how left ventricular hypertrophy and bundle branch blocks present on ECGs, noting that LVH causes increased QRS voltage while bundle branch blocks cause widened QRS duration and distinct morphology changes.
This document provides an overview of how to systematically interpret an electrocardiogram (EKG or ECG). It describes evaluating the rhythm, rate, axis, intervals, waves, and arriving at a final diagnosis by considering abnormalities in relationship to clinical data. Key aspects include assessing the P wave, QRS complex, ST segment, T wave, and U wave in each lead in a specified order. Factors that can affect the ST segment, T wave, and U wave are also discussed.
This document provides a guide for medical students to interpret electrocardiograms (ECGs). It aims to enable students to determine normal ECG features, assess rate and rhythm, and identify myocardial infarctions. The guide outlines how to present ECG findings in a logical order, covering rate and rhythm, conduction intervals, cardiac axis, QRS complexes, and ST segments and T waves. Key normal and abnormal ECG patterns are defined. The guide is intended to help standardize ECG interpretation training for medical students.
Electrocardiography (ECG) is used to diagnose myocardial infarction by detecting changes in the heart's electrical activity. ECG can identify the infarct-related artery by showing different ST segment elevation patterns corresponding to specific coronary artery occlusions. Assessment of ST segment resolution on ECG is also useful for guiding reperfusion therapy, as a reduction of over 70% in ST segment elevation within 90 minutes indicates effective treatment. The hallmarks of acute myocardial infarction on ECG are ST segment elevation in leads overlying the infarct area and ST depression in reciprocal leads.
1) The ECG shows sinus node exit block, which involves failure of the sinus node to depolarize or failure of impulse conduction from the sinus node to the atria.
2) This can be seen during anesthesia, drug therapy, myocardial ischemia/infarction, or fibrosis of the sinus node.
3) The patient has a regular rhythm but the length of the pause is not a multiple of the sinus interval, which can occur in healthy individuals or those with increased vagal tone, myocarditis, MI, or digitalis toxicity. Treatment depends on the underlying cause.
This document contains 7 ECG quiz cases designed to test the reader's ability to identify abnormalities and determine appropriate clinical responses. Each case provides an ECG image and asks the reader to identify any abnormalities, explain their clinical significance, and recommend next steps. The cases cover conditions like Wellens' syndrome, de Winter's pattern, posterior STEMI, Wolff-Parkinson-White syndrome, Brugada pattern, arrhythmogenic right ventricular cardiomyopathy, and hypertrophic obstructive cardiomyopathy. The document emphasizes the importance of recognizing subtle ECG findings that can indicate high-risk cardiac conditions requiring prompt referral or treatment.
TEST BANK For Brunner and Suddarth's Textbook of Medical-Surgical Nursing, 14...Donc Test
TEST BANK For Brunner and Suddarth's Textbook of Medical-Surgical Nursing, 14th Edition (Hinkle, 2017) Verified Chapter's 1 - 73 Complete.pdf
Giloy in Ayurveda - Classical Categorization and SynonymsPlanet Ayurveda
Giloy, also known as Guduchi or Amrita in classical Ayurvedic texts, is a revered herb renowned for its myriad health benefits. It is categorized as a Rasayana, meaning it has rejuvenating properties that enhance vitality and longevity. Giloy is celebrated for its ability to boost the immune system, detoxify the body, and promote overall wellness. Its anti-inflammatory, antipyretic, and antioxidant properties make it a staple in managing conditions like fever, diabetes, and stress. The versatility and efficacy of Giloy in supporting health naturally highlight its importance in Ayurveda. At Planet Ayurveda, we provide a comprehensive range of health services and 100% herbal supplements that harness the power of natural ingredients like Giloy. Our products are globally available and affordable, ensuring that everyone can benefit from the ancient wisdom of Ayurveda. If you or your loved ones are dealing with health issues, contact Planet Ayurveda at 01725214040 to book an online video consultation with our professional doctors. Let us help you achieve optimal health and wellness naturally.
Allopurinol, a uric acid synthesis inhibitor acts by inhibiting Xanthine oxidase competitively as well as non- competitively, Whereas Oxypurinol is a non-competitive inhibitor of xanthine oxidase.
Congestive Heart failure is caused by low cardiac output and high sympathetic discharge. Diuretics reduce preload, ACE inhibitors lower afterload, beta blockers reduce sympathetic activity, and digitalis has inotropic effects. Newer medications target vasodilation and myosin activation to improve heart efficiency while lowering energy requirements. Combination therapy, following an assessment of cardiac function and volume status, is the most effective strategy to heart failure care.
Gene therapy can be broadly defined as the transfer of genetic material to cure a disease or at least to improve the clinical status of a patient.
One of the basic concepts of gene therapy is to transform viruses into genetic shuttles, which will deliver the gene of interest into the target cells.
Safe methods have been devised to do this, using several viral and non-viral vectors.
In the future, this technique may allow doctors to treat a disorder by inserting a gene into a patient's cells instead of using drugs or surgery.
The biggest hurdle faced by medical research in gene therapy is the availability of effective gene-carrying vectors that meet all of the following criteria:
Protection of transgene or genetic cargo from degradative action of systemic and endonucleases,
Delivery of genetic material to the target site, i.e., either cell cytoplasm or nucleus,
Low potential of triggering unwanted immune responses or genotoxicity,
Economical and feasible availability for patients .
Viruses are naturally evolved vehicles that efficiently transfer their genes into host cells.
Choice of viral vector is dependent on gene transfer efficiency, capacity to carry foreign genes, toxicity, stability, immune responses towards viral antigens and potential viral recombination.
There are a wide variety of vectors used to deliver DNA or oligo nucleotides into mammalian cells, either in vitro or in vivo.
The most common vector system based on retroviruses, adenoviruses, herpes simplex viruses, adeno associated viruses.
The Children are very vulnerable to get affected with respiratory disease.
In our country, the respiratory Disease conditions are consider as major cause for mortality and Morbidity in Child.
The biomechanics of running involves the study of the mechanical principles underlying running movements. It includes the analysis of the running gait cycle, which consists of the stance phase (foot contact to push-off) and the swing phase (foot lift-off to next contact). Key aspects include kinematics (joint angles and movements, stride length and frequency) and kinetics (forces involved in running, including ground reaction and muscle forces). Understanding these factors helps in improving running performance, optimizing technique, and preventing injuries.
Storyboard on Acne-Innovative Learning-M. pharm. (2nd sem.) CosmeticsMuskanShingari
Acne is a common skin condition that occurs when hair follicles become clogged with oil and dead skin cells. It typically manifests as pimples, blackheads, or whiteheads, often on the face, chest, shoulders, or back. Acne can range from mild to severe and may cause emotional distress and scarring in some cases.
**Causes:**
1. **Excess Oil Production:** Hormonal changes during adolescence or certain times in adulthood can increase sebum (oil) production, leading to clogged pores.
2. **Clogged Pores:** When dead skin cells and oil block hair follicles, bacteria (usually Propionibacterium acnes) can thrive, causing inflammation and acne lesions.
3. **Hormonal Factors:** Fluctuations in hormone levels, such as during puberty, menstrual cycles, pregnancy, or certain medical conditions, can contribute to acne.
4. **Genetics:** A family history of acne can increase the likelihood of developing the condition.
**Types of Acne:**
- **Whiteheads:** Closed plugged pores.
- **Blackheads:** Open plugged pores with a dark surface.
- **Papules:** Small red, tender bumps.
- **Pustules:** Pimples with pus at their tips.
- **Nodules:** Large, solid, painful lumps beneath the surface.
- **Cysts:** Painful, pus-filled lumps beneath the surface that can cause scarring.
**Treatment:**
Treatment depends on the severity and type of acne but may include:
- **Topical Treatments:** Such as benzoyl peroxide, salicylic acid, or retinoids to reduce bacteria and unclog pores.
- **Oral Medications:** Antibiotics or oral contraceptives for hormonal acne.
- **Procedures:** Such as chemical peels, extraction of comedones, or light therapy for more severe cases.
**Prevention and Management:**
- **Cleanse:** Regularly wash skin with a gentle cleanser.
- **Moisturize:** Use non-comedogenic moisturizers to keep skin hydrated without clogging pores.
- **Avoid Irritants:** Such as harsh cosmetics or excessive scrubbing.
- **Sun Protection:** Use sunscreen to prevent exacerbation of acne scars and inflammation.
Acne treatment can take time, and consistency in skincare routines and treatments is crucial. Consulting a dermatologist can help tailor a treatment plan that suits individual needs and reduces the risk of scarring or long-term skin damage.
Can Traditional Chinese Medicine Treat Blocked Fallopian Tubes.pptxFFragrant
There are many traditional Chinese medicine therapies to treat blocked fallopian tubes. And herbal medicine Fuyan Pill is one of the more effective choices.
CLASSIFICATION OF H1 ANTIHISTAMINICS-
FIRST GENERATION ANTIHISTAMINICS-
1)HIGHLY SEDATIVE-DIPHENHYDRAMINE,DIMENHYDRINATE,PROMETHAZINE,HYDROXYZINE 2)MODERATELY SEDATIVE- PHENARIMINE,CYPROHEPTADINE, MECLIZINE,CINNARIZINE
3)MILD SEDATIVE-CHLORPHENIRAMINE,DEXCHLORPHENIRAMINE
TRIPROLIDINE,CLEMASTINE
SECOND GENERATION ANTIHISTAMINICS-FEXOFENADINE,
LORATADINE,DESLORATADINE,CETIRIZINE,LEVOCETIRIZINE,
AZELASTINE,MIZOLASTINE,EBASTINE,RUPATADINE. Mechanism of action of 2nd generation antihistaminics-
These drugs competitively antagonize actions of
histamine at the H1 receptors.
Pharmacological actions-
Antagonism of histamine-The H1 antagonists effectively block histamine induced bronchoconstriction, contraction of intestinal and other smooth muscle and triple response especially wheal, flare and itch. Constriction of larger blood vessel by histamine is also antagonized.
2) Antiallergic actions-Many manifestations of immediate hypersensitivity (type I reactions)are suppressed. Urticaria, itching and angioedema are well controlled.3) CNS action-The older antihistamines produce variable degree of CNS depression.But in case of 2nd gen antihistaminics there is less CNS depressant property as these cross BBB to significantly lesser extent.
4) Anticholinergic action- many H1 blockers
in addition antagonize muscarinic actions of ACh. BUT IN 2ND gen histaminics there is Higher H1 selectivitiy : no anticholinergic side effects
Nano-gold for Cancer Therapy chemistry investigatory projectSIVAVINAYAKPK
chemistry investigatory project
The development of nanogold-based cancer therapy could revolutionize oncology by providing a more targeted, less invasive treatment option. This project contributes to the growing body of research aimed at harnessing nanotechnology for medical applications, paving the way for future clinical trials and potential commercial applications.
Cancer remains one of the leading causes of death worldwide, prompting the need for innovative treatment methods. Nanotechnology offers promising new approaches, including the use of gold nanoparticles (nanogold) for targeted cancer therapy. Nanogold particles possess unique physical and chemical properties that make them suitable for drug delivery, imaging, and photothermal therapy.
Nano-gold for Cancer Therapy chemistry investigatory project
Ecg samples
1. ECG SAMPLES AND DIAGNOSIS FOR MBBS
NABYENDU BISWAS
COMMUNITY MEMBER EXECUTIVE, ELSEVIER
drnabyendu365@gmail.com
ECG MADE EASY
2. SOURCES AND PREDICTIONS
FIRST OF ALL EVERYTHING IN THIS DOCUMENT WRITTEN IN CAPITALS, SO aVF WRITTEN AS AVF IN EVERY
PORTION OF THIS DOCUMENT WHICH IS NOT COREECT.
SECONDLY IN EVERY ECG IT IS NOT POSSIBLE TO EXPLAN EACH AND EVERY FINDINGS AVAILABLE. SO, I DISCUSS
ABOUT THE MAJOR FINDINGS ONLY.
DUE TO LACK OF SPACE I AM NOT ABLE TO DISCUSS THE BASIC PHYSIOLOGY OF HEART IN THIS DOCUMENT.
THIS DOCUMENT IS ONLY FOR PRESENTATION PURPOSE SO, COPYRIGHT PROTECTION IS NOT MAINTAINED.
SOURCES-
DIAGNOSIS IN COLOUR CARDIOLOGY BY TIMMIS AND BRECKER.
DAVIDSON’S PRINCIPLES AND PRACTICE OF MEDICINE
ECG LEARNING CENTRE ecg.utah.edu
ECGpedia
NCBI
ECG COLLECTED FROM RURAL HOSPITALS, WEST BENGAL
ECG MADE EASY
12. NORMAL P WAVES AND ABNORMALITIES
GENERALLY TALL P WAVES IN
LEAD II MAINLY SIGNIFIES
PULMONARY HYPERTENSION
AND HYPERTROPHY.
ECG MADE EASY
ECG MADE EASY
13. QRS COMPLEX DETAILS
R WAVE CANNOT BE NEGATIVE
AND
Q WAVE CANNOT BE POSITIVE
ECG MADE EASY
24. BUNDLE BRANCH BLOCK
LEFT BUNDLE
BRANCH BLOCK
1. M PATTERN IN LEAD I
2. W PATTERN IN V4
3. QRS COMPLEX >= 120
ms
ECG MADE EASY
25. LEFT BUNDLE BRANCH BLOCK WITH MI
LEFT BUNDLE
BRANCH BLOCK
1. M PATTERN IN LEAD I
2. W PATTERN IN V1
3. QRS COMPLEX >= 120
ms
ECG MADE EASY
26. LBBB is recognized by 1) QRS duration
>0.12s; 2) monophasic R waves in I and
V6; and 3) terminal QRS forces
oriented leftwards and posterior.
The ST-T waves should be oriented
opposite to the terminal QRS forces.
DIFFERENCE BETWEEN
NORMAL AND
MONOPHASIC R
WAVE
ECG MADE EASY
31. RBBB is recognized by 1) rR' in V1; 2) QRS duration >0.12s. In RBBB the ST-T waves should be
oriented opposite to the terminal QRS forces. In this example there are "primary ST-T wave
abnormalities" in leads I, II, aVL, V5, V6. In these leads the ST-T orientation is in the same direction
as the terminal QRS forces.
ECG MADE EASY
49. ATRIAL FIBRILLATION ECG
1. THE VENTRICULAR COMPLEXES ARE IRREGULAR
2. THERE ARE NO P WAVES AND IRREGULAR OSCILLATIONS DISTUREB THE
BASELINE.
ECG MADE EASY
58. TYPES OF AV BLOCKS
1. IN 1ST DEGREE HEART
BLOCK AV CONDUCTION
IS DELAYED RESULTING IN
PROLONGED PR INTERVAL
i.e. 0.20 sec.
2. ST ELEVATION MAY BE
FOUND.
DROPPED
BEAT
ECG MADE EASY
59. HEART BLOCK DISCUSSION
DOUBT
1. IN 1ST DEGREE HEART BLOCK AV
CONDUCTION IS DELAYED RESULTING
IN PROLONGED PR INTERVAL i.e. 0.20
sec.
2. IN 2ND DEGREE HEART BLOCK
(PARTIAL HEART BLOCK) SOME
IMPULSES FROM THE ATRIA FAILED TO
GET THROUGHTO THE VENTRICLES i.e.
DROPPED BEAT OCCURS.
SOMETIMES THERE IS
PROGRESSIVE LENGTHENING OF
SUCCESSIVE PR INTERVALS FOLLOWED
BY A DROPPED BEAT
ECG MADE EASY
60. EXERCISE ECG CHANGES
ISCHAEMIC CHANGES ARE
VISIBLE. AFTER 3 MINUTES
PLANER ST DEPRESSION
DEVOLOPED AND AT 6
MINS IT IS MORE
PRONOUNCED.
PROBABLE DIAGNOSIS-
CORONARY ARTERY
DISEASE
ECG MADE EASY
71. CLASSICAL T WAVE
INVERSION.
BUT SINCE ST ELEVATION
OR DEPRESSION NOT
PROMINENT SO DIAGNOSIS
CANNOT BE CONFIRMED.
ECG
MADE
EASY
72. PATHOLOGICAL Q WAVES AND EVOLVING ST SEGMENT ELEVATION SIGNIFIES
STEMI, NOTE ST ELEVATION IN LEAD II, III, AVF
ST SEGMENT DEPRESSION ALSO PRESENT IN V1-3 REPRESENTS TRUE
POSTERIOR INJURY
ACUTE INFERIOR WALL MI
ECG MADE EASY
73. PATHOLOGICAL Q WAVE IS MOST
SIGNIFICANT IN THIS ECG
LARGEST Q IN III, NXT IN AVF AND
SMALLEST IN II
OLD INFERIOR Q WAVE MI
DOUBT
Q. WHERE IS THE Q IN LEAD III
ANS. LOOK CAREFULLY AT LEAD III, THERE IS P WAVE
POSITIVE AND WAVE FOLLOWED BY P WAVE
SHOLULD BE POSITIVE, SINCE IT IS NEGATIVE AND
NOT FOLLOWED Y A POSITIVE WAVE SO IT ISNOT
S, IT MUT BE Q
ECG MADE EASY
74. 15 LEAD ECG SHOWING ST ELEVATION IN V8-9 AND ST DEPRESSION IN V1-6
AND FINALLY SLIGHT ST ELEVATION IN I, AVL.
ST DEPRESSION IN V4R SIGNIFIES LEFT CIRCUMFLEX OCCLUSION.
ACUTE POSTERIOR MI DUE TO LEFT CIRCUMFLEX OCCLUSION ECG MADE EASY
75. TALL R WAVES IN V1-3
DEEP Q WAVE IN LEAD II, III, AVF
RESIDUAL ST-T ABNORMALITIES ALSO PRESENT
OLD INFEROPOSTERIOR MI
DOUBT
THE MAIN POINT BY WHICH WE
DIFFERENTIATE ACUTE AND OLD MI IS THAT
ACUTE MI= ST SEGMENT ELEVATION
OLD MI= ST ELEVATION + PATHOLOGICAL Q
ECG MADE EASY
76. SIGNIFICANT ST ELEVATION
ACUTE INFERIOR STEMI FINDINGS IN LEAD II, III, AVF (ST ELEVATION IN II, III
AND ST DEPRESSION IN LEAD I)
AND ST ELEVATION IN V3R TO V6R ;INDICATIVE OF RIGHT VENTRICULAR
INJURY
RIGHT VENTRICULAR MI
ECG MADE EASY
77. Acute anterior or anterolateral MI (note Q's V2-6 plus hyper acute ST-T changes)
ANTERIOR MI SINCE PROMINENT CHANGES FOUND IN V2, V3
Q WAVE
ECG MADE EASY
78. Q-wave, slight ST elevation, and T inversion in lead AVL
LATERAL MI
TYPICAL MI FEATURES IN LEADI/ AVL
ECG MADE EASY
79. The QS complexes, resolving ST
segment elevation and T wave
inversions in V1-2 are evidence for a
fully evolved anteroseptal MI. The
inverted T waves in V3-5, I, aVL are
also probably related to the MI.
ANTEROSEPTAL MI
DOUBT
Q. IS IT REALLY T INVERSION IN V2
ANS. FOR THIS JUST CHECK THERE IS A SMALL POSITIVE P WAVE, SO
AS WE KNOW AVR IS A REVERSAL OR NEGATIVE LEAD AND THERE
EACH AND EVERY WAVE FORM GIVES OPPOSITE VALUE BUT HERE P
IS IN RIGHT DIRECTION MEANS UPWARDS. SO, T SHOULD BE
UPWARDS SINCE IT IS A POSITIVE WAVE LIKE P
BUT IT IS INVERTED.
P
ECG MADE EASY
80. Hyperacute T waves in inferior wall STEMI
DOUBT
WHY INFERIOR WALL STEMI
IN LEAD II MARKED ST ELEVATION FOUND
IN LEAD III ALSO MARKED ST ELEVATION
FOUND
IN AVF ALSO MARKED ST ELEVATION
FOUND
ECG MADE EASY
81. The ST segments are elevated in Leads II, III,
and aVF, but the amount of elevation may
look subtle to some.
INFERIOR WALL MI
This ECG shows a common
manifestation with inferior wall
M.I., BRADYCARDIA. We see
the signs of acute inferior wall
M.I.
ECG MADE EASY
83. QQQQQQQQQQQQQQQQQQQQ
ST segment depression is a nonspecific
abnormality that must be evaluated in the
clinical context in which it occurs. In a patient
with angina pectoris ST depression usually
means subendocardial ischemia.
ECG MADE EASY
84. POINTS TO REMEMBER
ST ELEVATION SIGNIFIES
ACUTE MYOCARDIAL INFARCTION
CORONARY VASOSPASM (PRINTZMETAL
ANGINA)
PERICARDITIS
LEFT BUNDLE BRANCH BLOCK
LEFT VENTRICULAR HYPERTROPHY
ST DEPRESSION SIGNIFIES
MYOCARDIAL ISCHAEMIA
SUBENDOCARDIAL ISCHAEMIA
NON Q WAVE MYOCARDIAL
INFAQRCTION
ASSOCIATED WITH T WAVE CHANGES IN
UNSTABLE ANGINA
PATHOLOGICAL Q SIGNIFIES
PREVIOUS MYOCARDIAL INFARCTION
OR OLD INFARCTION
LEAD III OFTEN SHOWS Q WAVES, WHICH
ARE NOT PATHOLOGICAL AS LONG AS Q
WAVES ARE ABSENT IN LEAD II AND AVF
T WAVE MORPHOLOGY
UPRIGHT IN ALL LEADS EXCEPT AVR, V1
AMPLITUDE < 5MM IN LIMB LEADS, < 15MM IN PRECORDIAL
LEADS
PEAK T WAVES FOUND IN HYPERKALEMIA
BROAD, ASYMMETRICALLY PEAKED OR HYPERACUTE T WAVES
ARE SEEN IN THE EARLY STAGE OF ST ELEVATION MI( STEMI)
T WAVE INVERSION PRESENT IN MYOCARDIAL ISCHAEMIA,
BUNDLE BRANCH BLOCK MAINLY AND IT IS A NORMAL FINDING
IN CHILREN.
IN MI INFERIOR- II,III,AVF
LATERAL- I, AVL, V5-6
ANTERIOR- V2-6
P WAVE SIGNIFIES
IT REPRESENTS ATRIAL DEPOLARISATION
MONOPHSIC IN LEAD II
BIPHASIC IN V1
IN RIGHT ATRIAL ENLARGEMENT LEAD II GIVES TALL
P WAVE ALTHOUGH THE WIDTH REMAINS
UNCHANGED
IN LEFT ATRIUM ENLARGEMENT THE WIDTH
INCREASES BUT THE HEIGHT OF P WAVE REMAINS
CONSTANT.
IN PULMONARY HYPERTENSION AND HYPERTROPHY
GENERALLY TALL P WAVE FOUND.
RT ATRIUM
LT ATRIUM
NORMAL P WAVE TALL P WAVE
RT ATRIUM ENLARGEMENT
WIDE P WAVE
LT ATRIUM ENLARGEMENT
ECG MADE EASY
86. P-R SEGMENT- 2-3 SMALL SQUARES
P-R INTERVAL – 4-5 SMALL SQUARES
QRS COMPLEX SHOULD BE < 3 SMALL SQUARES
UPRIGHT IN LEAD I, II
QRS AND T WAVES HAVE THE SAME CONFIGURATION IN LIMB LEADS(I, II, III,
AVL, AVR, AVF)
ALL WAVES ARE NEGATIVE IN AVR
IN V LEADS R WAVE SHOLUD GROW FROM V1-V2Q AND REACHES
MAXIMUM IN V3
IN S WAVE- IT WILL ALSO GROW FROM V1-V3 BUT IN V5-V6 IT WILL BE
ABSENT
ST SEGMENT SHOULD BE ISOELECTRIC EXCEPT V1, V2
P WAVE SHOULD BE UPRIGHT IN I, II, AVF, V2- V6
T WAVE SHOULD BE UPRIGHT IN I, II, AVF, V2 TO V6
Q WAVE MAY BE ABSENT IN II, III, V2-V6 LESS THAN 0.04 SECOND
AXIS DETERMINATION
NORMAL
LEFT AXIS
DEVIATION
RIGHT AXIS
DEVIATION
INDETERMINATE
THUMB RULE
LEFT THUMB- LEAD I
RIGHT THUMB- AVF
LEAD I AVF
+ - + -
INTERPRETATION
2 THUMBS UP- BOTH +
LEAD I UP 0+, AVF DOWN - LEFT AXIS DEVIATION
LEAD I DOWN -, AVF UP + RIGHT AXIS DEVIATION
RULES
FOR
EASY
DIAGNOSIS
ECG MADE EASY
87. XRAY DIAGNOSIS MADE EASY CT SCAN DIAGNOSIS MADE EASY
COMING SOON
ECG MADE EASY