Download as PDF, PPTX

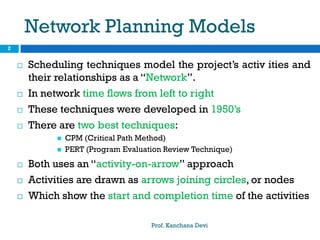

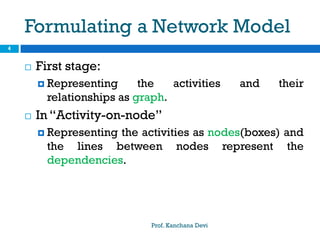

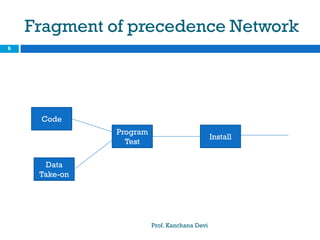


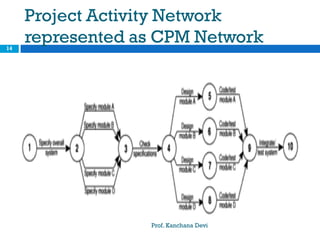
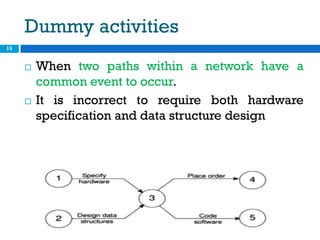
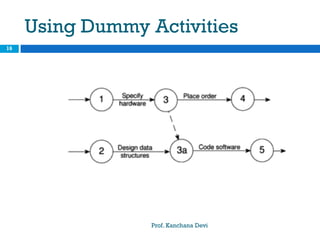

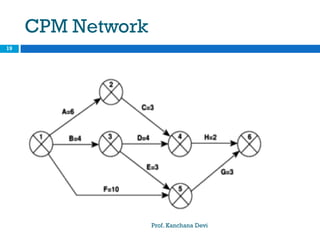
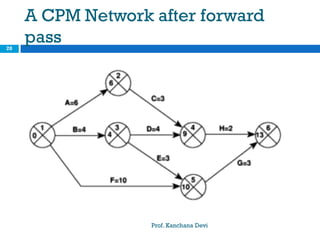


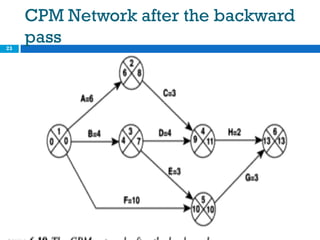


The document discusses network planning models for project scheduling. It describes two main techniques: CPM (Critical Path Method) and PERT (Program Evaluation Review Technique). Both use an "activity-on-arrow" approach where activities are drawn as arrows between nodes representing start and end times. More recently, precedence networks use an "activity-on-node" approach where activities are represented as nodes and dependencies as lines between nodes. The document provides examples of constructing precedence networks and performing forward and backward passes to determine the critical path and calculate total float for activities.