Download as PDF, PPTX


![Linear congruential generator
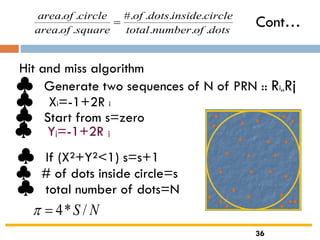
Generating a random sequence of numbers
{X1,X2,…….,Xk} of length M over the interval [0,M-1]
Xi=mod(AXi-1+C,M)
R=Xi/M
♠♠♠ mod(b,M)=b-int(b/M)*M
● Starting value X0 is called “seed”
●M,A and C are nonnegative integers known
Modulus, multiplier and increment, respectively
●M is must be prime number(2³¹-1,2 -1,…..)
34](https://image.slidesharecdn.com/unitiii-191204063343/85/MG6088-SOFTWARE-PROJECT-MANAGEMENT-34-320.jpg)
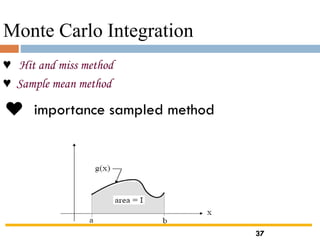


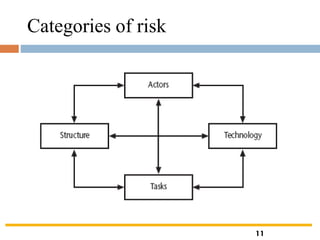
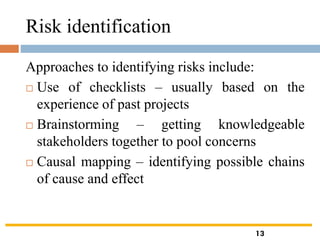
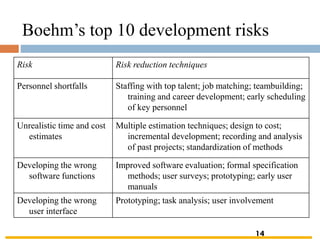
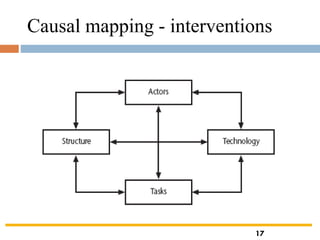
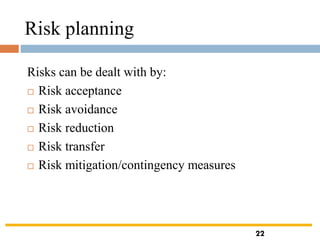
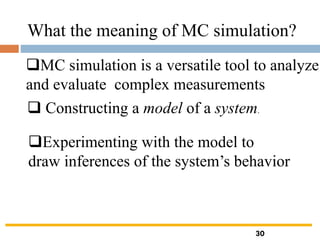
The document outlines the objectives and processes involved in software project management, focusing on activity planning, risk management, and resource allocation. It covers techniques such as PERT, Monte Carlo simulation, and critical path methods for project scheduling and risk assessment. Additionally, it discusses strategies for identifying and mitigating project risks, along with the importance of effective resource management in achieving project goals.