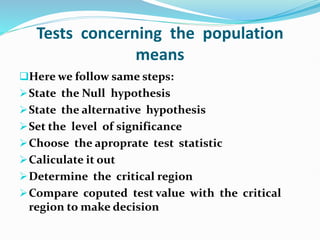
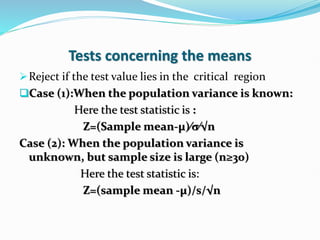
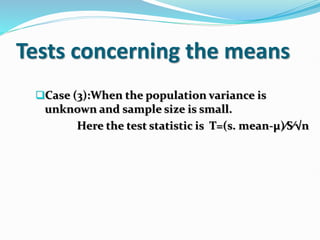
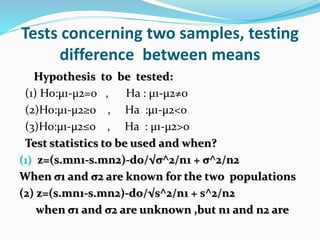
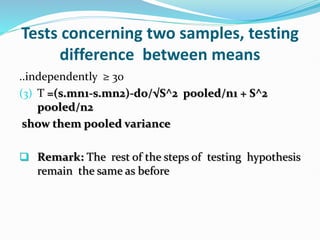
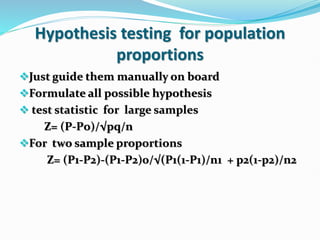
1. The document discusses hypothesis testing, including defining the null and alternative hypotheses, types of errors, test statistics, and testing differences between population means and differences between two samples.
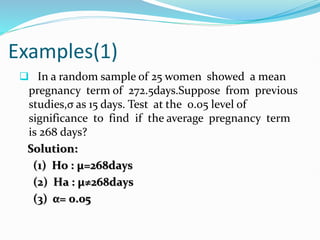
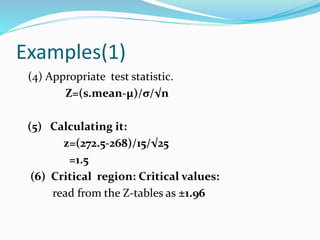
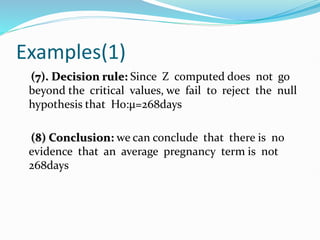
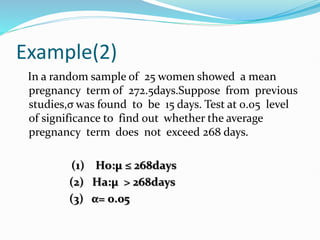
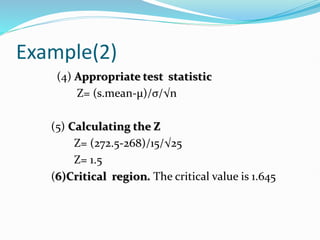
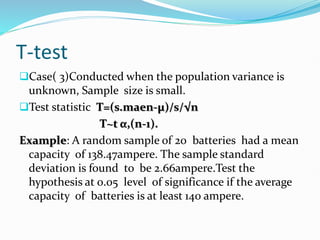
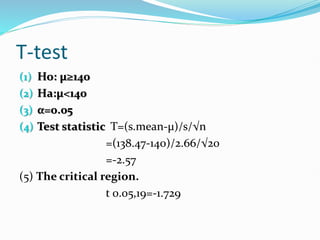
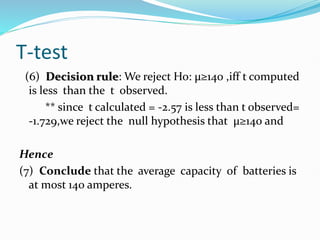
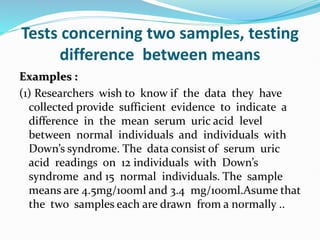
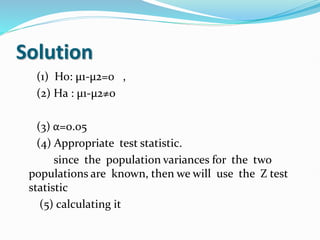
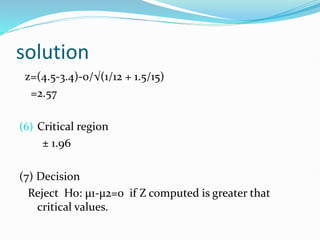
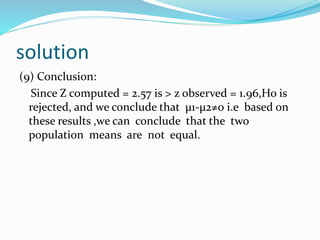
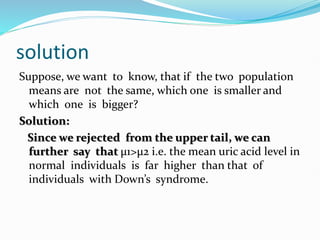
2. Examples are provided to demonstrate hypothesis testing for one and two sample means. This includes stating the hypotheses, significance level, test statistic, critical region, and conclusion.
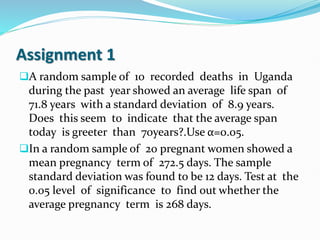
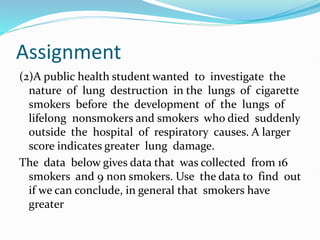
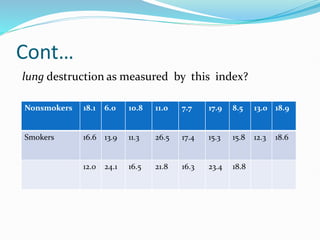
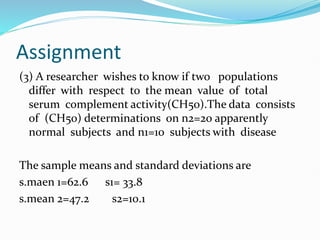
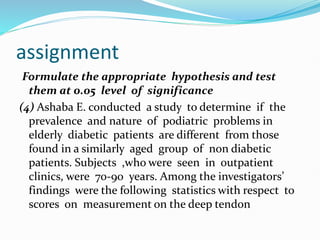
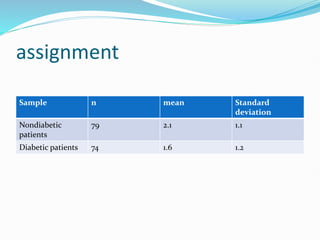
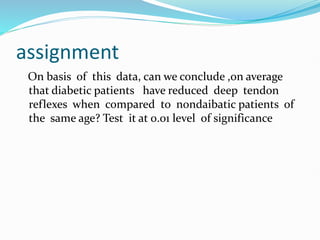
3. Assignments are given applying hypothesis testing to compare lung destruction between smokers and non-smokers, serum complement activity between disease and normal subjects, and podiatric problems between elderly diabetic and non-diabetic patients.