The document provides an overview of hypothesis testing, including:
1) The process of hypothesis testing involves deciding between a null and alternative hypothesis based on sample data.
2) The null hypothesis states there is no difference from the claimed population parameter, while the alternative hypothesis states there is a difference.
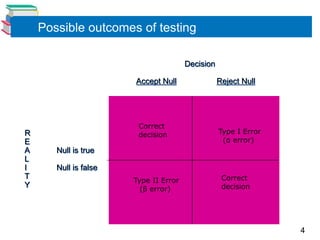
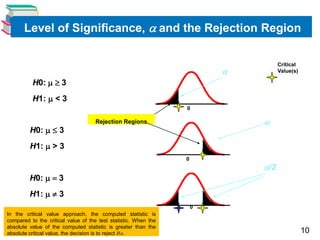
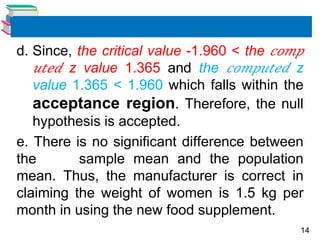
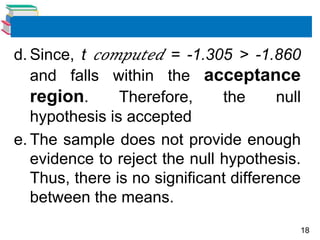
3) Hypothesis tests use critical values and rejection regions based on the level of significance to determine whether to reject or fail to reject the null hypothesis.
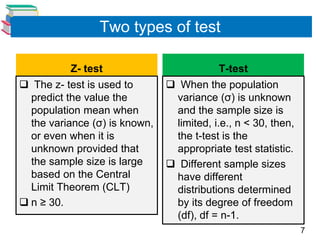
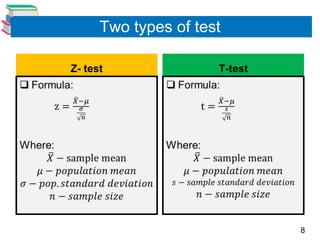
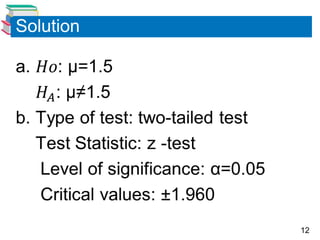
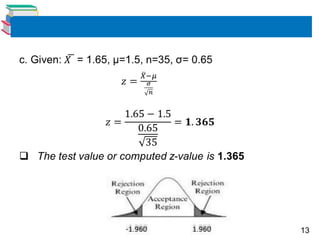
4) Examples are provided to demonstrate conducting hypothesis tests using z-tests and t-tests, and interpreting the results.