Downloaded 196 times


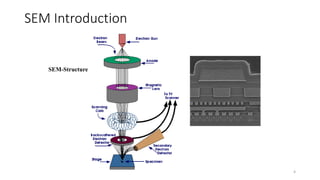


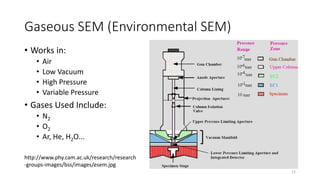


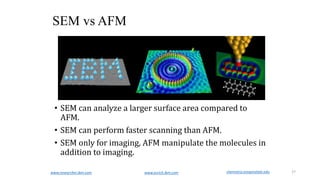


Scanning electron microscopy (SEM) is a technique used to image surfaces at high magnifications. SEM can be used to examine biological tissues, polymers, and metals. Environmental SEM allows imaging of non-conductive wet samples in low vacuum or gas conditions. Atomic force microscopy (AFM) provides complementary high-resolution topographic information to SEM. While SEM provides faster wide-area imaging, AFM enables manipulation and analysis of samples at the nanoscale. Various techniques like stereo-photogrammetry and stacked images allow generating 3D surface representations from SEM data.


