This document presents an overview of microscopy, focusing on atomic force microscopy (AFM) and its application in studying turtle erythrocyte membranes. It details AFM's components, operation modes, and advantages and limitations, along with the objective and methods involved in characterizing turtle erythrocyte membrane structures. The findings conclude that the inner leaflet has a high density of proteins, whereas the outer leaflet primarily features glycosylated proteins with fewer exposed amino groups.
![OBJECTIVE OF THE STUDY:
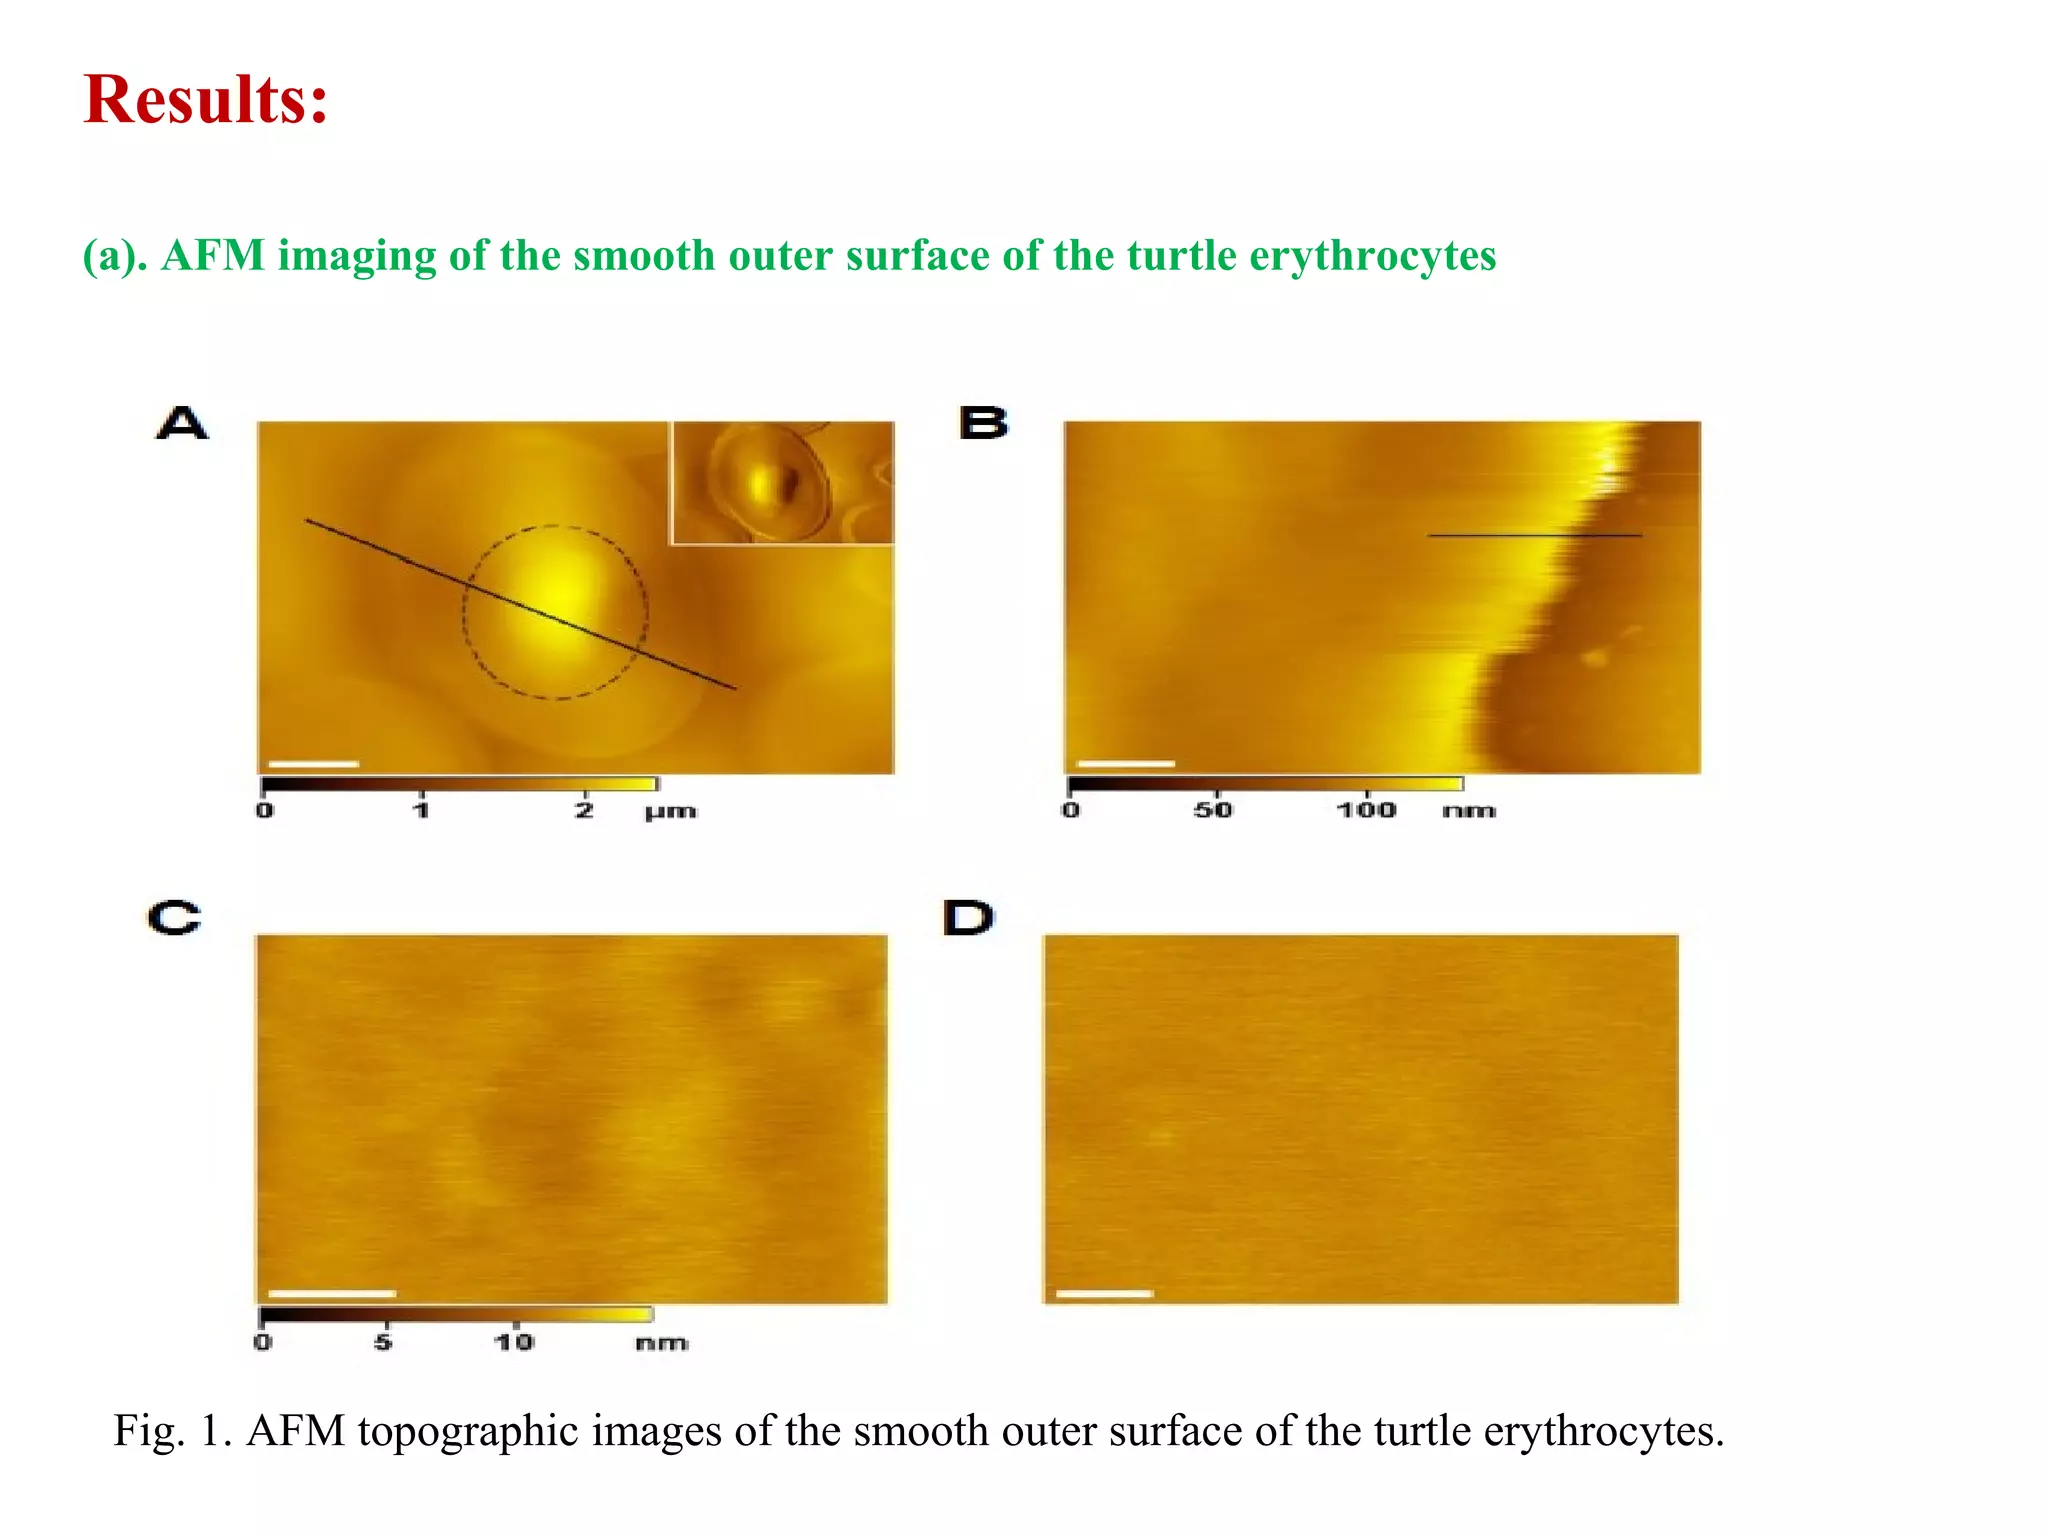
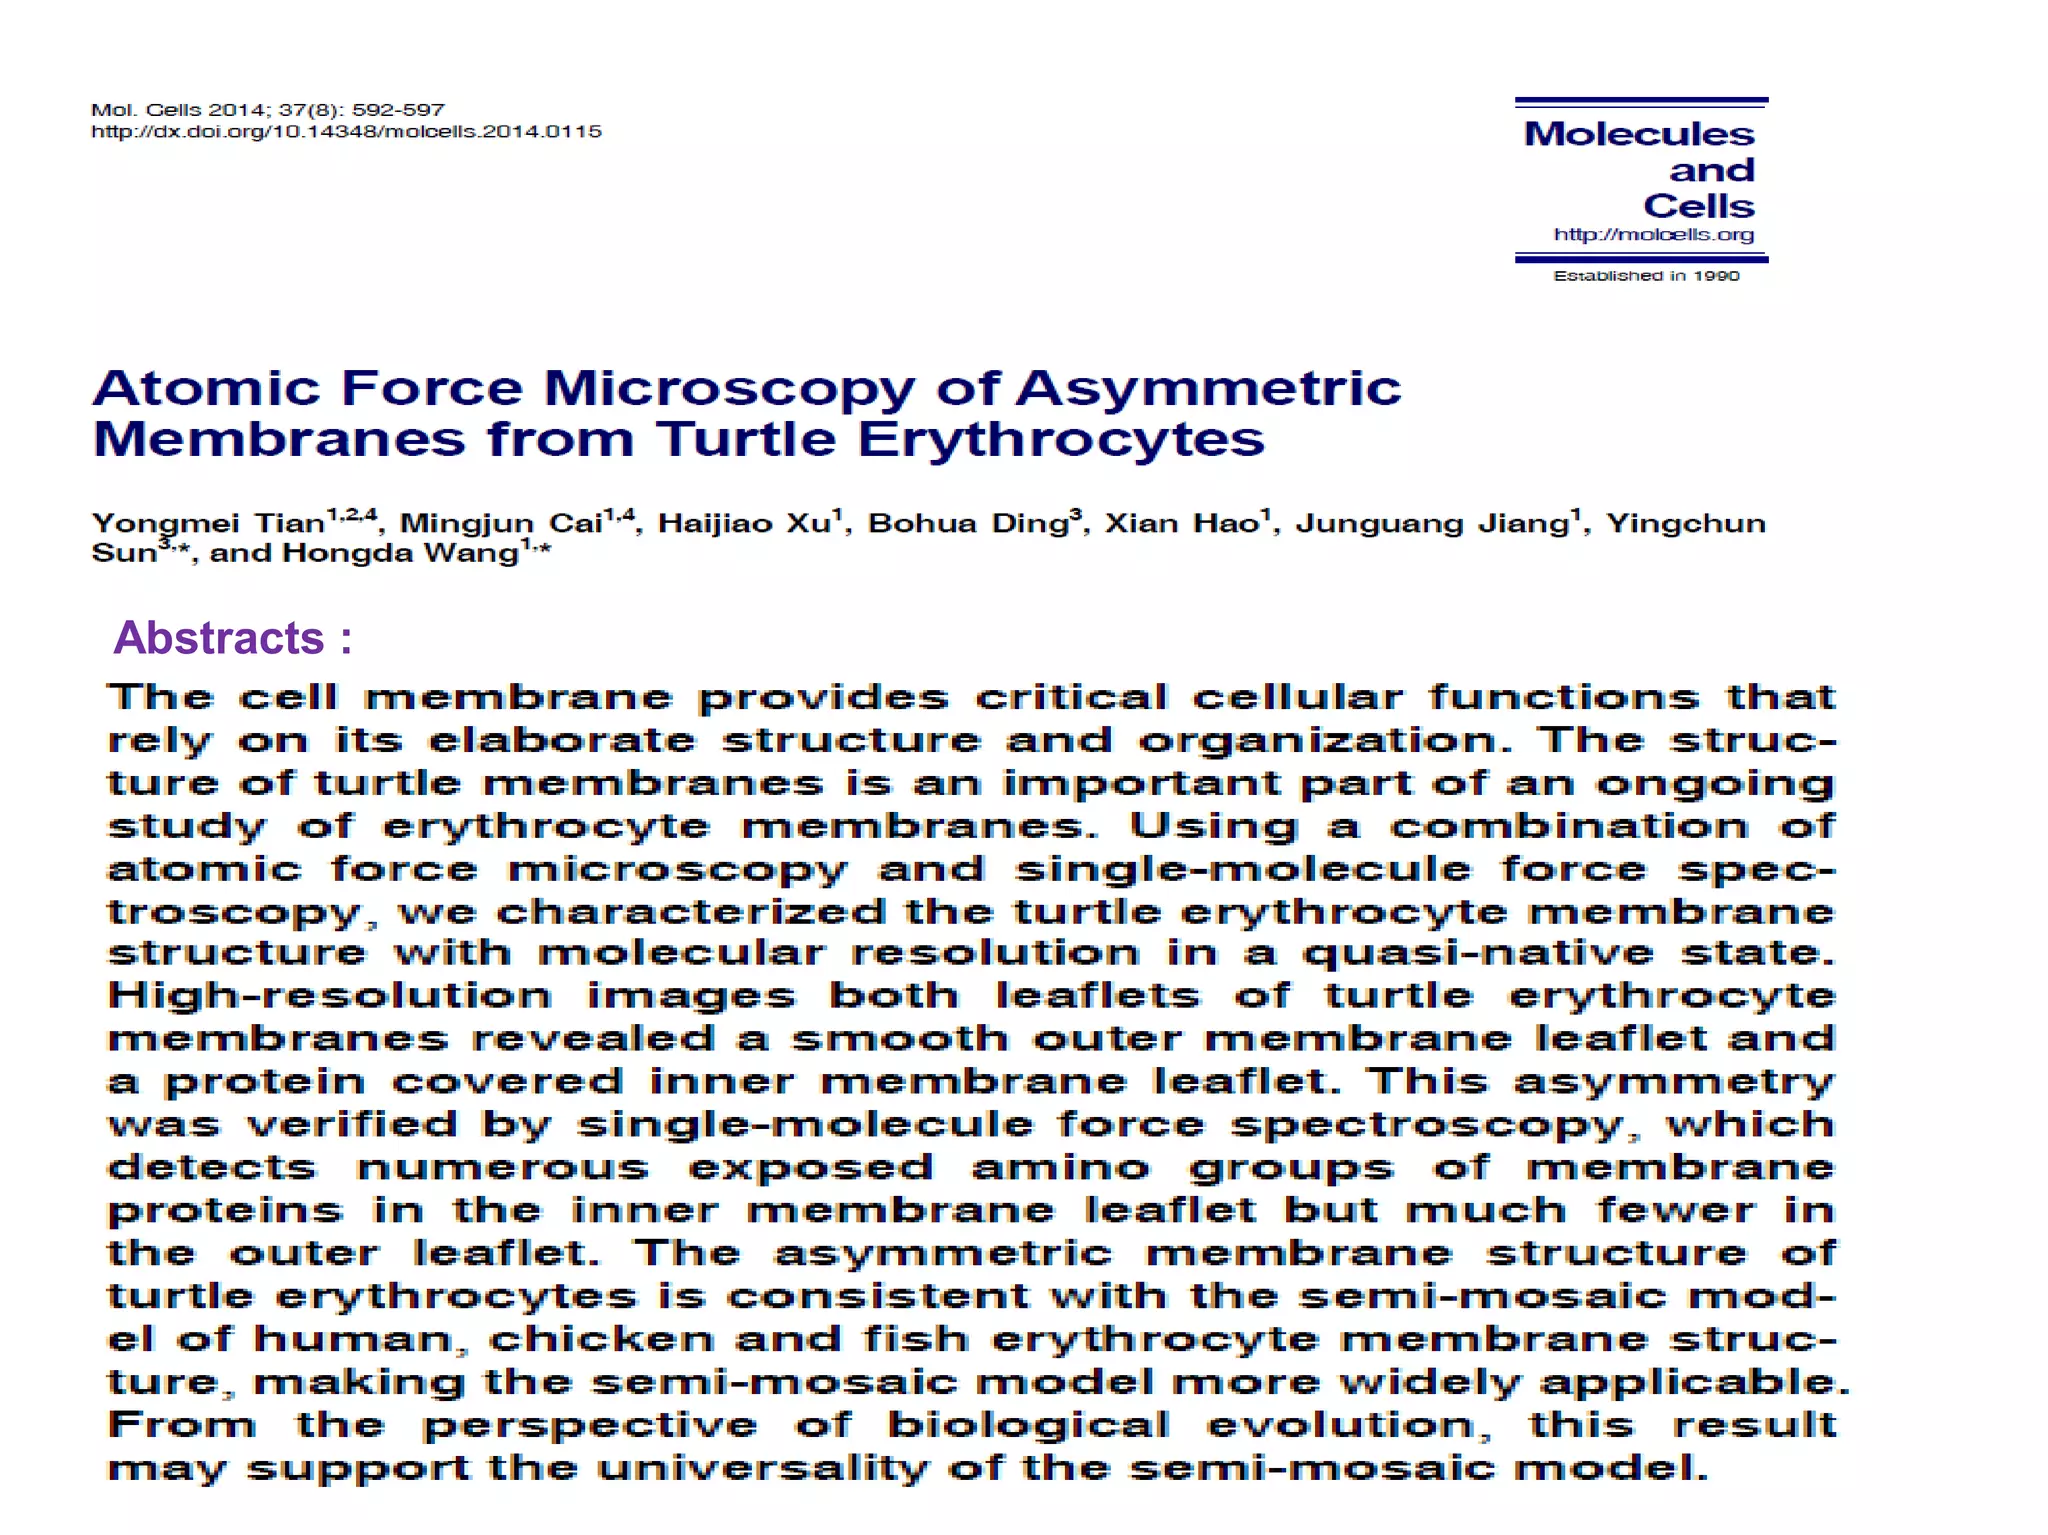
To characterize turtle erythrocyte membrane structure with molecular resolution in a
quasi native state.
METHODS:
[1]. Isolation of Turtle erythrocytes
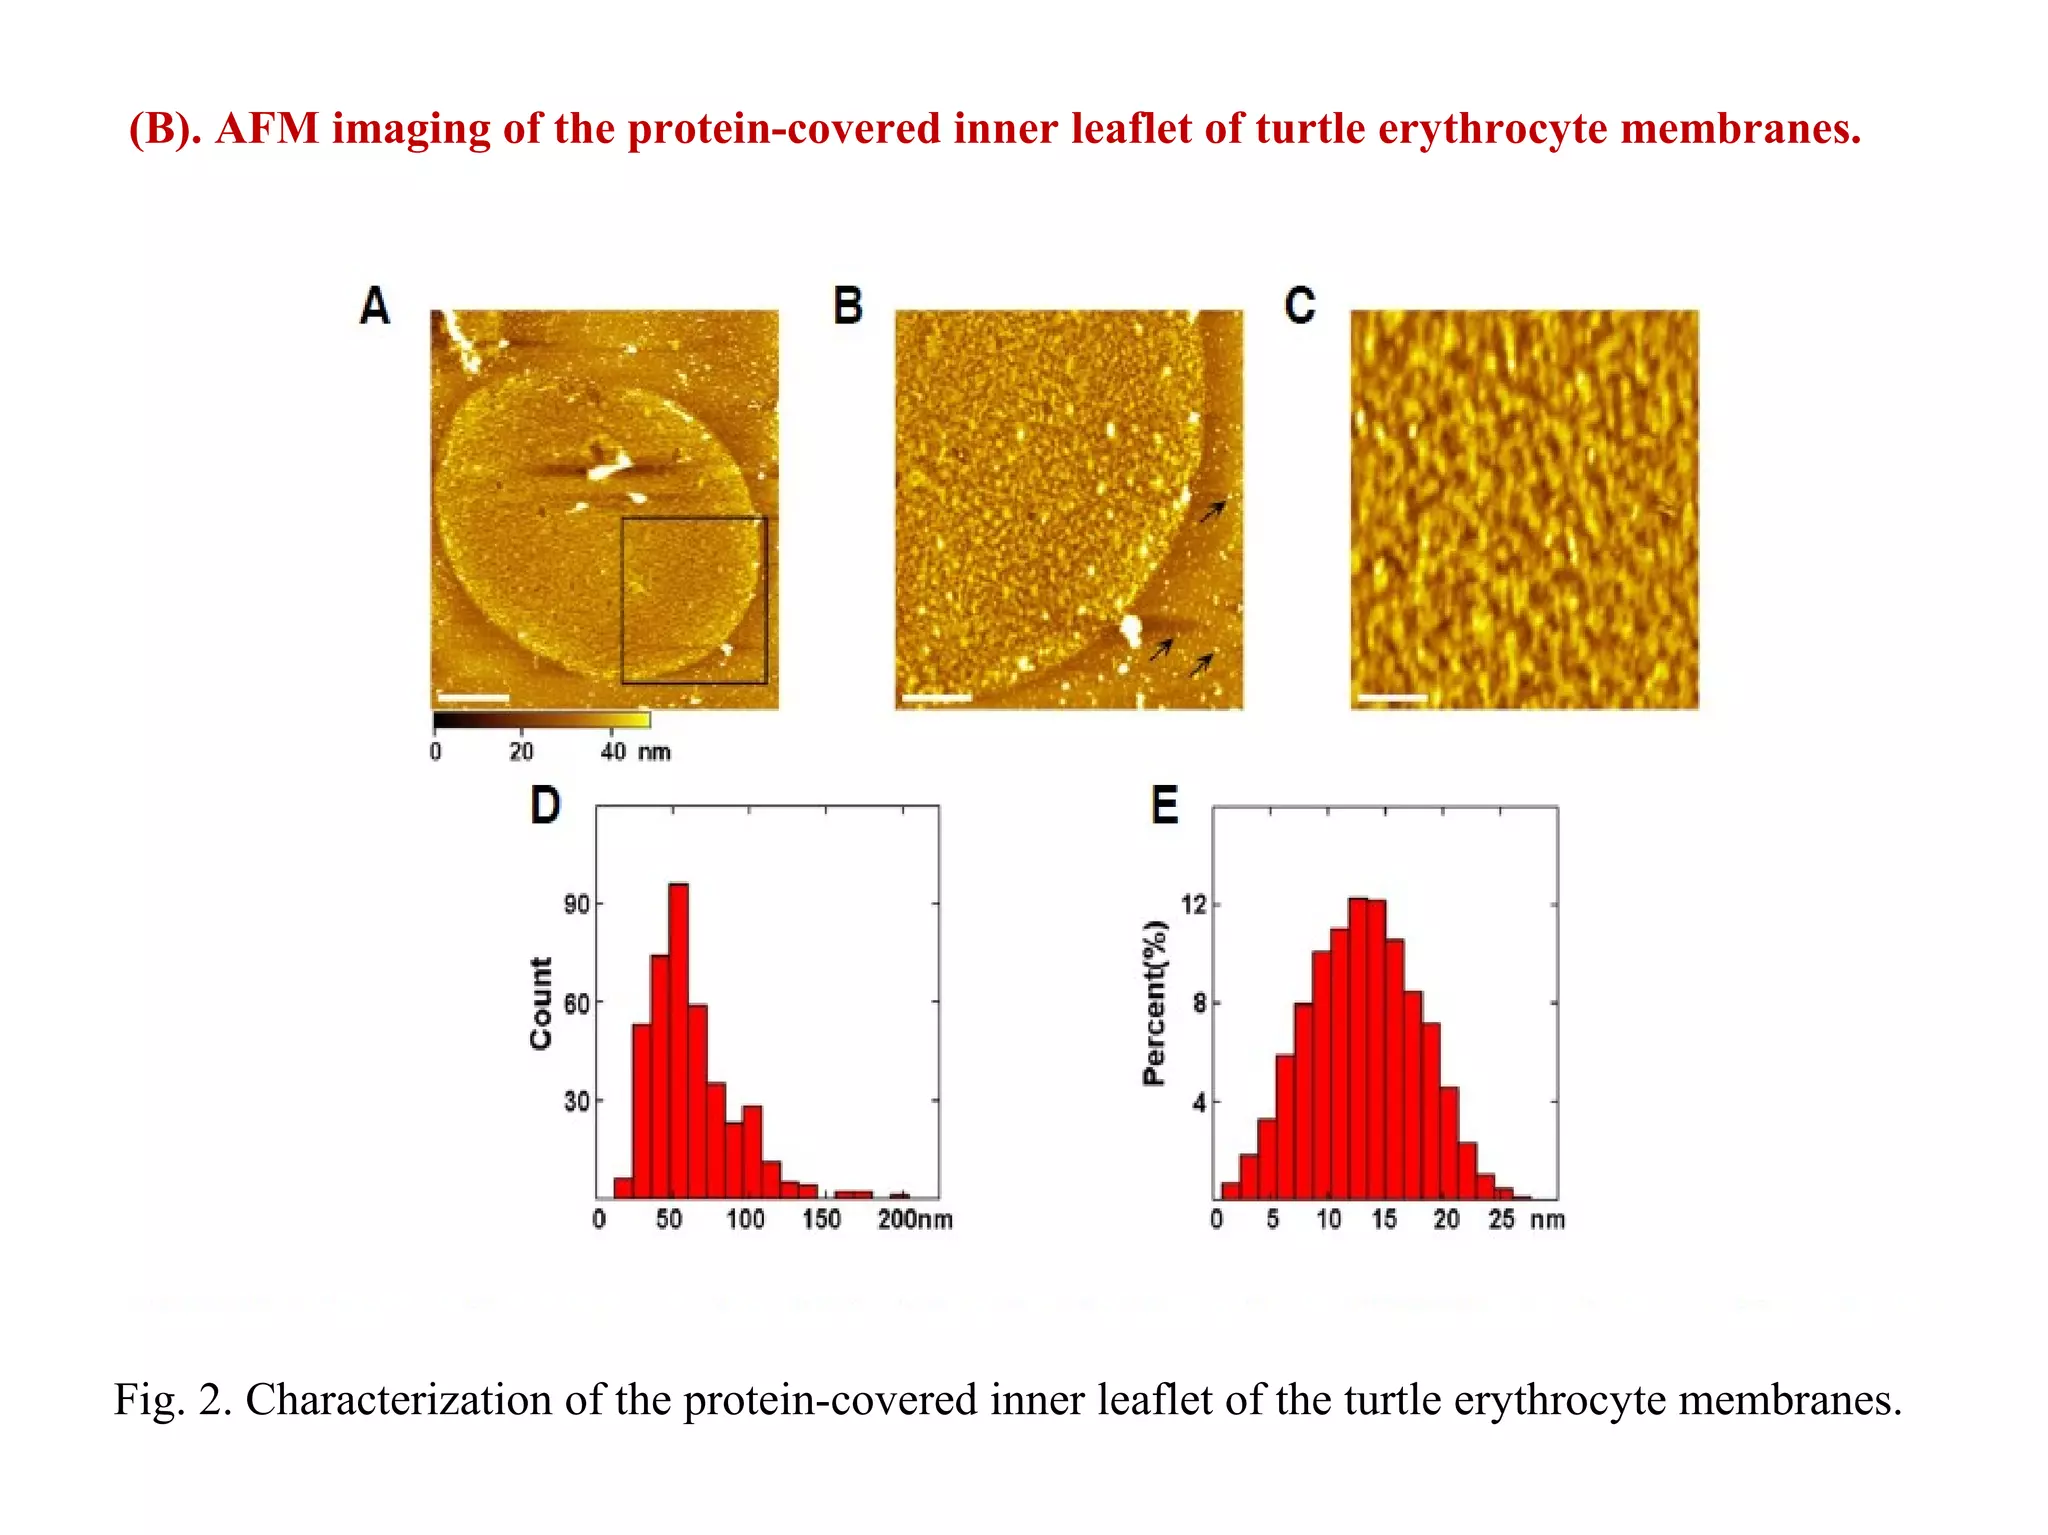
[2]. Preparation of the outer and inner leaflets of erythrocyte
Membranes
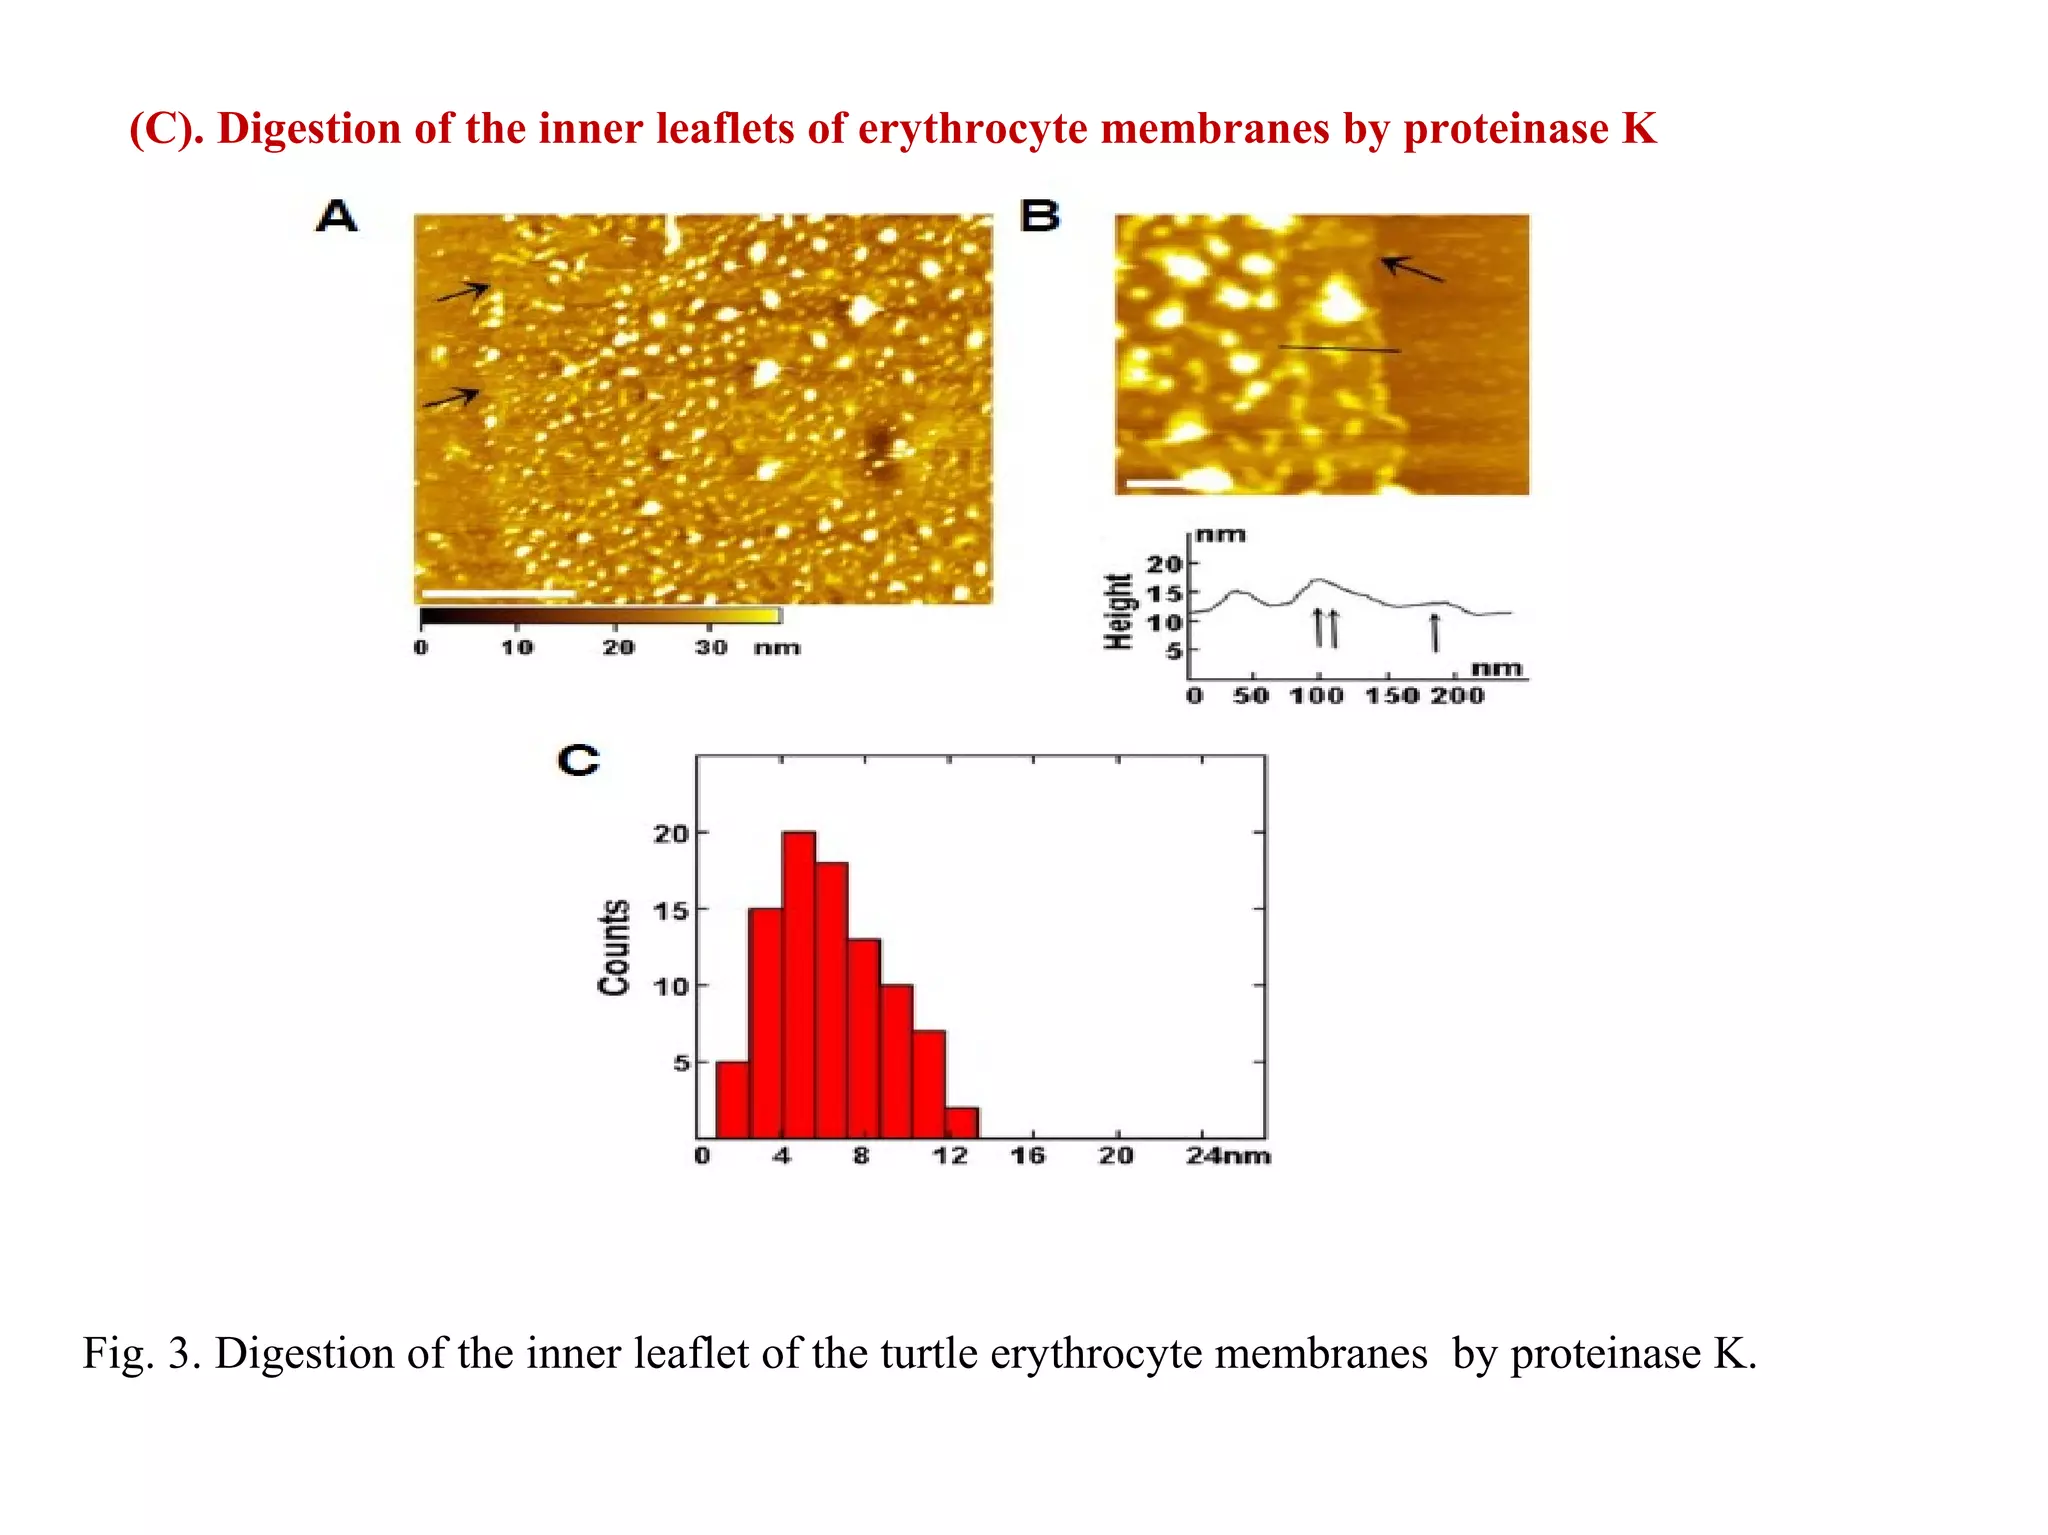
[3]. Digestion of the inner leaflet of erythrocyte membranes with
proteinase K
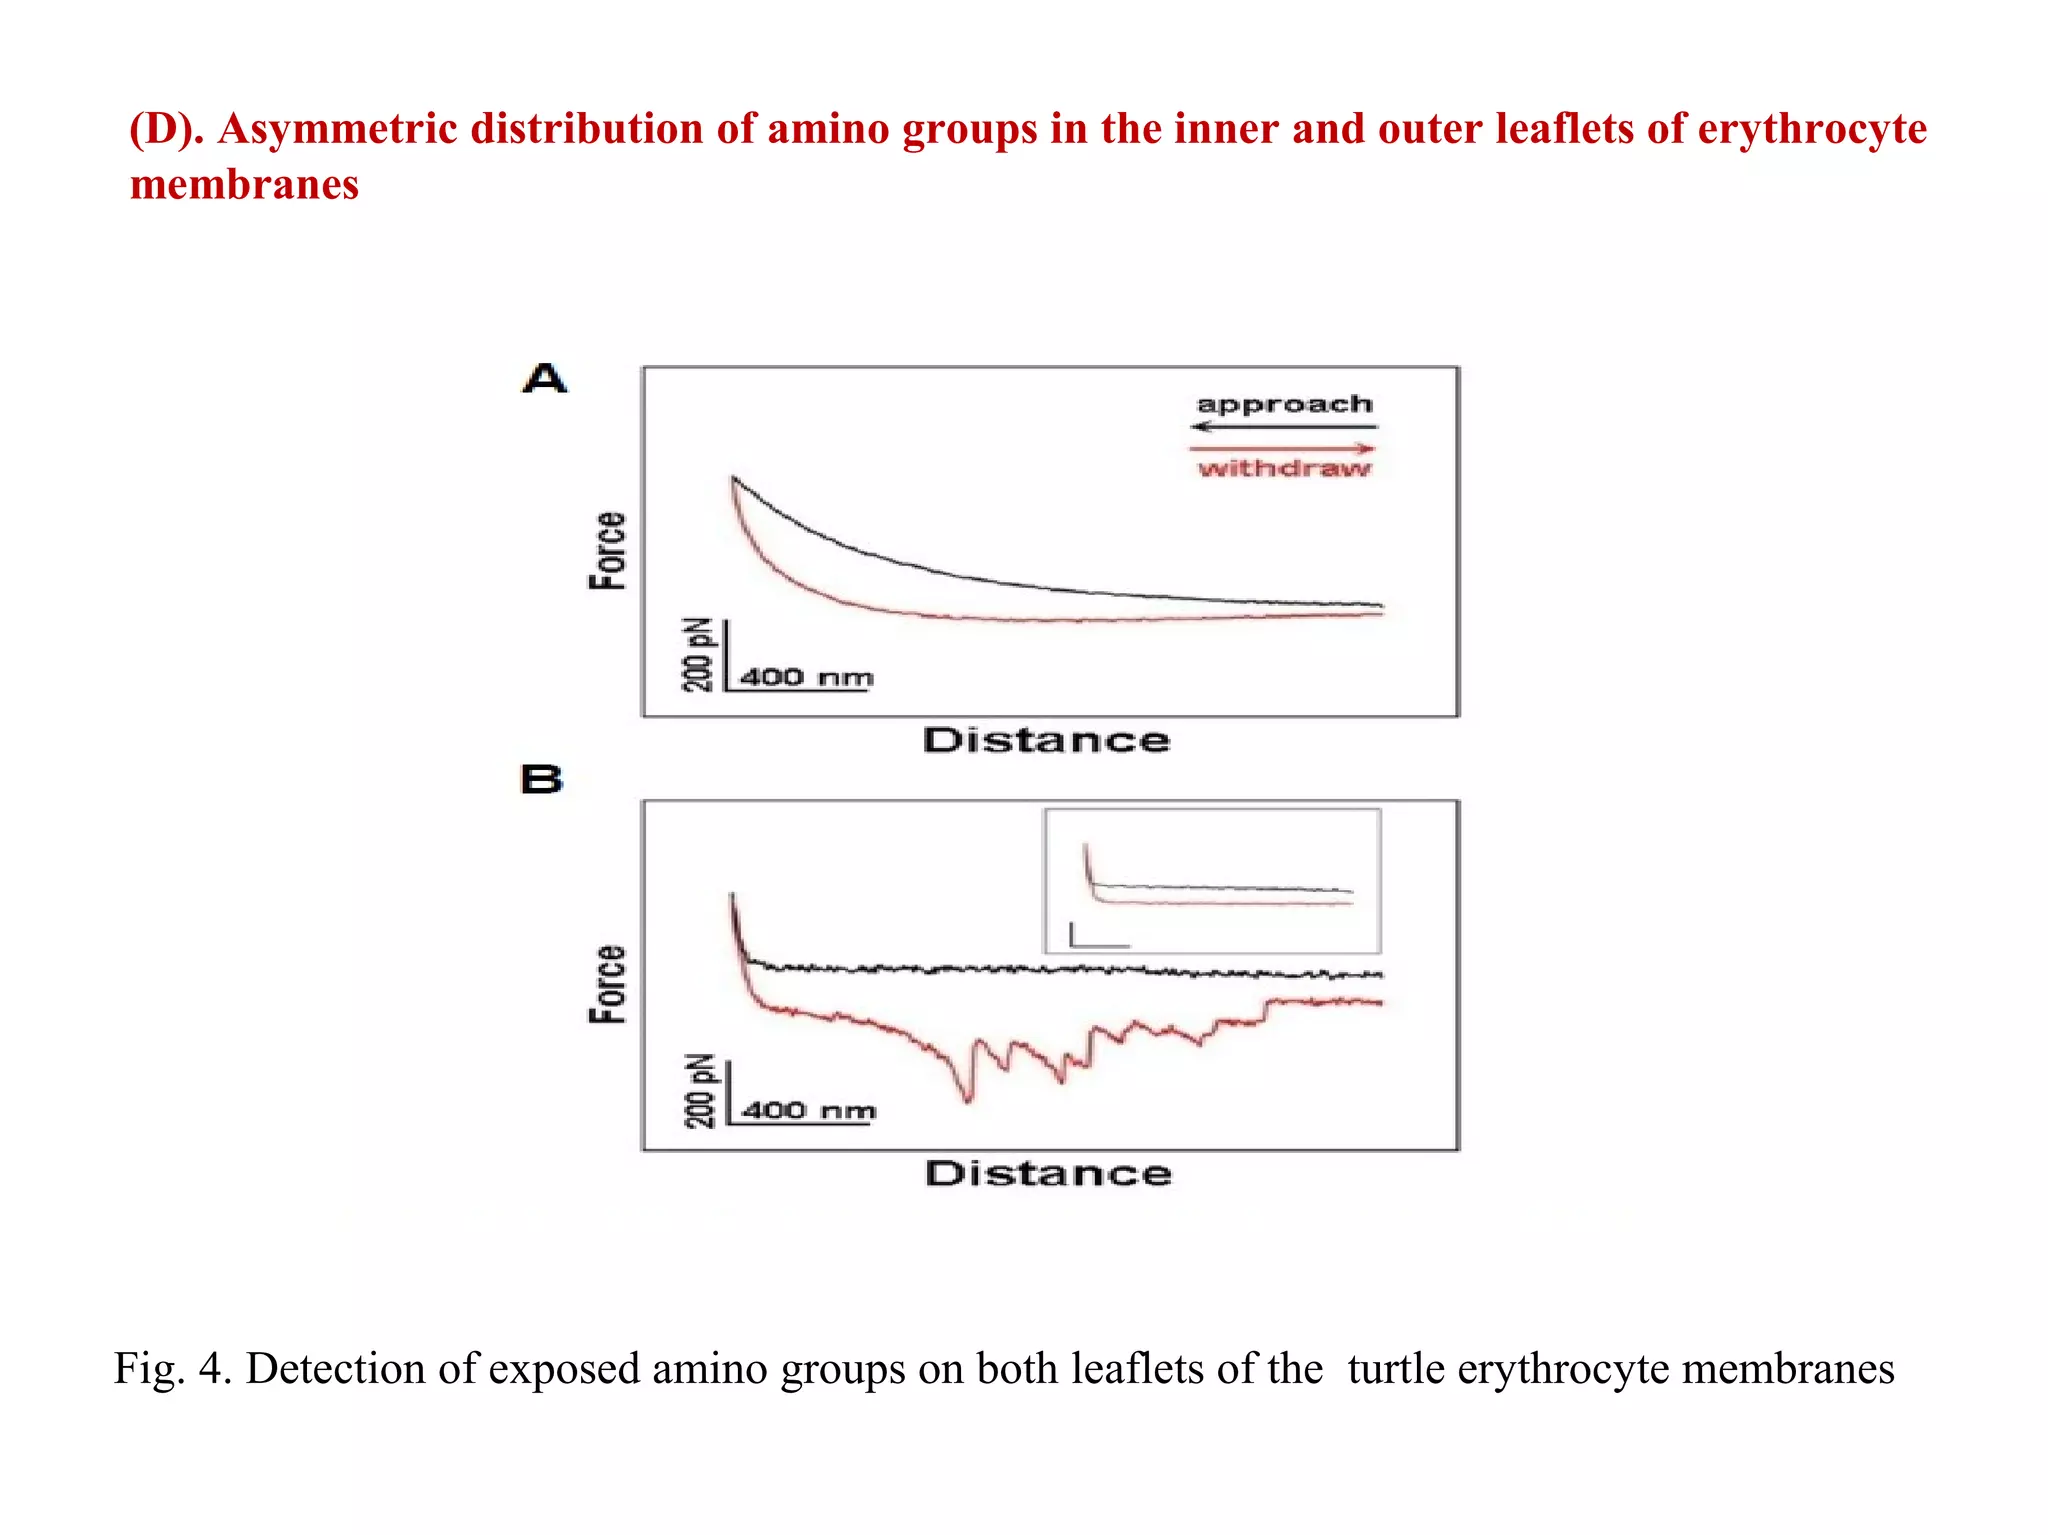
[4]. AFM imaging and force spectroscopy](https://image.slidesharecdn.com/afmmodified-141021033302-conversion-gate01/75/ATOMIC-FORCE-MICROSCOPE-MITHILESH-CHOUDHARY-16-2048.jpg)