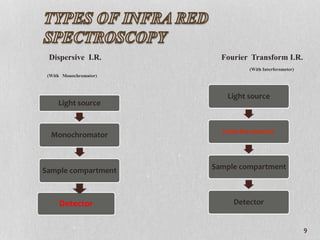
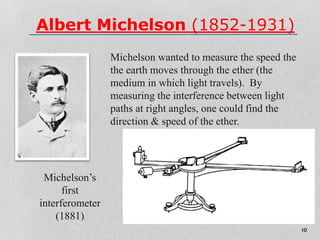
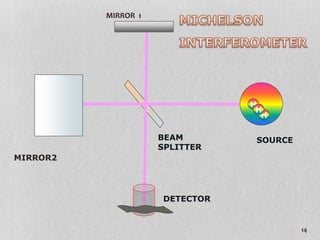
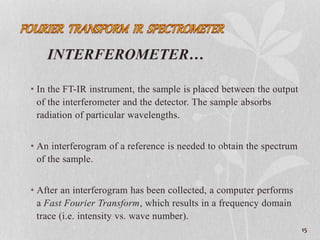
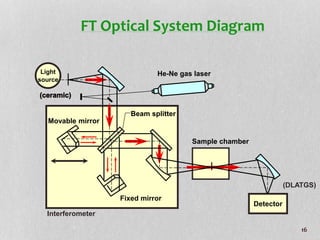
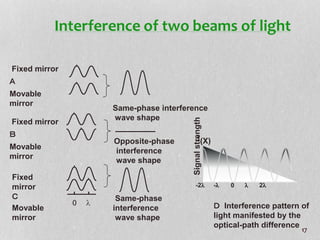
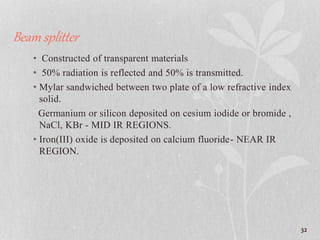
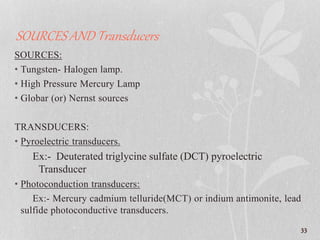
1. The document discusses infrared (FT-IR) spectroscopy, describing the components of an FT-IR instrument including the interferometer.
2. It provides details on the advantages of FT-IR over dispersive IR spectroscopy such as better sensitivity and resolution.
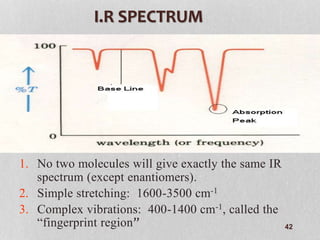
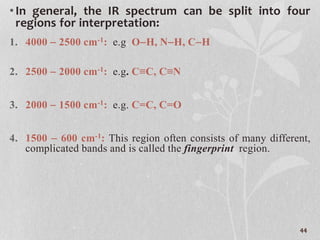
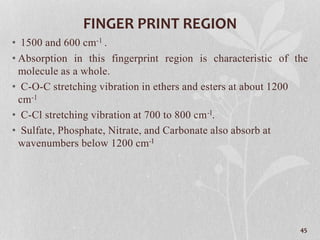
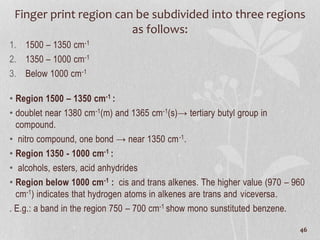
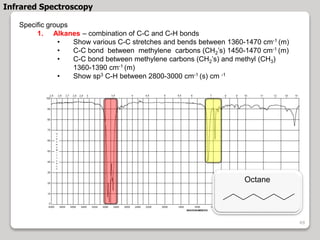
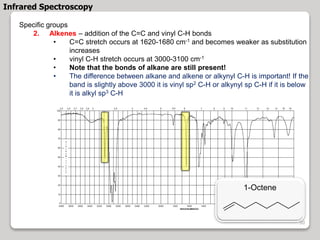
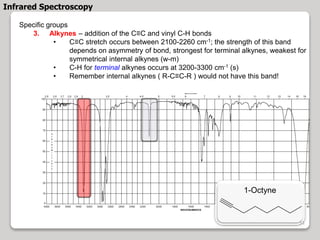
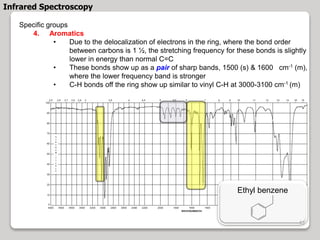
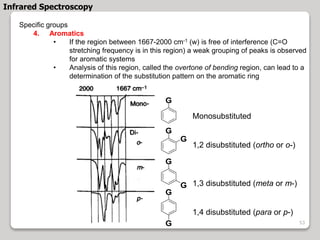
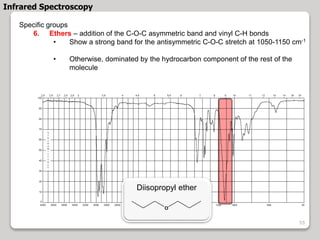
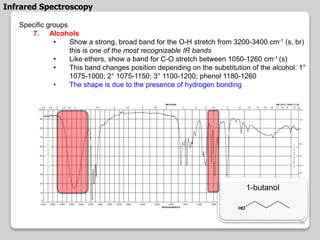
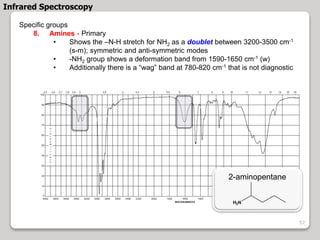
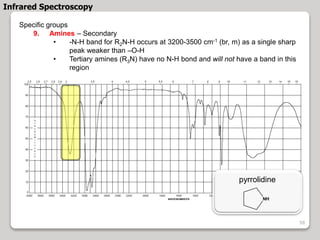
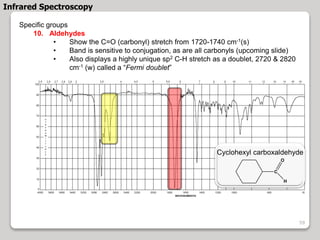
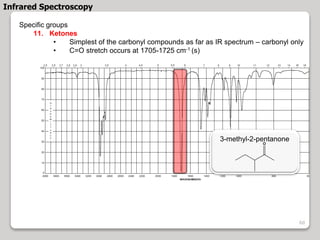
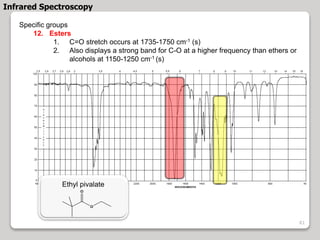
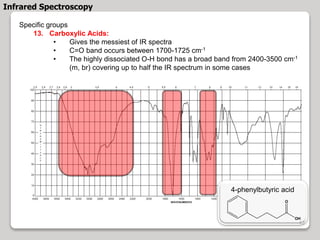
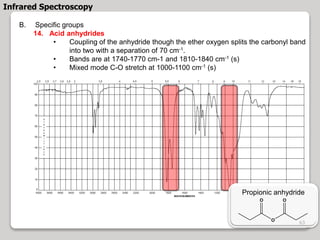
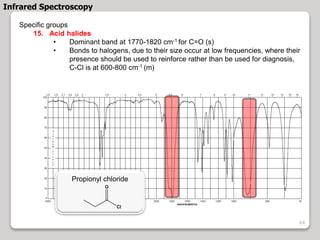
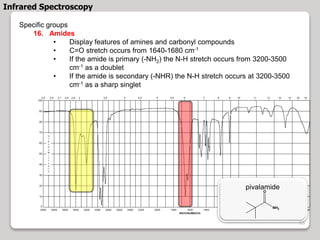
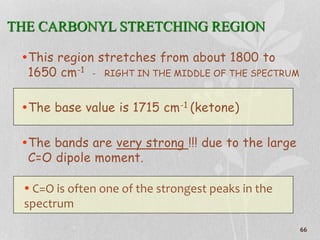
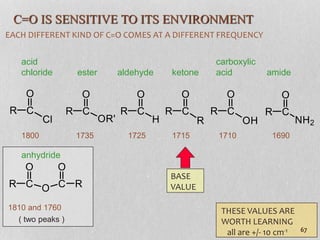
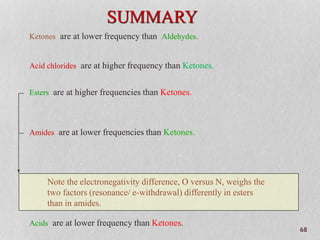
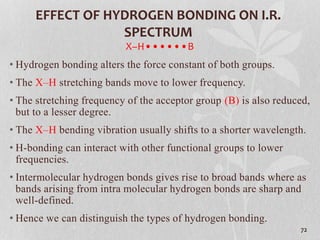
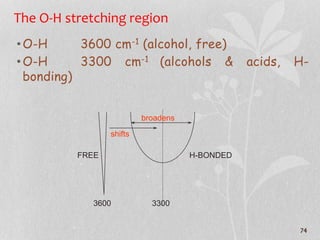
3. The document discusses interpreting IR spectra including identifying functional groups based on their characteristic absorption peaks between 600-4000 cm-1.