Download as PDF, PPTX


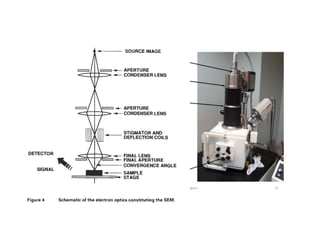


The document provides information on various materials characterization techniques, including scanning electron microscopy (SEM), scanning tunneling microscopy and scanning force microscopy (STM/SFM), transmission electron microscopy (TEM), energy-dispersive X-ray spectroscopy (EDS), scanning transmission electron microscopy (STEM), X-ray diffraction (XRD), X-ray photoelectron and Auger electron diffraction (XPD/AED), and Auger electron spectroscopy (AES). Each technique is described in one or two paragraphs covering its operating parameters, capabilities, sample requirements, and applications.


![SEM_Group_2_ppt[1]..pptxtttttttttttttttt](https://cdn.slidesharecdn.com/ss_thumbnails/semgroup2ppt1-250821082712-4dd54452-thumbnail.jpg?width=640&height=640&fit=bounds)


